Climate change implications of gaming products and services
Status:: 🟩
Links:: Energy consumption & carbon footprint of ICT applications & services, Energy consumption of network communication
Metadata
Authors:: Aslan, Joshua
Title:: Climate change implications of gaming products and services
Date:: 2020
URL:: https://openresearch.surrey.ac.uk/esploro/outputs/doctoral/99512335802346
DOI::
Aslan, J. (2020). Climate change implications of gaming products and services [Doctoral dissertation, University of Surrey]. https://doi.org/10.15126/thesis.00853729
There is increasing concern over the climate change impact of games consoles. There is, however, little research on the life cycle carbon impact of consoles and existing research (the majority of which is focused on usage) is outdated. This study uses life cycle assessment (LCA) methodology to compare the climate change impact of different console-based gaming methods (i.e. games played from a disc, a down-loaded file, or streamed from the cloud). Console usage and Internet usage were identified as life cycle stages where data were unknown or uncertain. Two studies to improve the understanding of these areas were undertaken in this research and used to complete a cradle-to-grave carbon footprint study of gaming (compared using a functional unit of carbon equivalent emissions per hour of gameplay). Results estimated that, for average cases, download is the lowest carbon method of gaming at 0.047 kgCO2e/h, followed by disc at 0.055 kgCO2e/h. Cloud gaming has higher estimated carbon emissions at 0.149 kgCO2e/h, largely due to the additional energy consumed during use in the Internet, gaming servers, and home router equip-ment. These findings only represent average cases and the size of game files and length of gameplay time were found to be key variables significantly impacting the results. For example, for games played for under 8 hours, cloud gaming was found to have lower carbon emissions than downloads (up to 24 hours when compared to disc). In order to analyse these results, a new method for identifying which gaming method has the lowest carbon emissions with variation in both file size and gameplay time was developed. This has allowed for the identification of the thresholds in which different gaming methods have lowest carbon emissions, for any given range of input variables. The carbon emissions of gaming are highly dependent on consumer behav-iour (which game method is used, how long games are played for, and the type and size of those games) and therefore LCA based on average assumptions for these variables has limited application.
Notes & Annotations
Color-coded highlighting system used for annotations
📑 Annotations (imported on 2024-03-17#07:05:50)
This study has made estimates for the carbon emissions of different gaming methods that are representative of 2017. In order to compare the three gaming methods with functional equivalence, a functional unit of carbon equivalent emissions per hour of gameplay was used. Results show that, for average cases, download is the lowest car- bon method of gaming at 0.047 kgCO2e/h, followed by disc at 0.055 kgCO2e/h. Cloud gaming has approximately triple the carbon emissions of disc and download at 0.149 kgCO2e/h, largely due to the additional energy consumed during use in the Internet, gaming servers, and home router equipment.
The approach used should at least provide representative estimates of transmis- sion networks at the national level.
Estimates should be based on data representative of the range of equipment deployed in national-level networks (i.e. including any legacy devices).
If extrapolation is used, it should be based on analysis of planned future tech- nological development and improvement over short periods (using industry roadmaps) rather than past trends alone.
Estimates must be based on data inclusive of all access network types within the network under study, based on data flows through each network in a given year.
Some types of networking equipment, such as access network and home routers, do not typically scale energy use effectively with data traffic, consuming similar energy when in high and low use (Harrington and Nordman 2014).
Estimates for utilization must reflect the average diurnal usage exhibited in networks, i.e. not 100%.
Where PUE is a required assumption, average values should be between 1.8 and 2.0 in recent years (possibly higher for estimates for the early 2000s, and lower for more advanced facilities).
Number of hops is a measure of how many different nodes data pass through in the data transmission network. Values for number of hops ranged from 12 (Schien and Pre- ist 2014) to 24 (Coroama et al. 2013) and is an assumption applied in six of the 14 studies.
Estimates for number of hops should be corroborated by empirical data and be representative of data flows across the whole network.
In future, networking equipment may scale its power consumption with different levels of utilization, and also enter more power efficient idle modes when inactive (IEA, 2014). Consequently, allocation methods must be continually updated to reflect changes in networking technology and energy performance.
Estimates for average transmission network electricity intensity that meet these criteria show a halving of intensity every two years. Our regression can be used to estimate In- ternet core and access network electricity use for each year between 2000 and 2015, helping to resolve previous uncertainty in this area. More research is required to update estimates for current and future years, and improve certainty of estimates and trends.
Since the publication of this study, a new estimate for 2018 has been added to the graph, which follows the original trend identified closely. This estimate comes from new research from Malmodin and Lundén (2018) and was confirmed through email commu- nication with the researcher.
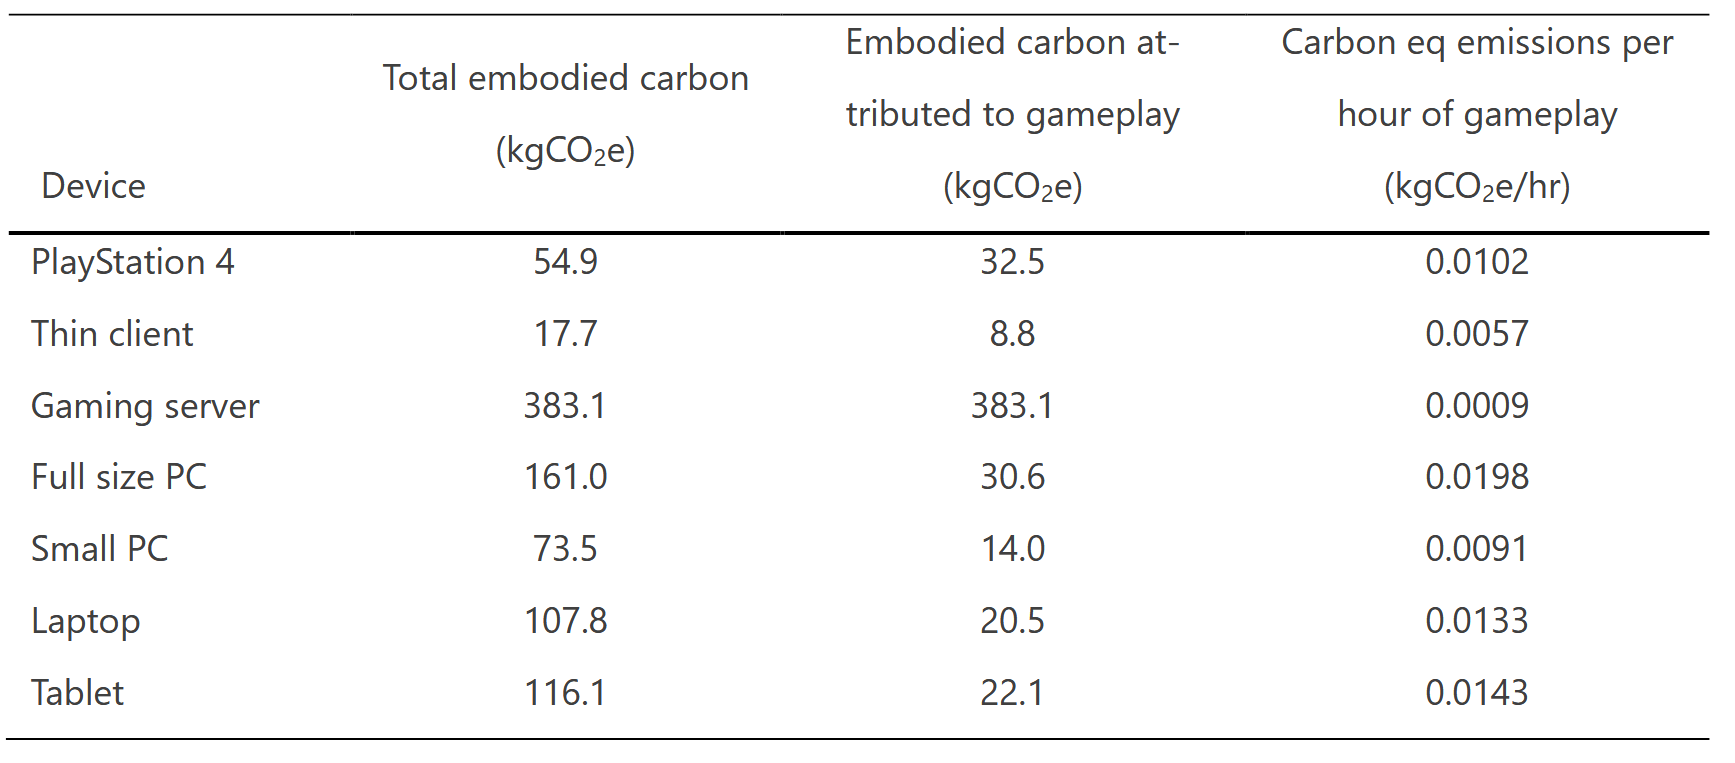
Carbon emissions for hardware production normalised to the functional unit
The bottom-up calculations for the carbon intensity of the content distribution network (CDN) based on Cisco server energy use is given in Table 33, estimated at 0.0013 kgCO2e/GB.
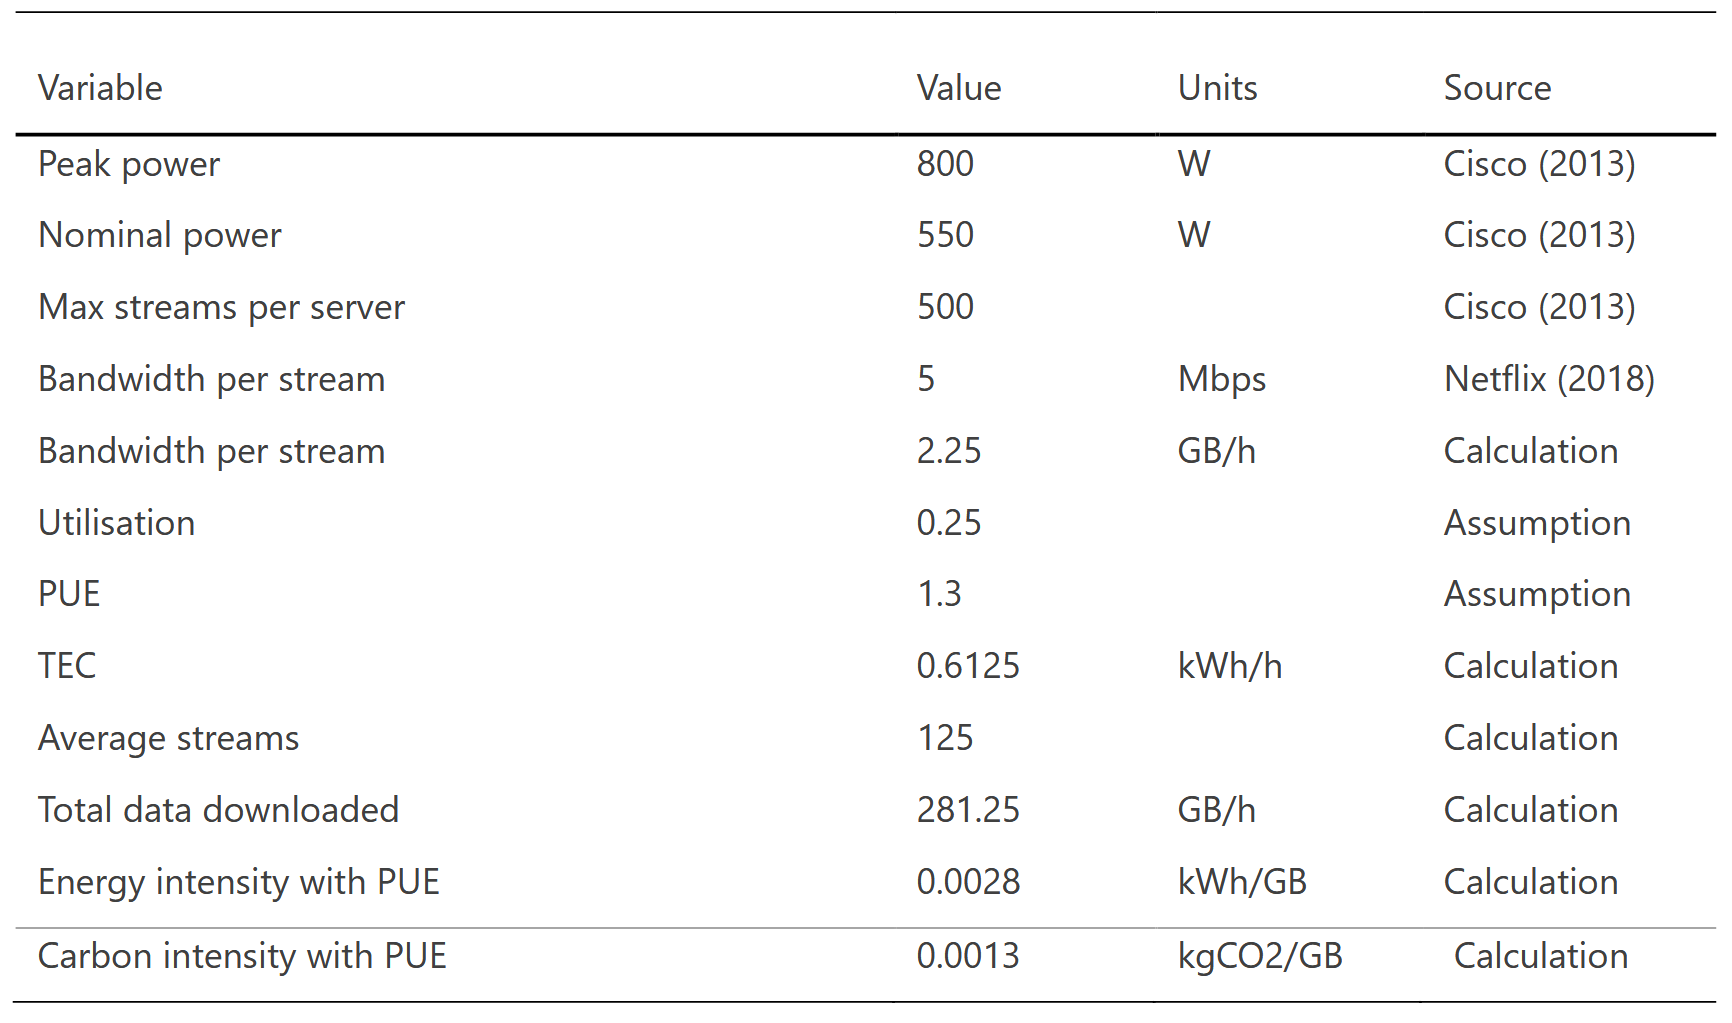
Table 33: CDN carbon intensity calculation (bottom up)
ich glaube in der Tabelle 33 ist ein Fehler drin. Es müssten bei "Energy intensity with PUE" 0.028 ansatt 0.0028 sein. Im Text danach wird auch von 0.028 gesprochen.
Data for the electricity intensity of the core and access networks for the digital store transaction is taken from Aslan et al. (2018). As discussed in previous chapters, the elec- tricity intensity of the data transmission network is estimated to have halved from 2015 to 2017, at 0.028 kWh/GB.
For 2017, the electricity intensity of data transmission is estimated by Aslan et al. (2018) to be 0.026 kWh/GB. Aslan et al. (2018) identified that the electricity intensity of data transmission is halving approximately every two years; this trend is used to estimate the 2019 electricity intensity of data transmission net- works in this analysis.
The estimated carbon equivalent emissions arising from each of the life cycle stages for the gaming download method are presented in Table 42. The total carbon emissions for this scenario are estimated to be 0.047 kgCO2e per hour of gameplay for an average game with file size 39.3 GB. This is approximately 15% lower than disc gaming. The largest share of estimated carbon emissions also arises from console energy use during the use stage (at 0.03 kgCO2e/hour gameplay) and console production (at 0.01 kgCO2e/hour gameplay).
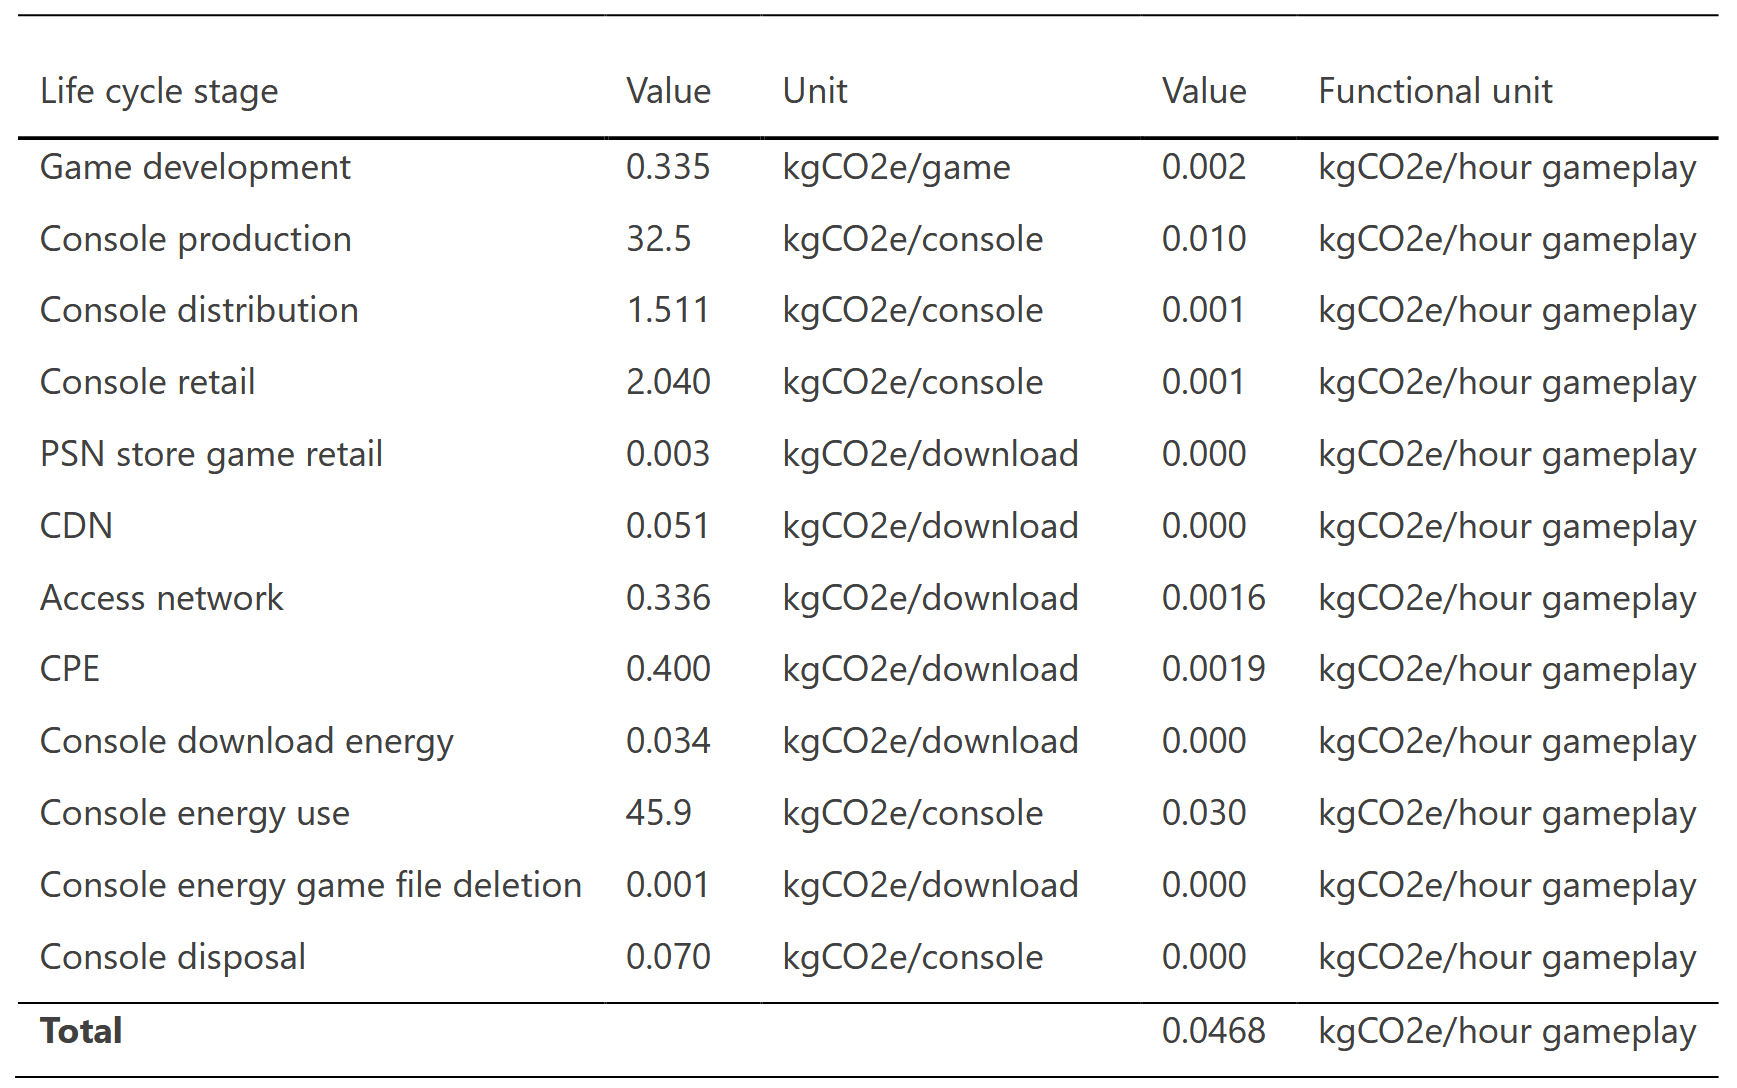
Life cycle carbon emissions from download gaming
The total estimated life cycle carbon emissions of cloud gaming using a console is 0.151 kgCO2e per hour of gameplay.
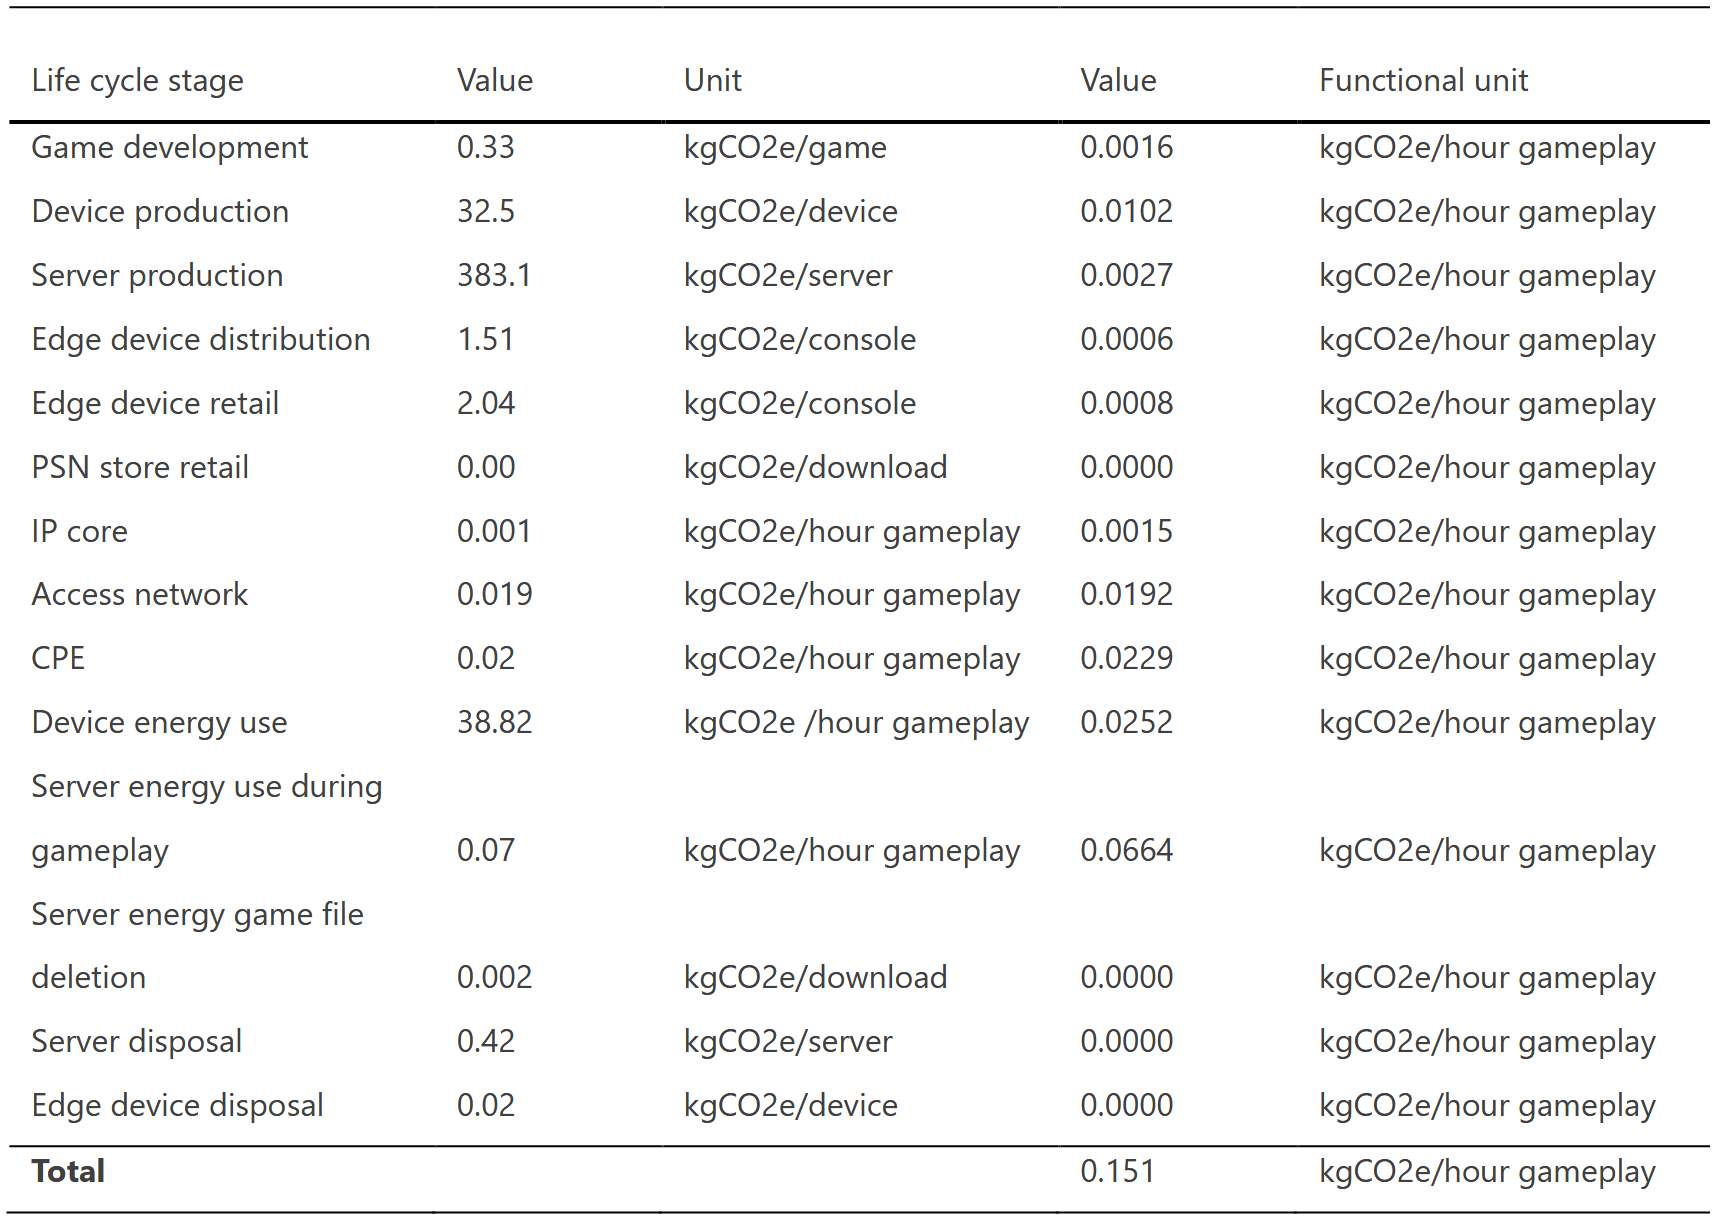
Life cycle carbon emissions from cloud gaming
The highest impact in terms of estimated carbon equivalent emissions arises from the energy use of gaming servers during the use phase (at 0.067 kgCO2e/ hour gameplay). This is over double the carbon emissions of the console use when gaming (0.025 kgCO2e/hour gameplay). This is largely due to the low assumption applied for active capacity of the server, estimated at 25% in 2017.
Figure 45 shows a comparison of the three gaming methods. When considering an av- erage length of time playing the same game, of 214 hours, for a game of average file size 39.3 GB, each gaming method is ranked from least to most carbon intensive as fol- lows: download, disc and then cloud gaming.
The use stage of the life cycle is estimated to have the largest share of carbon equiva- lent emissions for all three gaming methods. The use stage accounts for approximately 40% of the life cycle carbon emissions for disc and download gaming and over 90% for cloud gaming, as shown in Figure 45. This is because the console, server, CPE and data transmission network all consume energy for cloud gaming (compared to disc and download gaming, where only the console consumes energy during use).
The production stage (from raw material extraction and processing to manufacturing and assembly) has the next highest contribution to estimated carbon emissions. For the disc gaming this includes the production of both the disc and console; while for down- load gaming, only the console is included in the production stage.
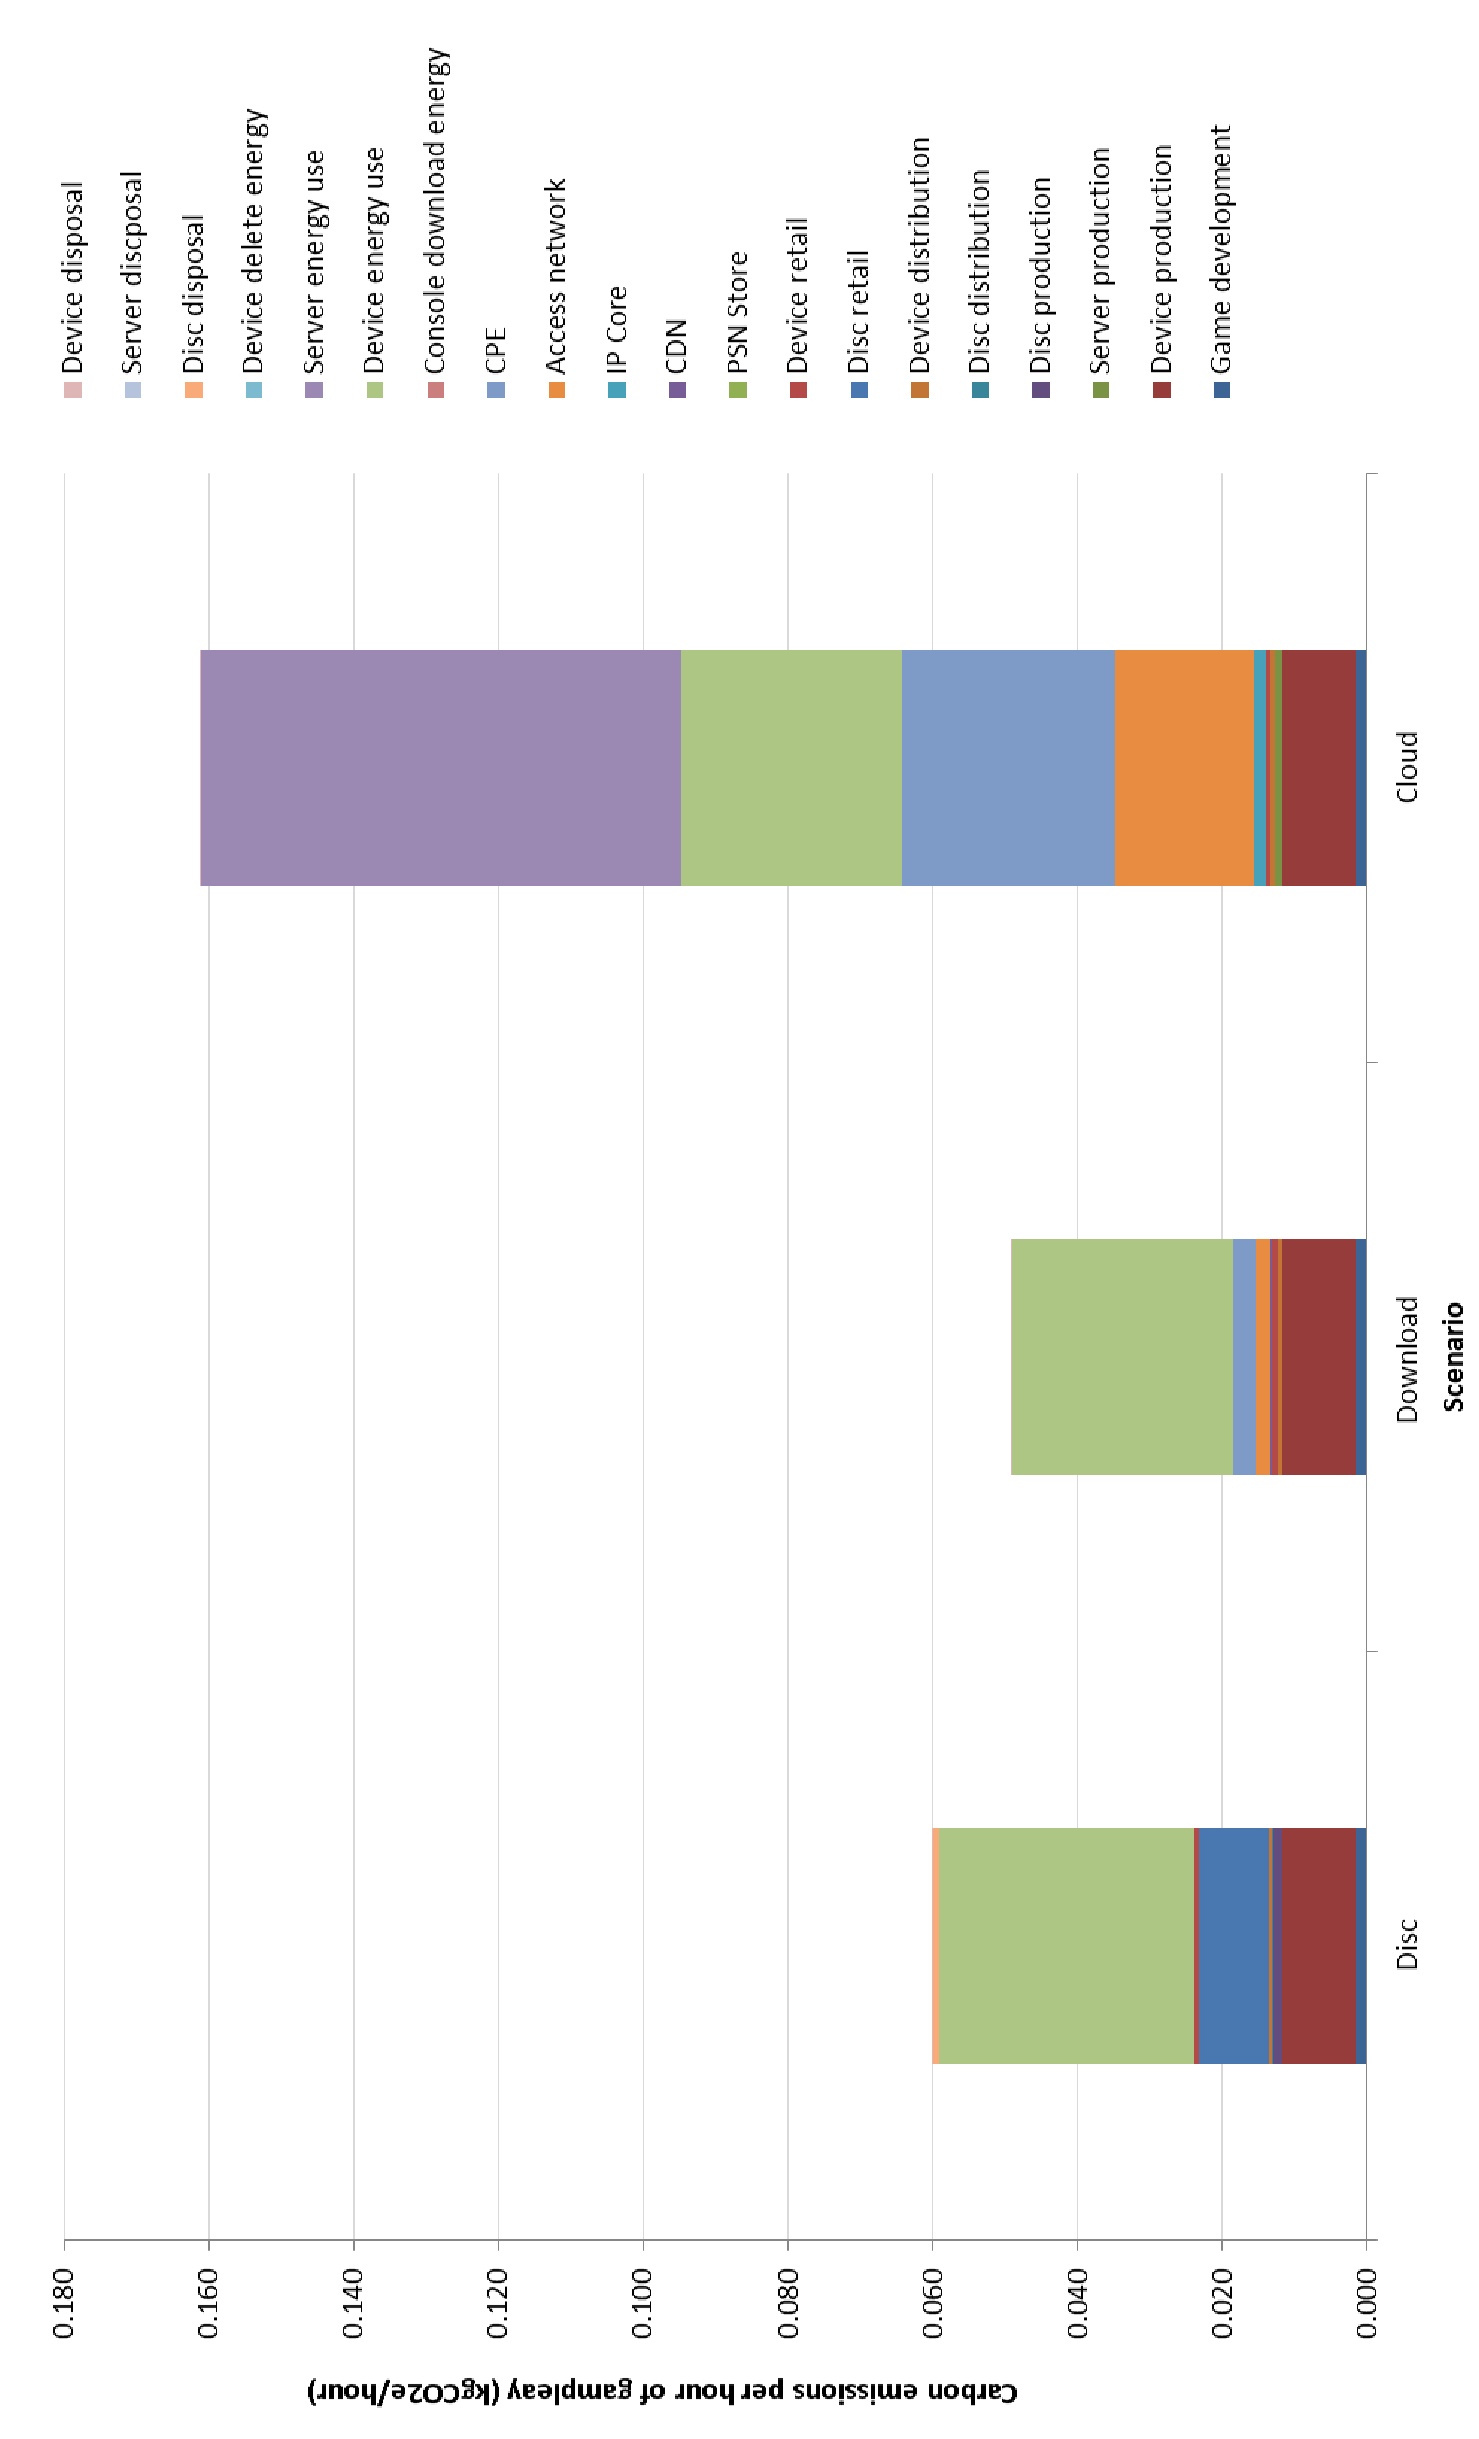
Comparison of life cycle carbon emissions from different gaming modes
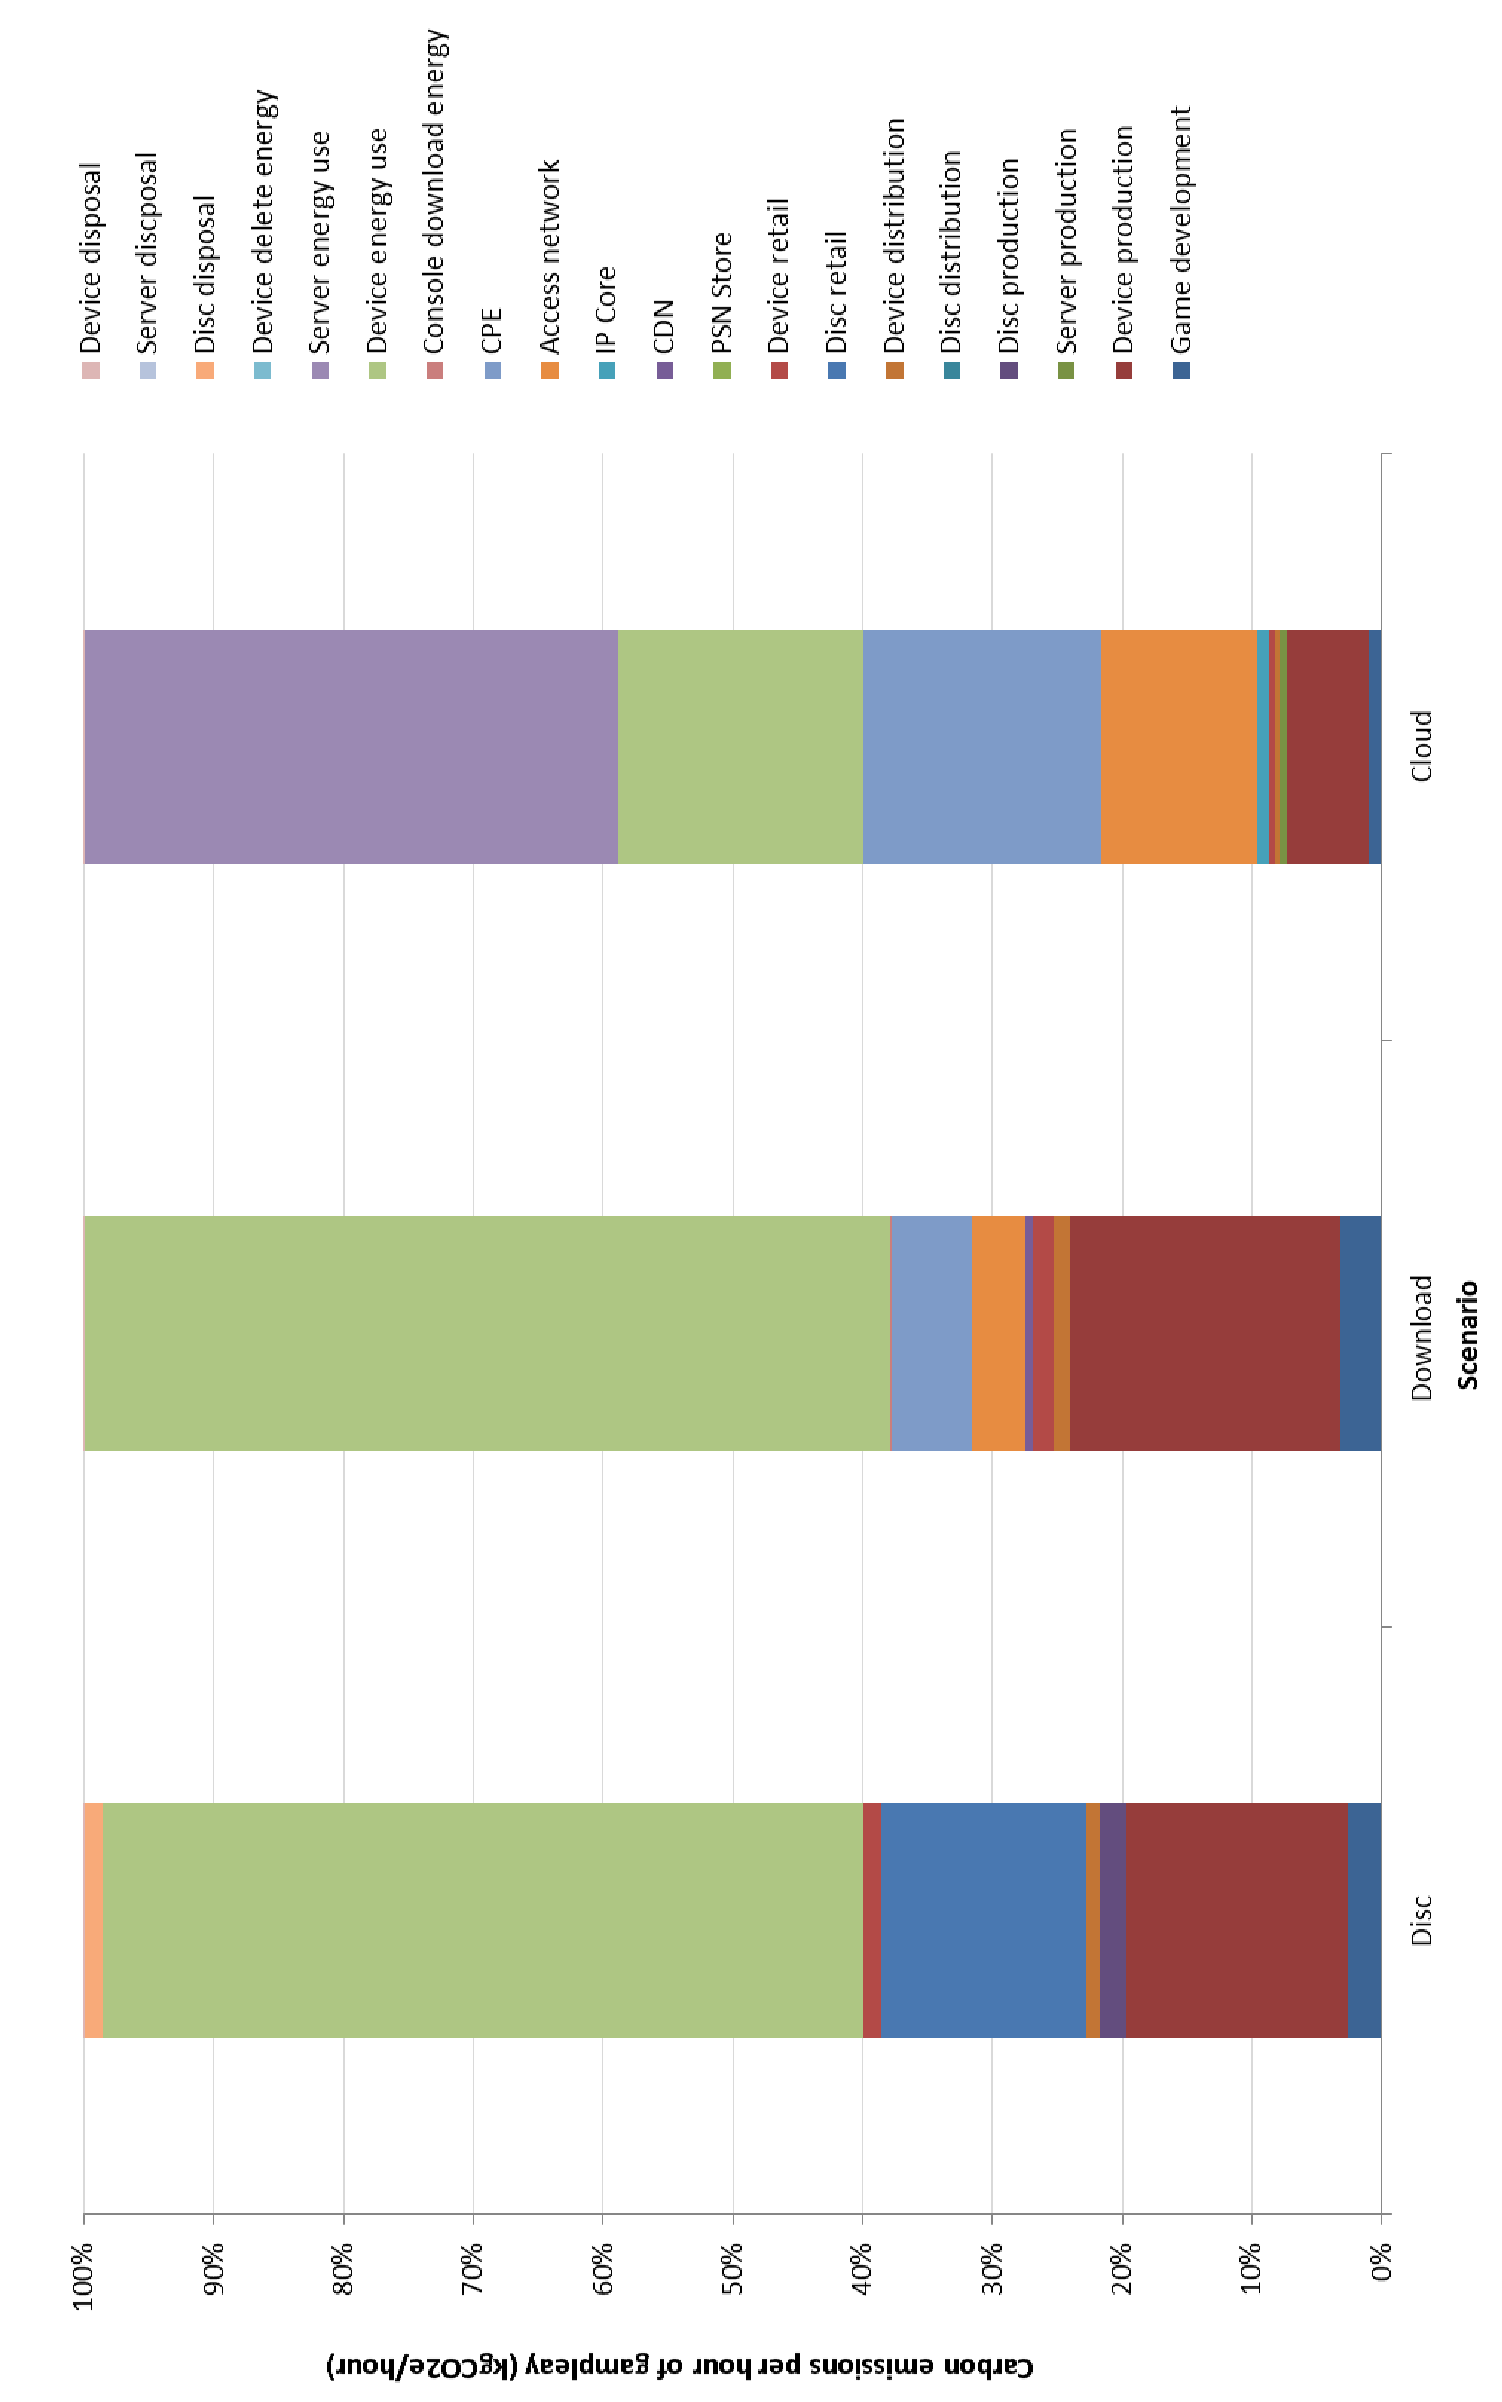
Figure 47: Normalised life cycle carbon emissions from different gaming modes
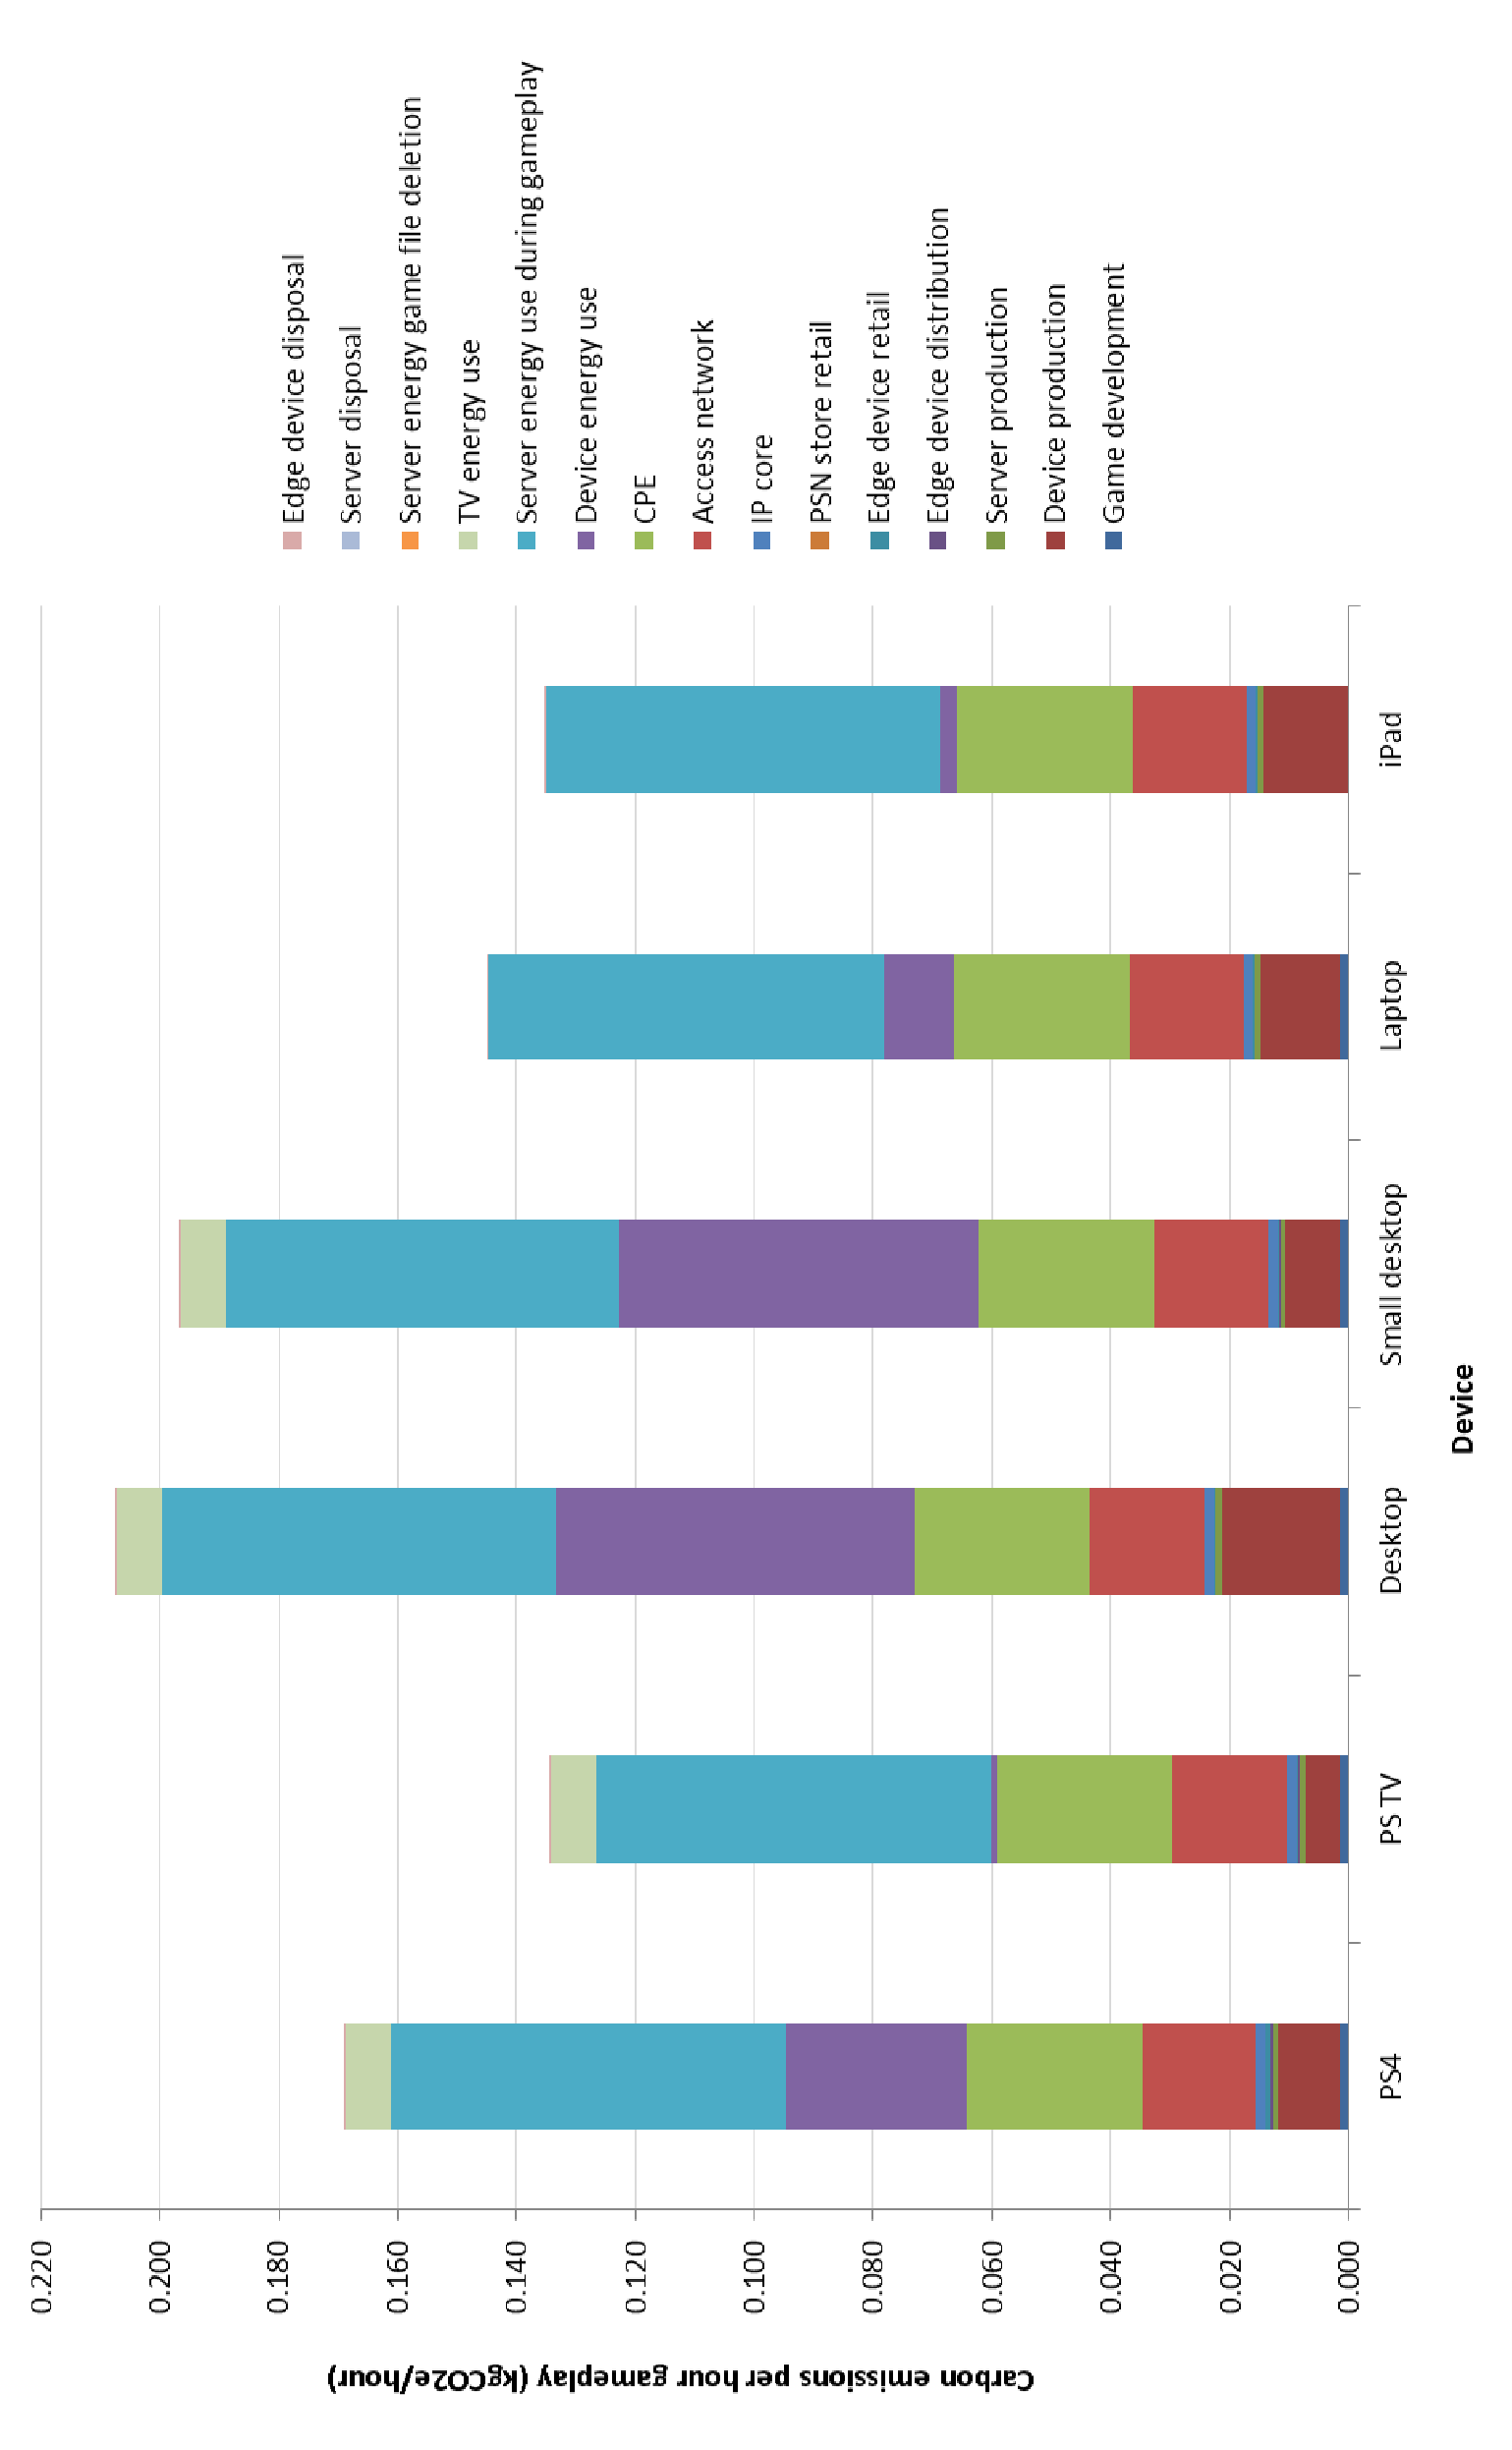
Figure 64: Cloud gaming carbon intensity using different edge devices
the following parameters are used to estimate the carbon emissions of each gaming method in 2019: Internet electricity intensity of 0.014 kWh/GB: Chapter 4 provided a meta-analy- sis of electricity intensity of Internet data transmission and determined that intensity has been reduced by half every two years from 2000 to 2015. Based on recent, published research by Malmodin and Lundén (2018), this trend appears to have continued into 2018. For this scenario it is assumed that the trend will continue at the same rate to 2019, extrapolating the trend by two years. PS4 power consumption remains the same: it is assumed that for 2019, console power consumption will not be reduced further. Monthly household data usage of 302 GB/month: Data usage increased from 82 GB/month in 2015 to 132 GB/month in 2017, extrapolating this growth in data usage gives a projection of 302 GB/month in 2019. Gaming server active capacity at 90% through increased power scaling and power management. Game file size of 50 GB: game file size is likely to continue to grow through to 2019. For this assessment, the assumption is applied that game file sizes will reach 50 GB, as this is the maximum file size capacity on PlayStation BDs.
In terms of understanding the carbon impact of games consoles, it is important to con- sider the wider scope of sectors involved other than console manufacturers (as up to 70% of estimated carbon equivalent emissions derive from Internet related technolo- gies). For download and cloud gaming, approximately 15% and 30% respectively of carbon emissions derive from the data transmission network and CPE. In addition to this, for cloud gaming, up to 40% of carbon emissions arise from gaming servers (in 2017). This appears true for other product-service systems, such as movie streaming, for example, where approximately 50% of emissions come from data transmission (alt- hough <1% arise from data centre operations) (Shehabi, et al., 2014).
On the other hand, gaming appears to have relatively low hourly carbon emissions when compared to other leisure activities. A study by Druckman et al. (2012) evaluated the carbon emissions of the different ways people spend their time during the day, in- cluding sleeping, eating, shopping, leisure activities etc. Comparing the results of this study to the estimates in Druckman et al. (2012), gaming (by all three methods) has one of the lowest carbon intensities (carbon emissions per hour) of the activities examined (although the system boundaries for activities in the home includes factors such as lighting and heating). Figure 73 shows the results from the Druckman et al (2012) study. Particularly interesting is that outdoor leisure activities, which require the use of no technology, such as playing sports with friends, have higher carbon emissions per hour compared to gaming. In addition, the transport emissions associated with all the activi- ties outside of the home considered in the study (travelling to sports field, cinema, theatre etc.), are higher than hourly gaming emissions.
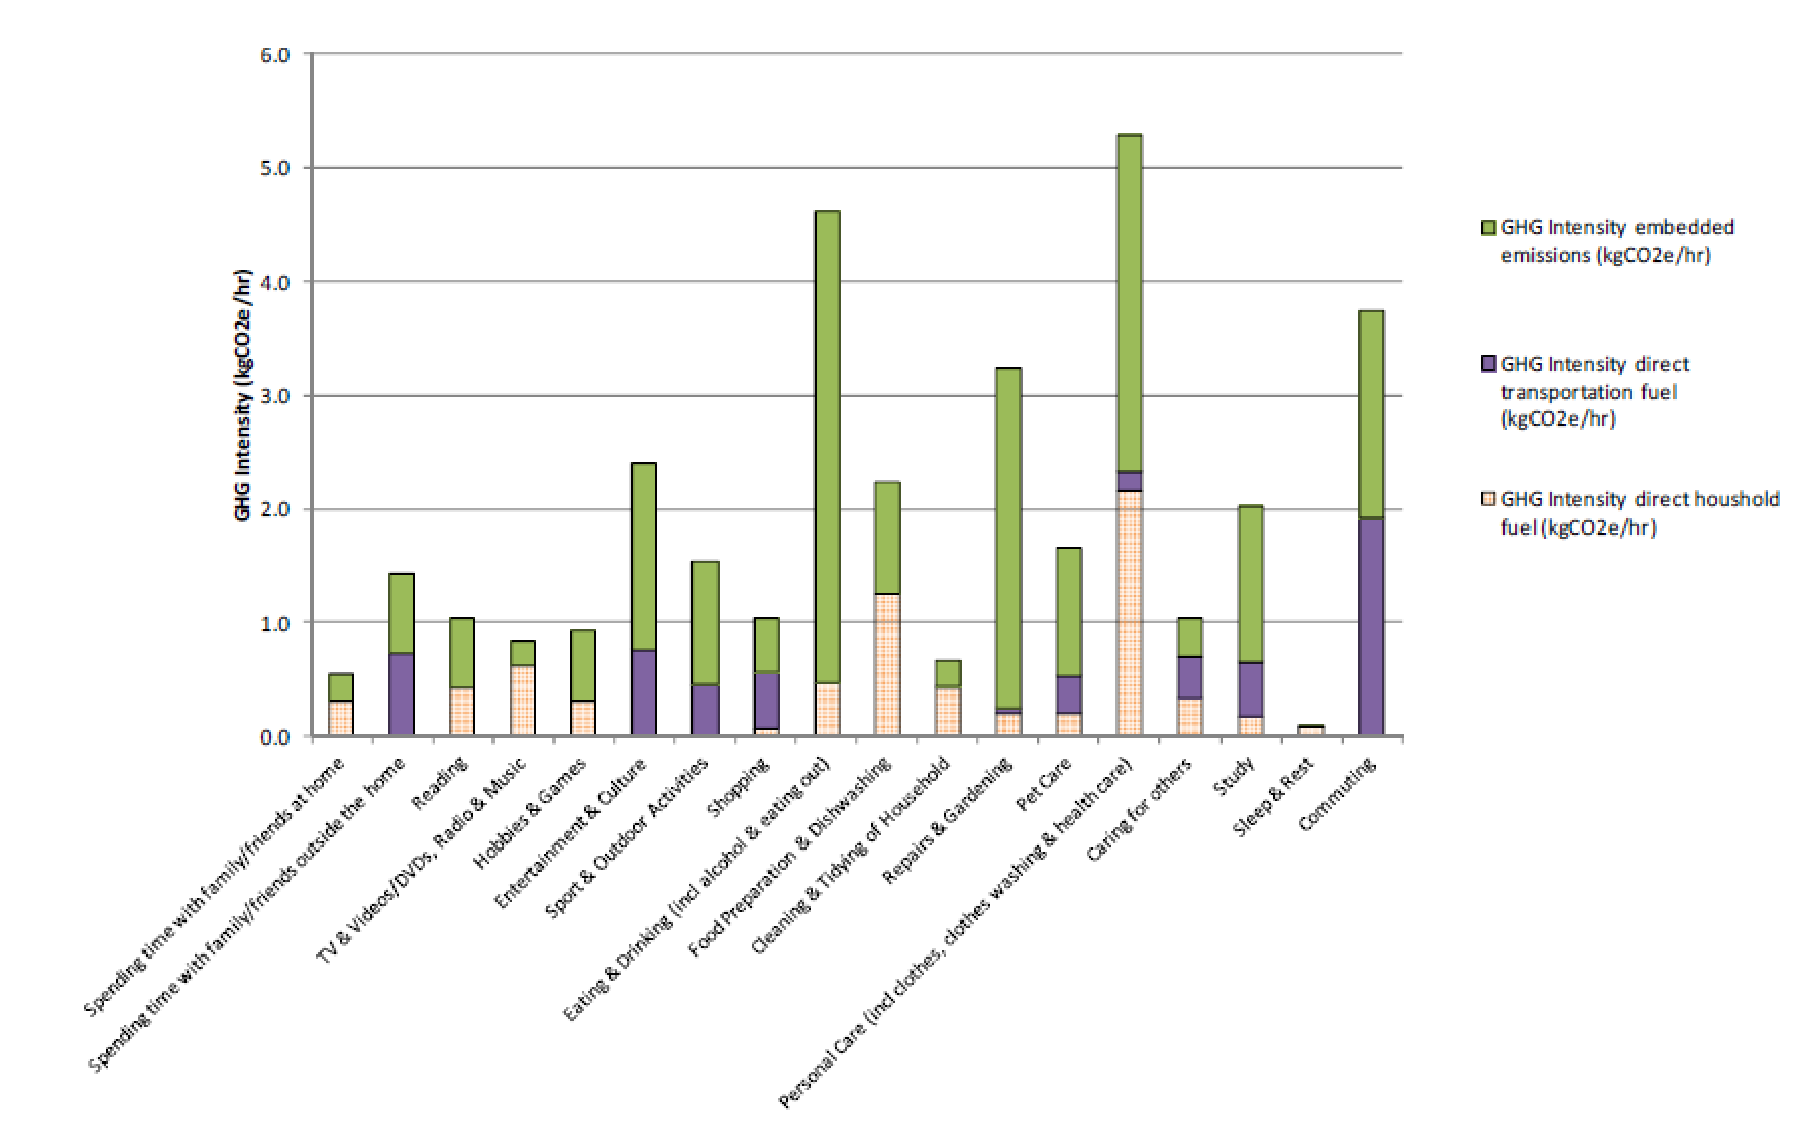
Figure 73: Carbon equivalent emissions per hour different activities (Druckman et al., 2012)
Repairing an older model PlayStation 4 to extend its lifetime could foreseeably have a higher carbon impact than replacing it with a newer, lower power consuming model. Games consoles are quite unique in that their performance over the approximately five year lifetime (between generations) is kept constant, which results in their power consumption being reduced as technology is improved. Therefore, this example may not be true for other devices, nevertheless, research is required in order to determine the thresholds in which the implementation of resource efficiency requirements have lowest carbon impact, as well as for other environmental impact indicators. There is a danger that circular economy policies could have negative environmental impact if they are not based on systems level analysis of product/service life cycles.