Environmental footprint of the digital world
Status:: 🟩
Links:: Global energy consumption & carbon emissions of the whole ICT sector
Metadata
Authors:: Aubet, Louise; Chery, Sylvain; Derreumaux, Auban; de Montenay, Lorraine; Pasian, Brice; Rabot, Anne
Title:: Environmental footprint of the digital world
Date:: 2025
URL:: https://greenit.eco/nos-etudes-et-essais/impacts-environnementaux-du-numerique-dans-le-monde-2025/
DOI::
Aubet, L. et al. (2025) Environmental footprint of the digital world. 3. Green IT Association. Available at: https://greenit.eco/nos-etudes-et-essais/impacts-environnementaux-du-numerique-dans-le-monde-2025/ (Accessed: 19 June 2025).
Notes & Annotations
Color-coded highlighting system used for annotations
📑 Annotations (imported on 2025-06-21#16:00:10)
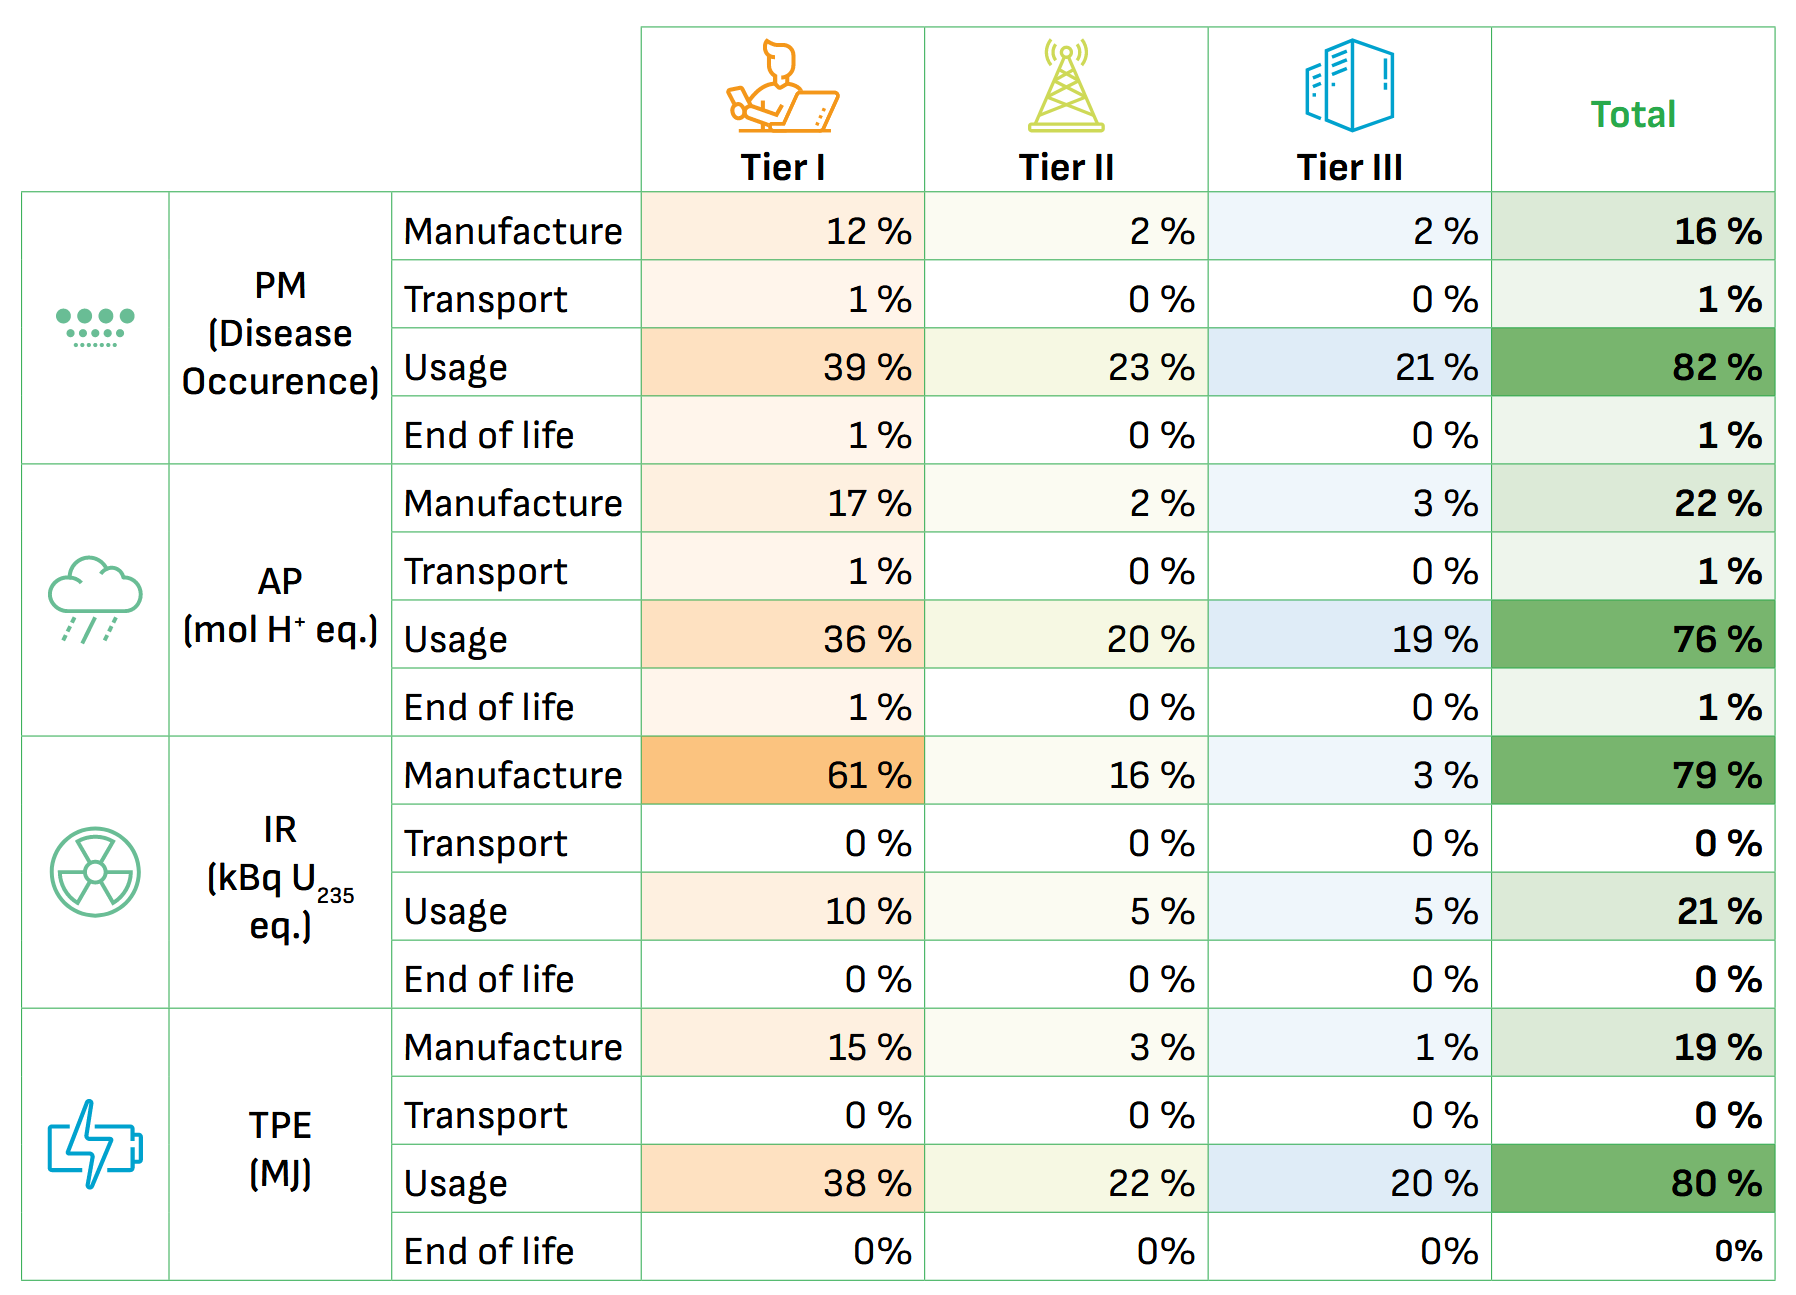
At the global level, unlike the European and French scales, the use phase has proportionally more impact than the manufacturing phase, except for the contribution to the depletion of mineral and metal resources and ionizing radiation emissions, indicators for which the manufacturing phase remains predominant.
This study also highlights the relationship between the impacts of digital technology and the sustainable budget to remain below the critical threshold of planetary boundaries. Thus, digital technology consumes 40% of an Internet user’s sustainable annual budget, a sustainable budget to stay below 1.5°C of global warming in accordance with the Paris Agreement.
Faced with these observations, our recommendations concerning the reduction of environmental impacts focus on digital sufficiency and the mechanisms to implement it, both on the reduction of impacts related to manufacturing and related to the use of digital equipment and services: reassessing and limiting our uses, producing less equipment, and making them last longer.
In 2023, there were about 30.5 billion devices used for 5.35 billion Internet users, or nearly 6 devices per Internet user.
In 2023, all activities combined, there were approximately 79.5 million servers accompanied by more than 8.2 million network equipment dedicated to data centres. The electricity consumption of these centres is estimated at 506 TWh per year, which is about as much as the consumption of a country like Germany. Of these 506 TWh, nearly 190 TWh, or about 37%, are devoted to so-called “non-IT” equipment (batteries, inverters, thermal management systems here called “air conditioning”, etc.).
Digital-related greenhouse gas (GHG) emissions are 1.8 billion tonnes of CO2 eq. Thus, on the indicator concerning the potential for global warming, global digital technology is equivalent to about 3 times the emissions of South Korea, more than 2 times those of Canada or Saudi Arabia, or about 5.5 times those of France.
In 2023, global digital technology accounts for 3.4% of global GHG emissions. Between 2019 and 2023, global GHG emissions across all sectors increased by more than 1.9%.
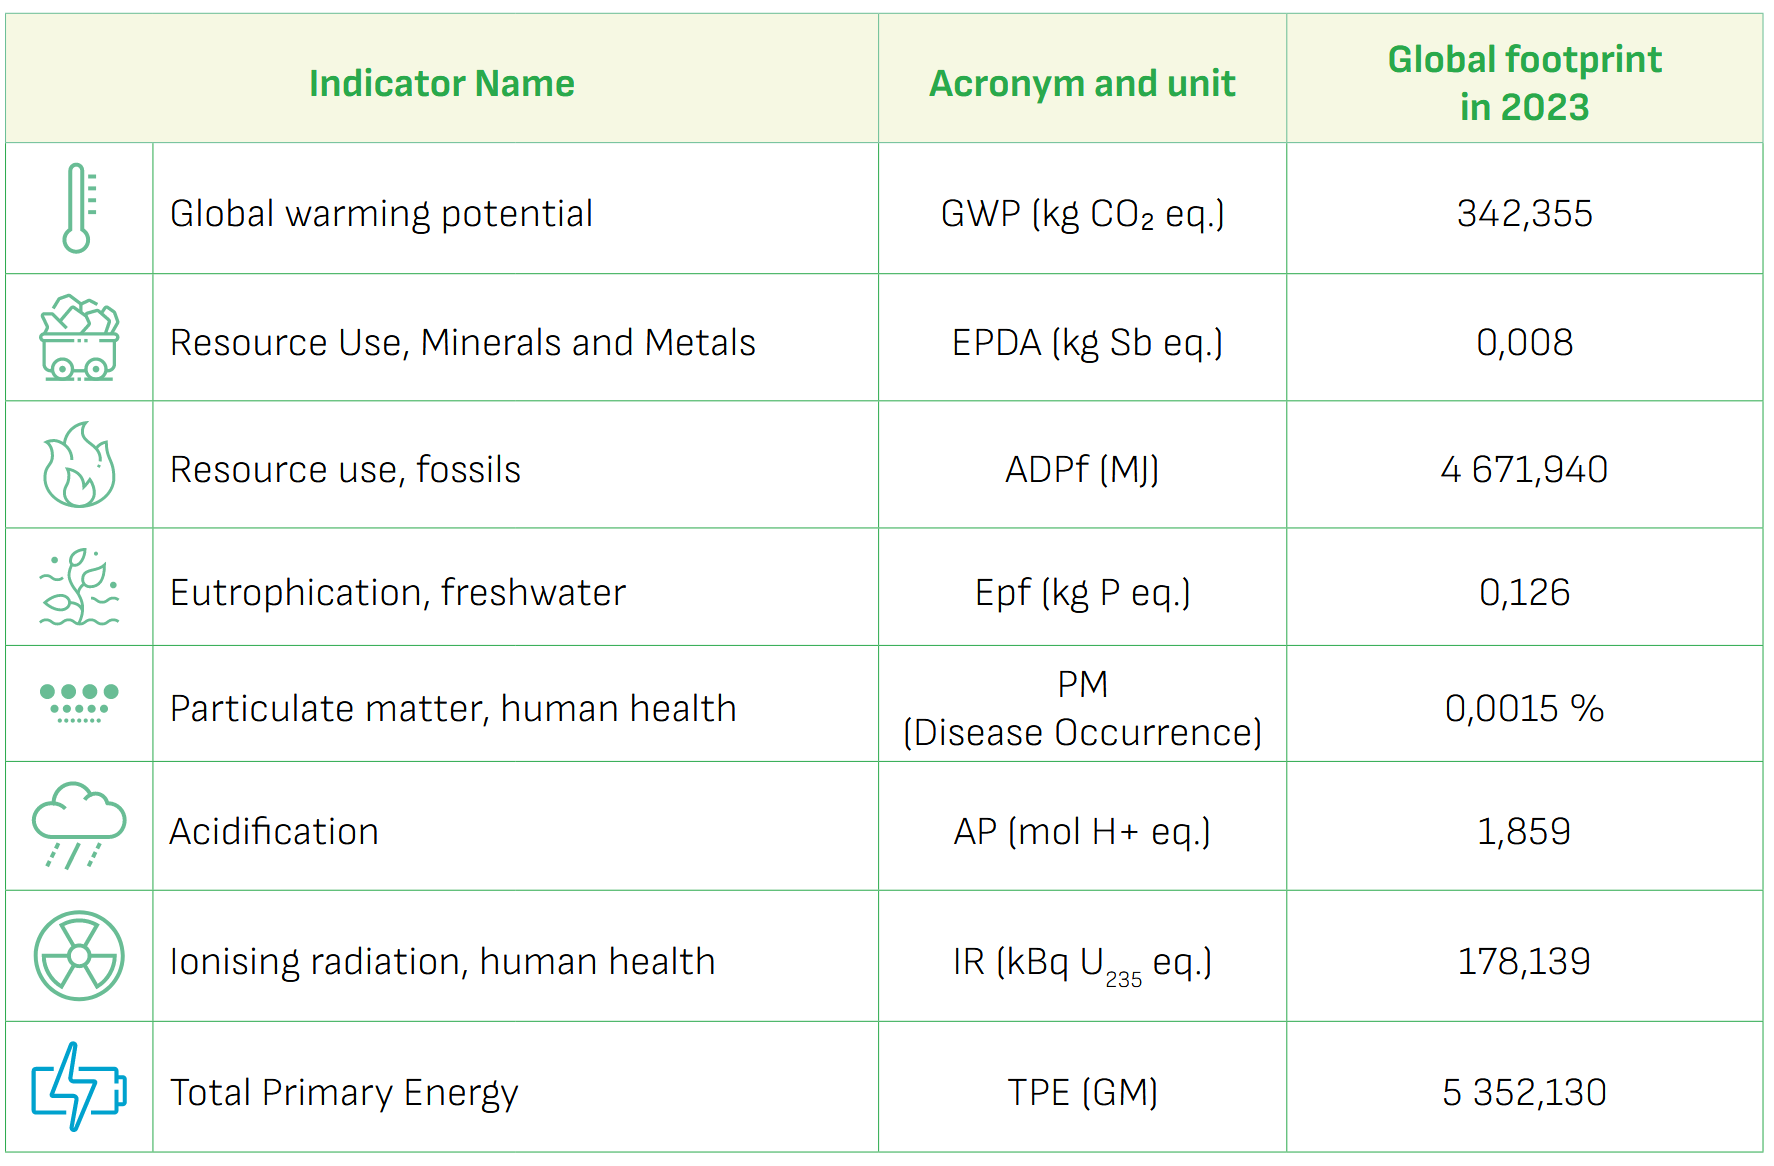
Table 4: Digital footprint per Internet user in 2023 on the environmental indicators selected
In 2023, the world’s digital sector alone consumes 27% of the annual planetary sustainable budget to stay below 1.5°C of global warming.
in 2023, the annual use of global digital technology consumes 40% of the annual sustainable GHG budget per Internet user to stay below 1.5°C of global warming.
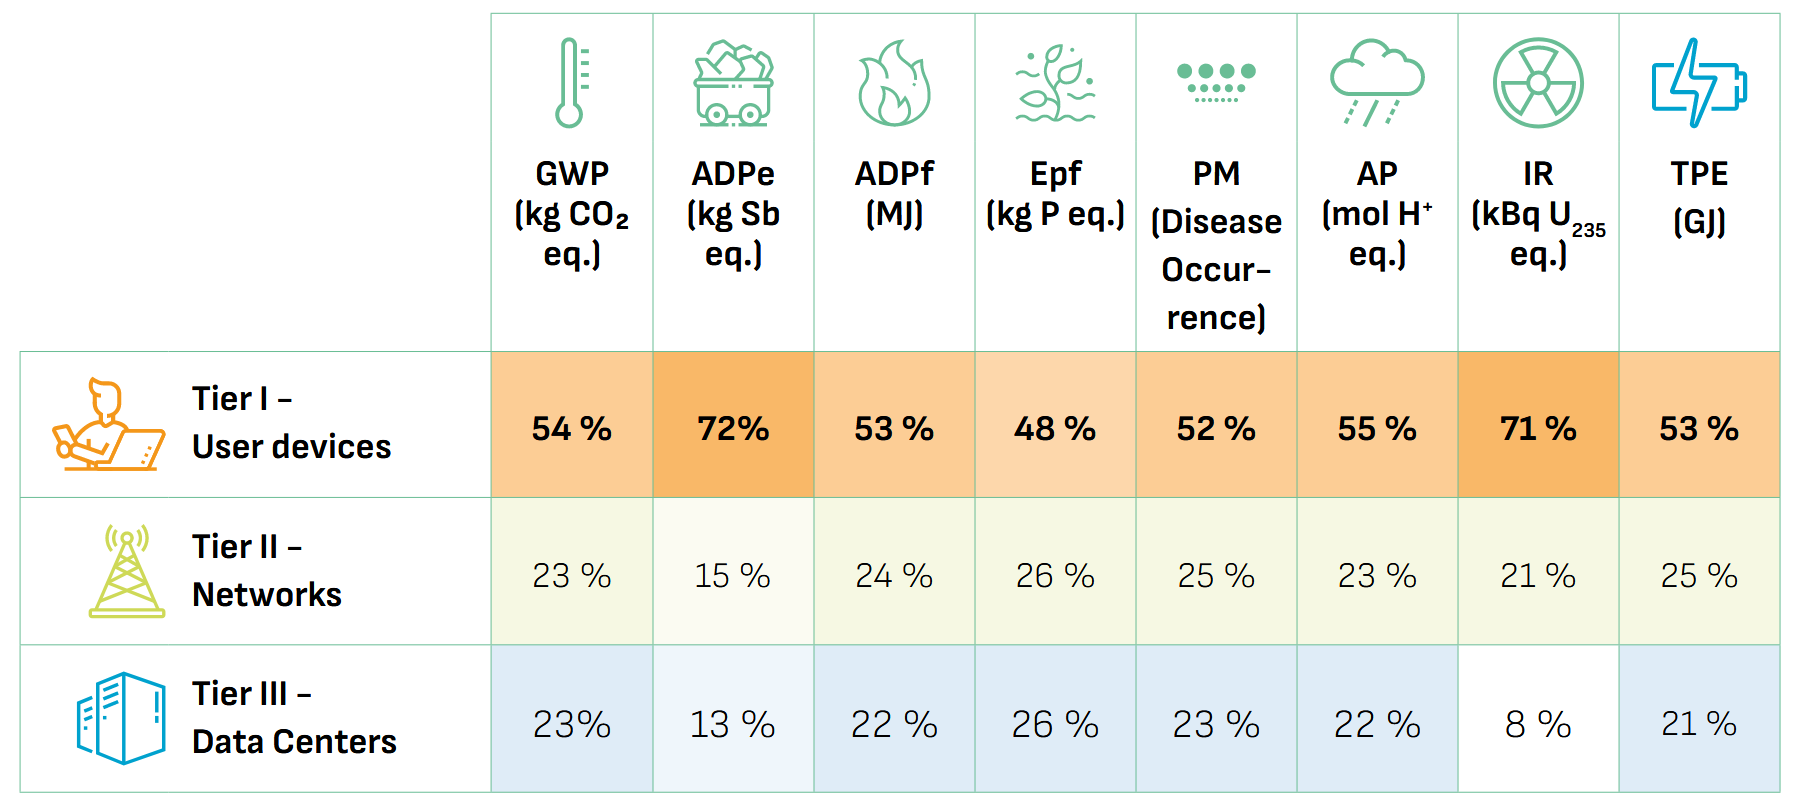
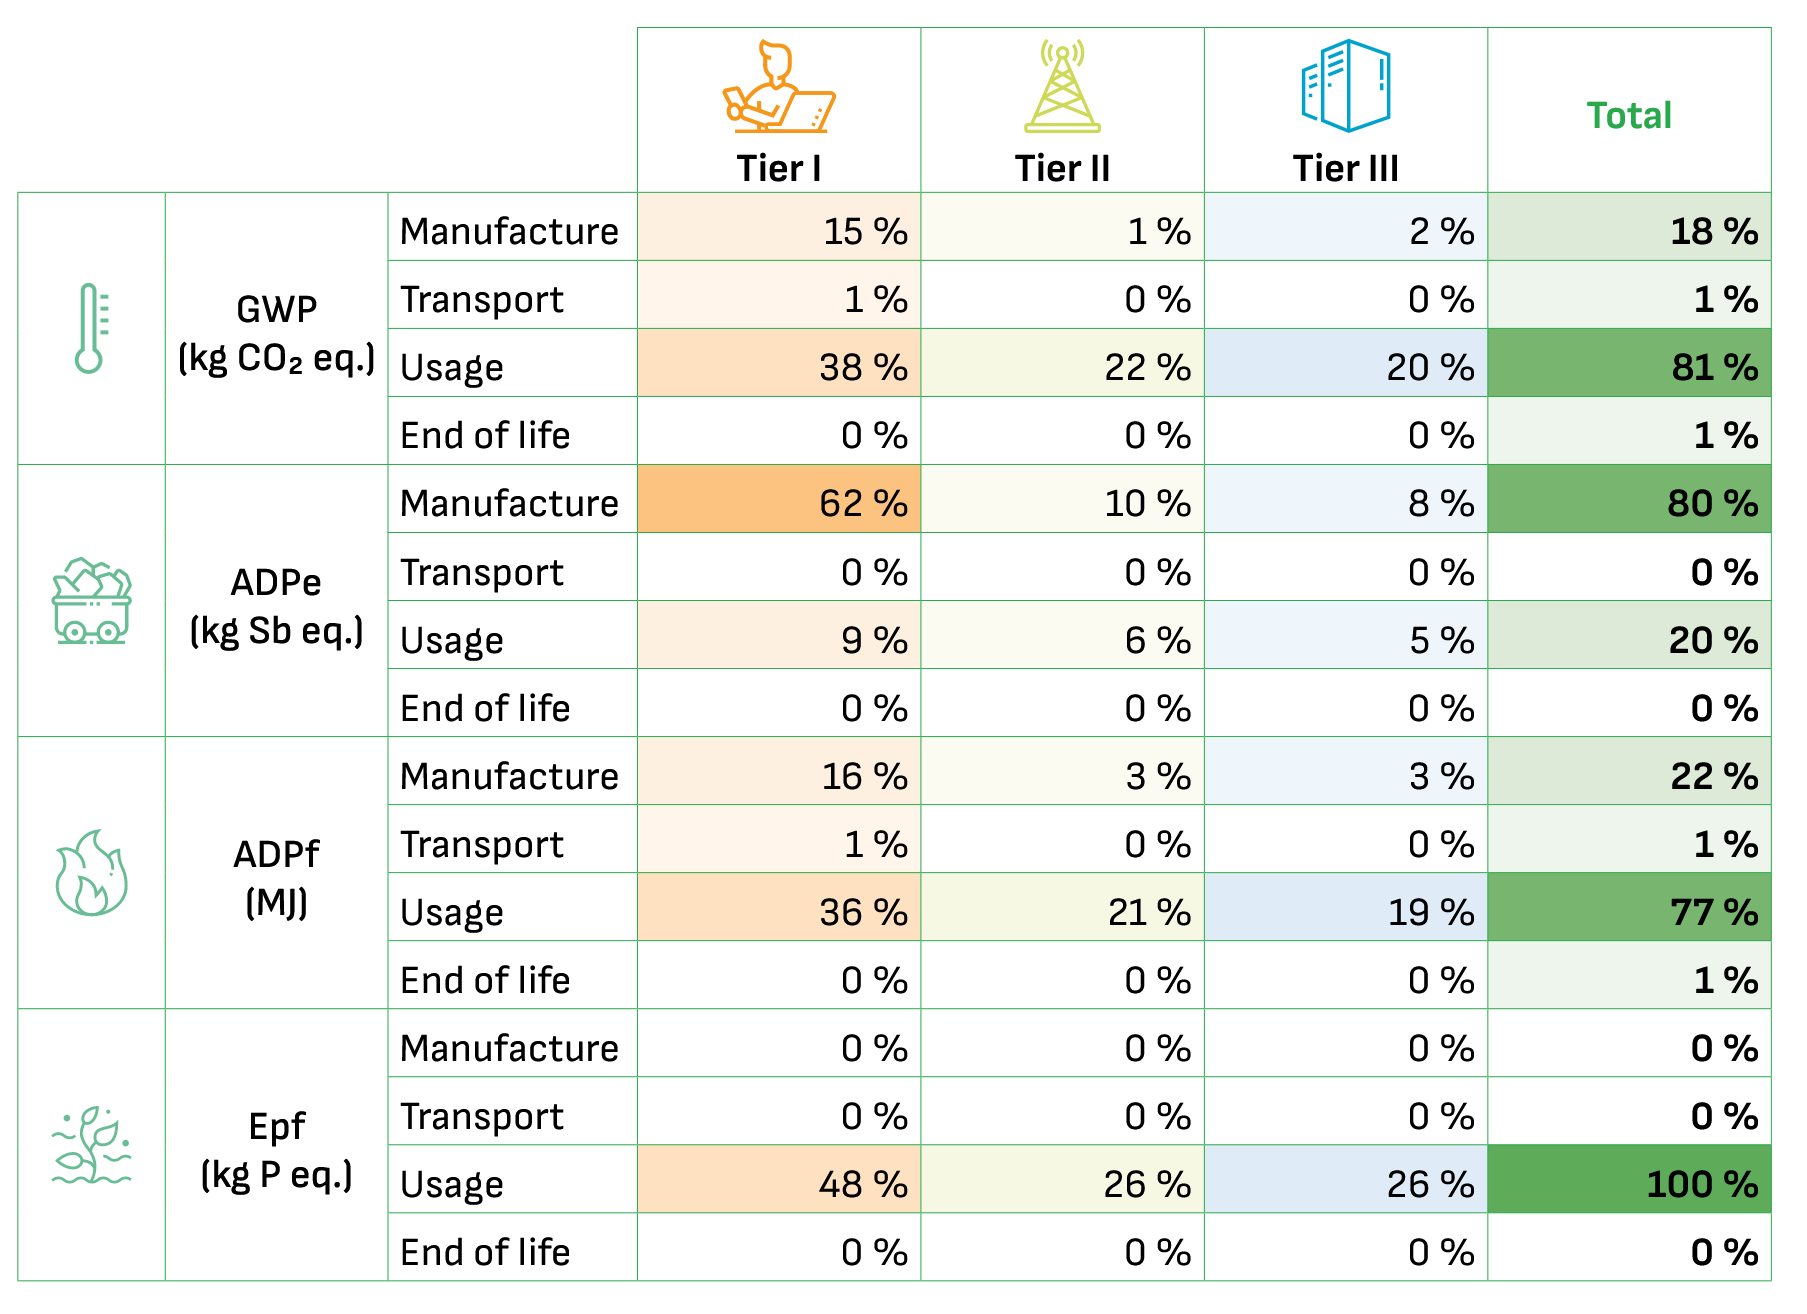
Table 7: Distribution of the environmental impacts of digital technology for each of the 3 Tiers
User devices is the main source of digital impacts worldwide, between 48 and 72% depending on the indicators. Networks account for between 15 and 26% of impacts, while data centers account for between 8 and 26% of impacts.
the environmental impacts of a television set increase in proportion to its size (screen area), during both the manufacturing and the use phases. The impact on use is multiplied by nearly 4 when the diagonal doubles
Smartphones are the third category of user devices with the biggest environmental impacts of digital technology. They account for 11% of the use of digital mineral and metal resources, an indicator on which they have proportionally the most impact compared to other types of equipment. Regarding the potential for global warming, the quantity of smartphones makes them exceed the impacts of laptops (5% compared to 3% for laptops).
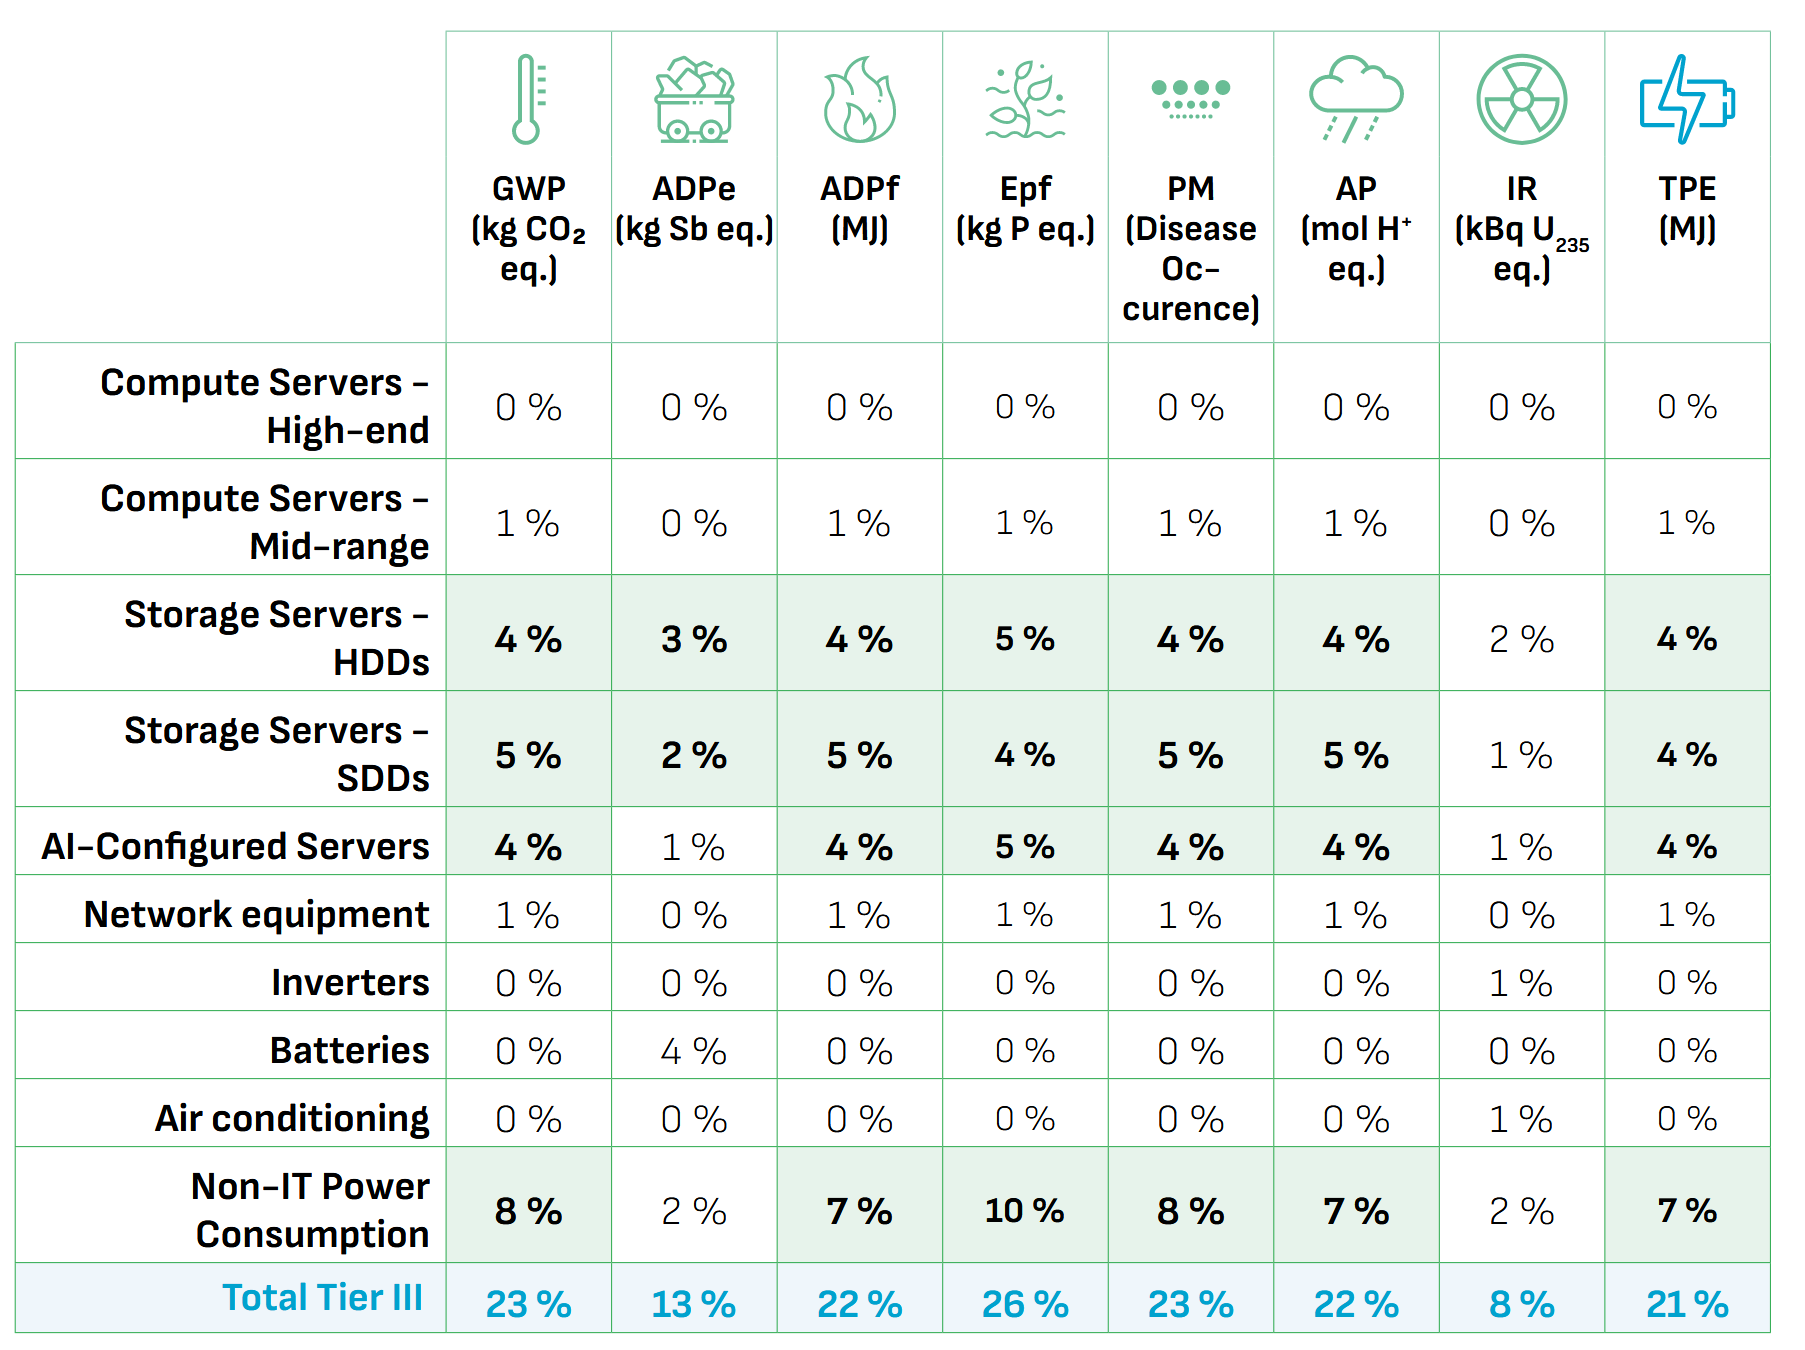
In 2023, Data centers are responsible for 13 to 26% of the environmental and health impacts of digital technology worldwide, depending on the indicators.
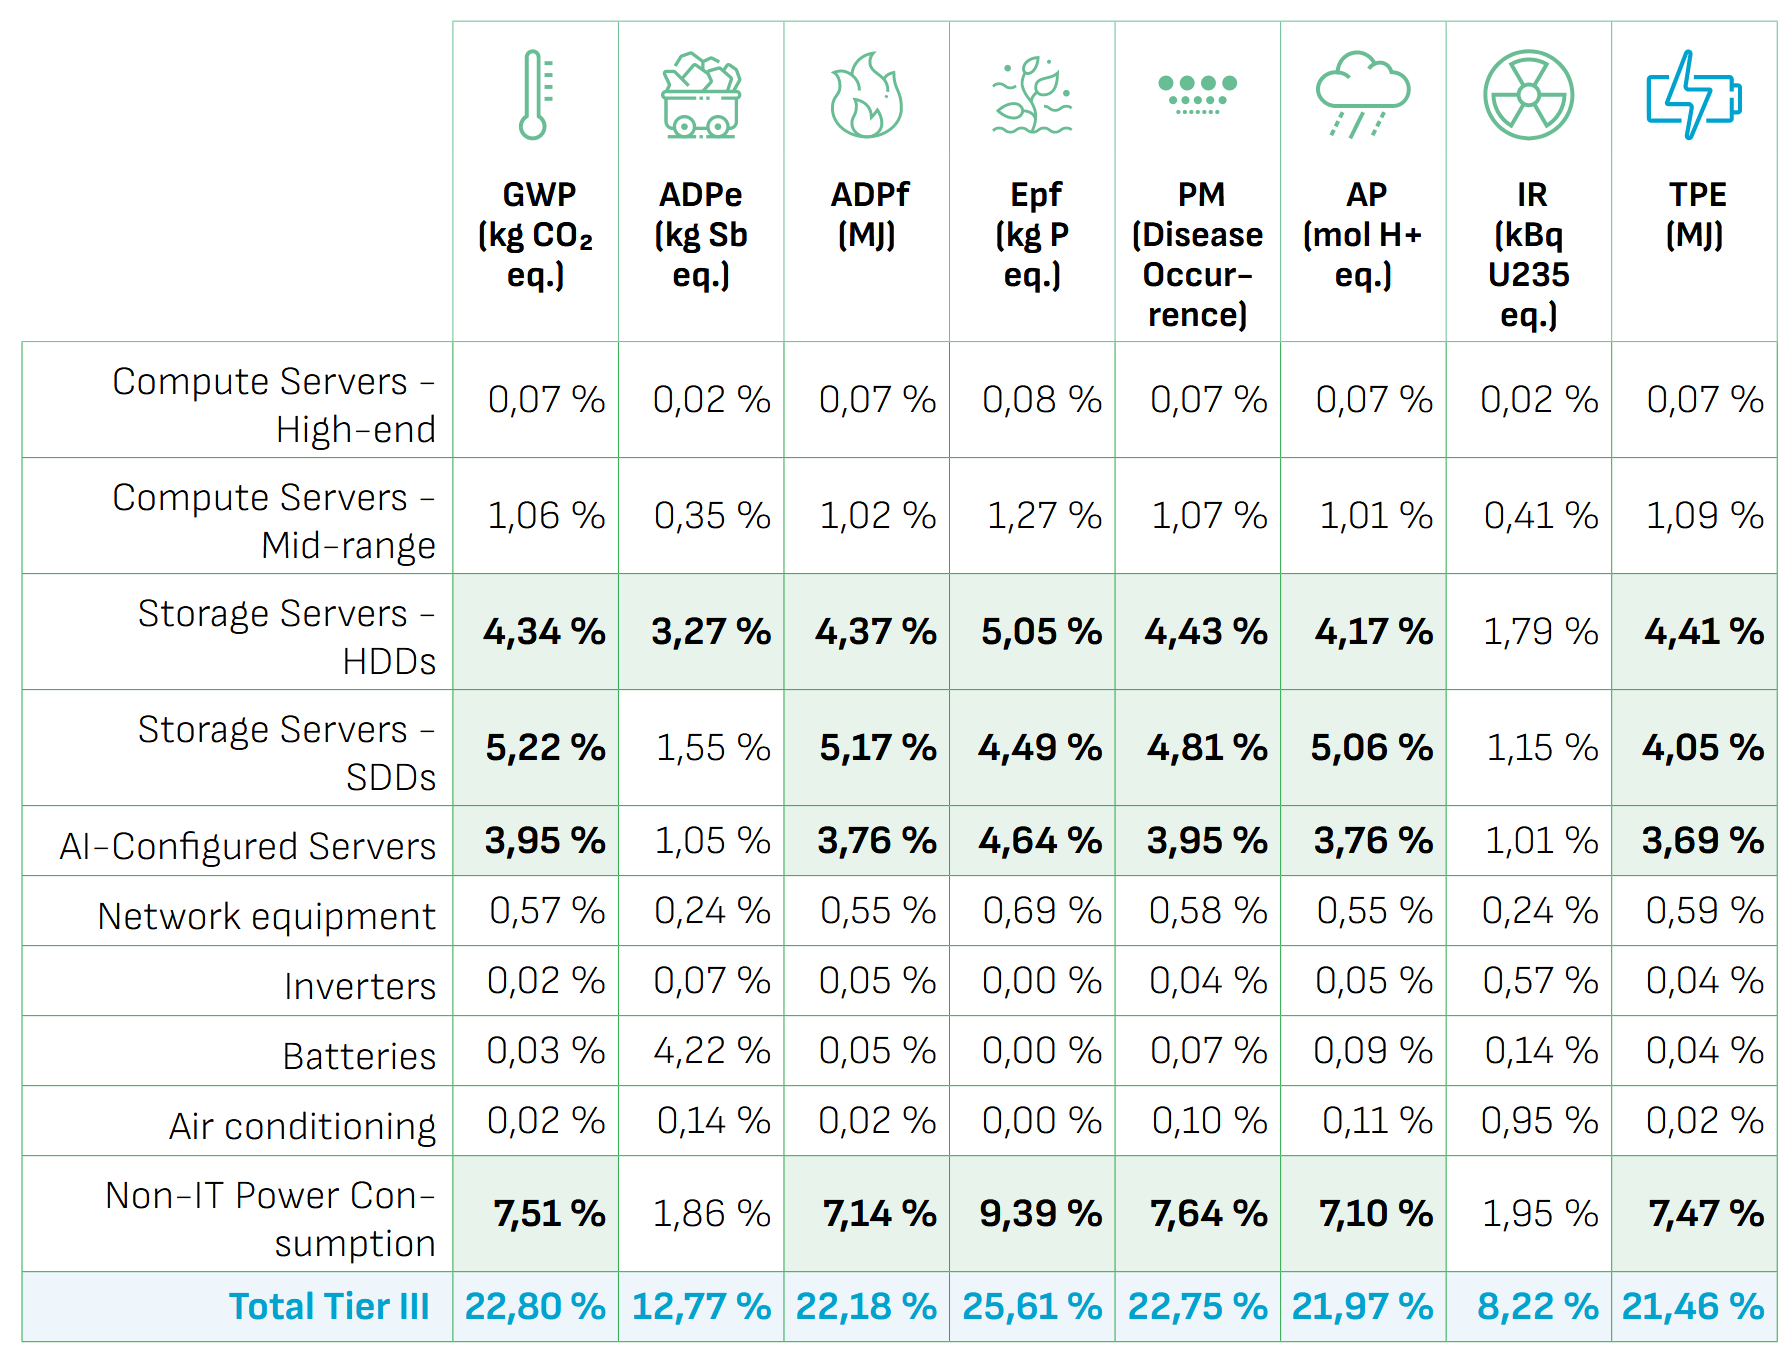
Table 9: Distribution of the environmental impacts of data centres (Tier III) in relation to the total digital impacts
In 2023, servers dedicated to Artificial Intelligence (AI) already account for 1 to 5% of the environmental impacts of data centers dependingding on the indicators, despite their small number in proportion to other servers37. AI-configured servers already emit nearly 4% of digital GHG emissions, which is already more than all laptops combined.
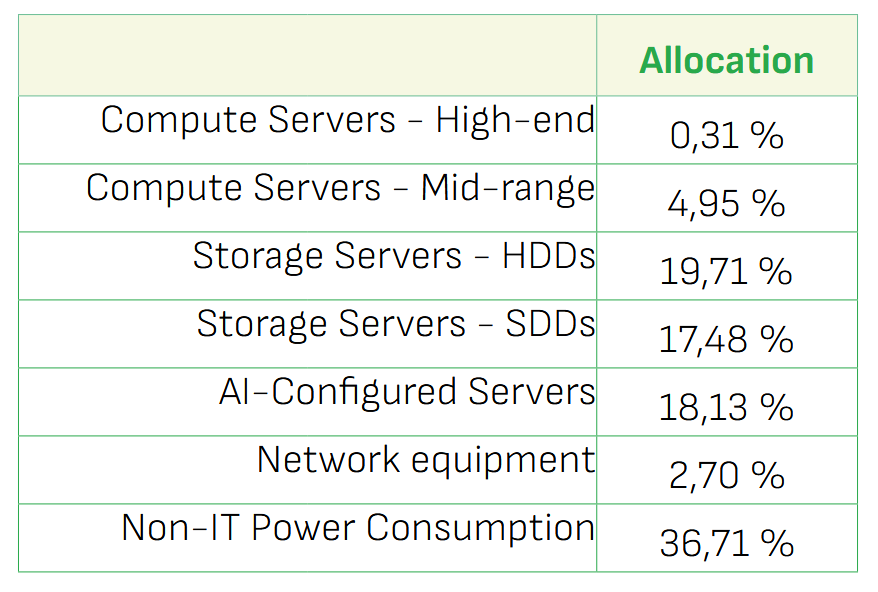
Table 10: Tier III electricity consumption allocation
Migration to the cloud, the rise of generative AI, and cryptocurrencies are the 3 main vectors of the ongoing reconfiguration of the impacts of data centers. All three are leading to a significant increase in demand, with strong growth in the number of data center projects around the world, with the United States leading the way.
In this study, we were able to see that digital technology already consumes more than 40% of the GHG budget per Internet user to stay below 1.5°C of global warming. If digital technology were to take a place proportional to its contribution to GHG emissions (3.4%) while respecting the sustainable budget to stay within planetary limits, then digital emissions would have to be reduced by a factor of 12.
To reduce the environmental and health impacts of digital technology, it is necessary to act as a priority on the equipment and life cycle phases that concentrate the most impacts, therefore
- a. At Tier I level - User equipment:
- i. Reduce the number and size of monitors and TVs
- ii. Reduce the number of connected objects
- iii. Reduce the number of smartphoness
- iv. Make all these devices last longer
- v. Reduce the time spent using monitors, TVs, smartphones and projectors
- vi. Improve the energy efficiency of new devices
- b. At Tier II - Networks:
- i. Size networks as accurately as possible and limiting the deployment of new infrastructures
- ii. Favoure the use of existing fixed networks
- iii. Reduce the amount of data transferred over mobile networks
- iv. Improve the energy efficiency of new network equipment
- c. At Tier III - Data Centers:
- i. Size data centers as accurately as possible and limit the deployment of new infrastructures, and therefore associated digital services,
- ii. Less strain on data centers (calculations and storage)
- iii. Slow down the spread of new uses (AI in particular)
- iv. Improve the energy efficiency of new equipment
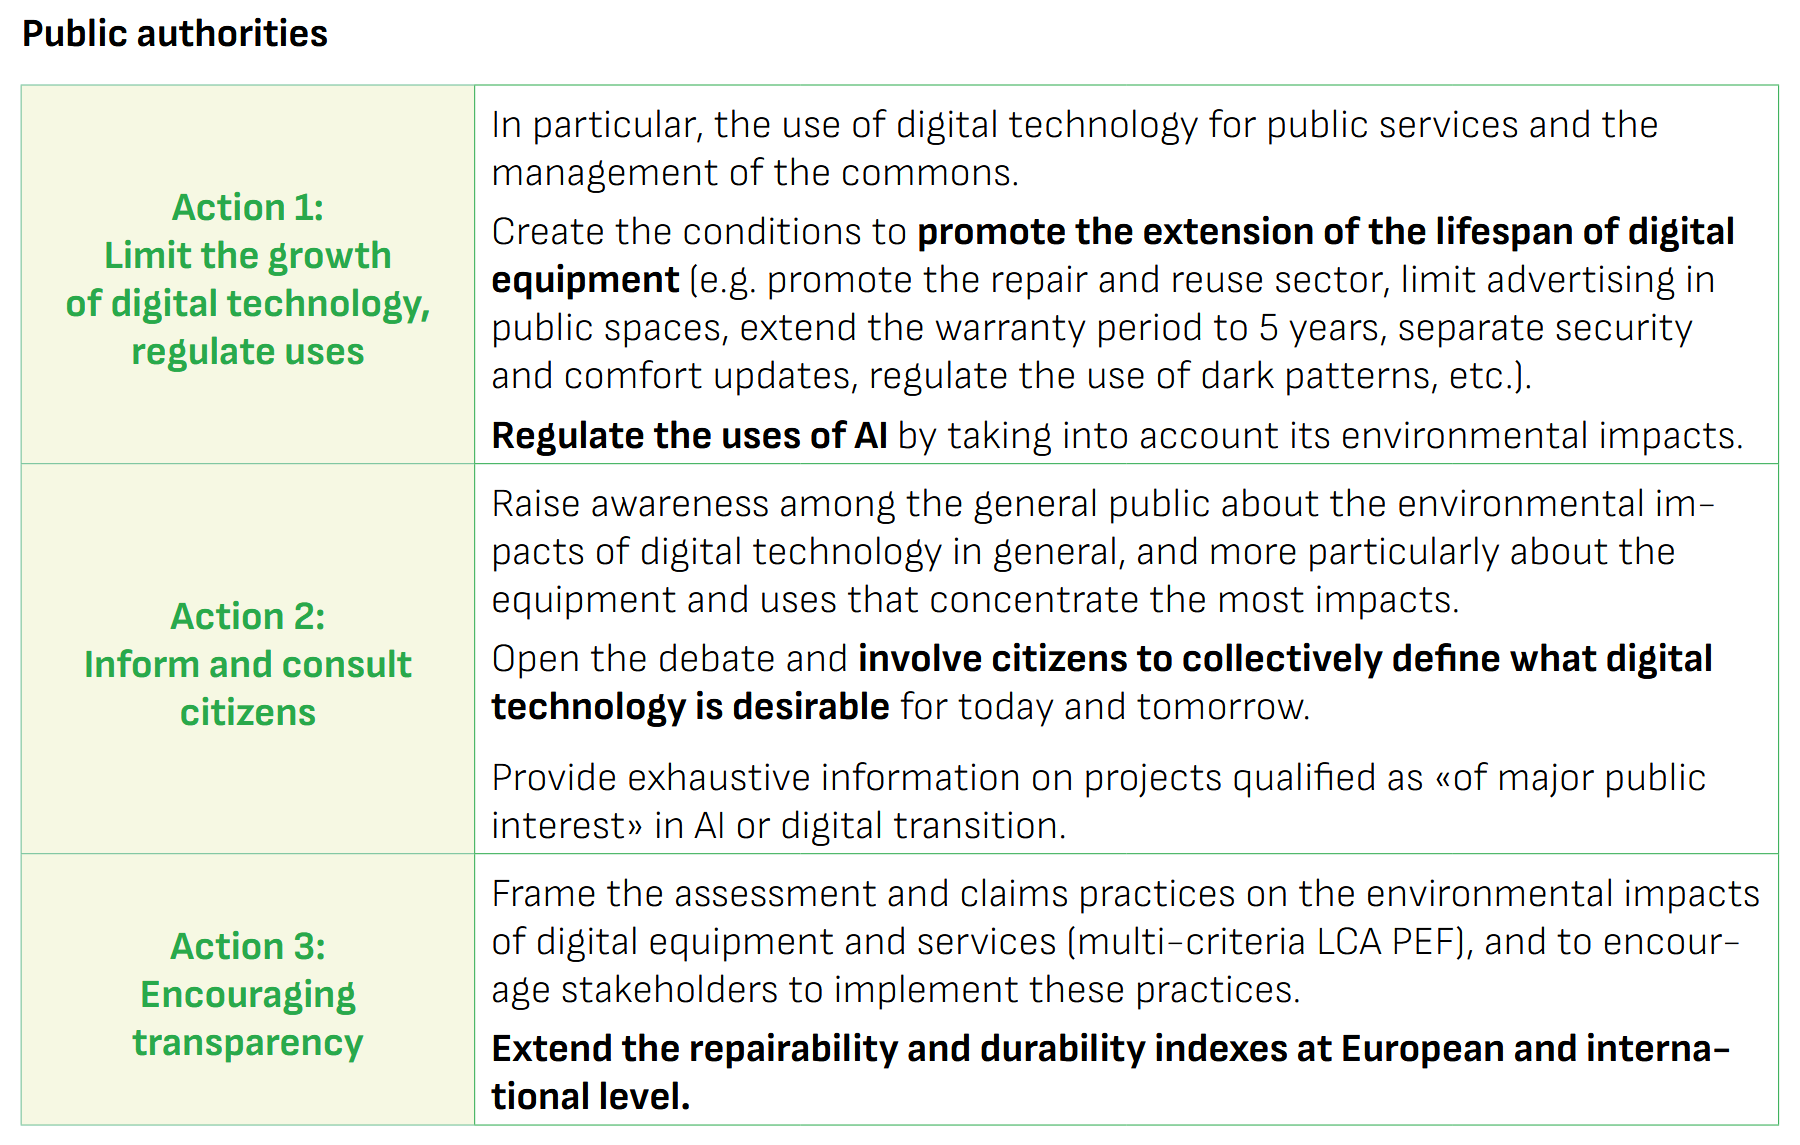
Recommendations for action by the public authorities to reduce the impacts of digital technology
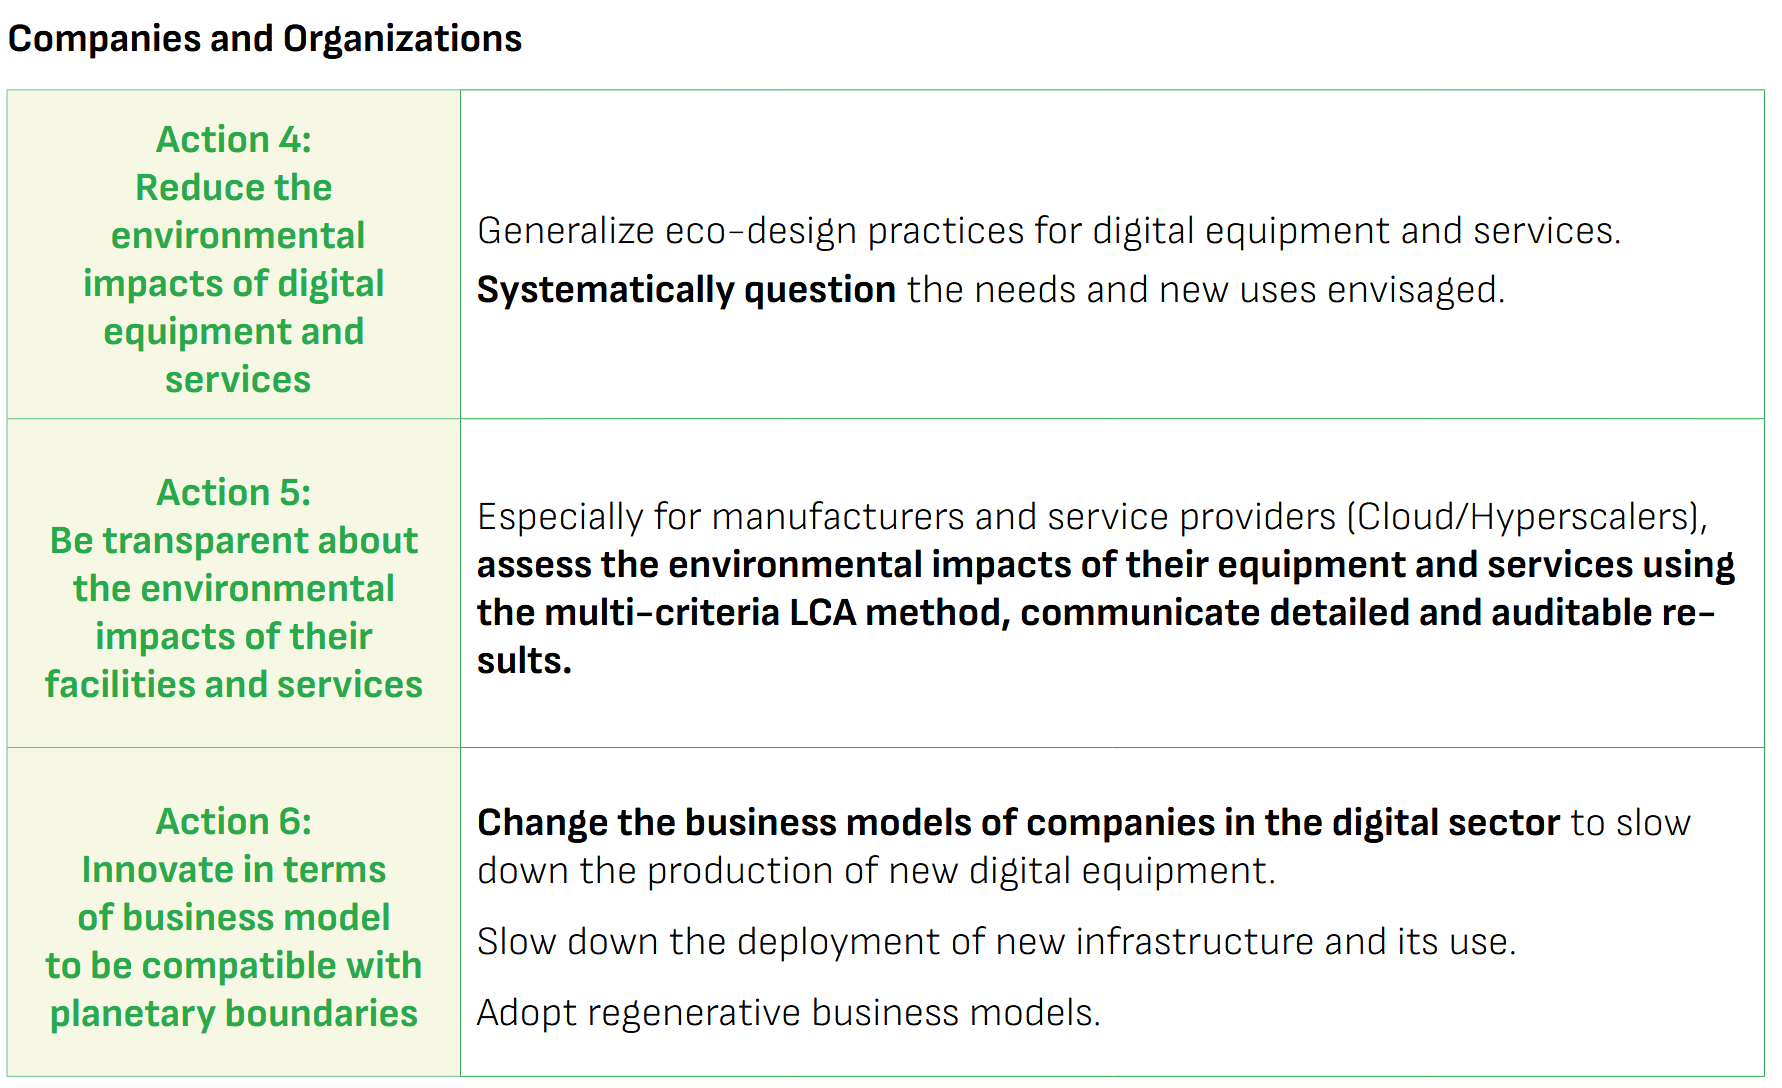
Recommendations for action by companies and organizations to reduce the impacts of digital technology
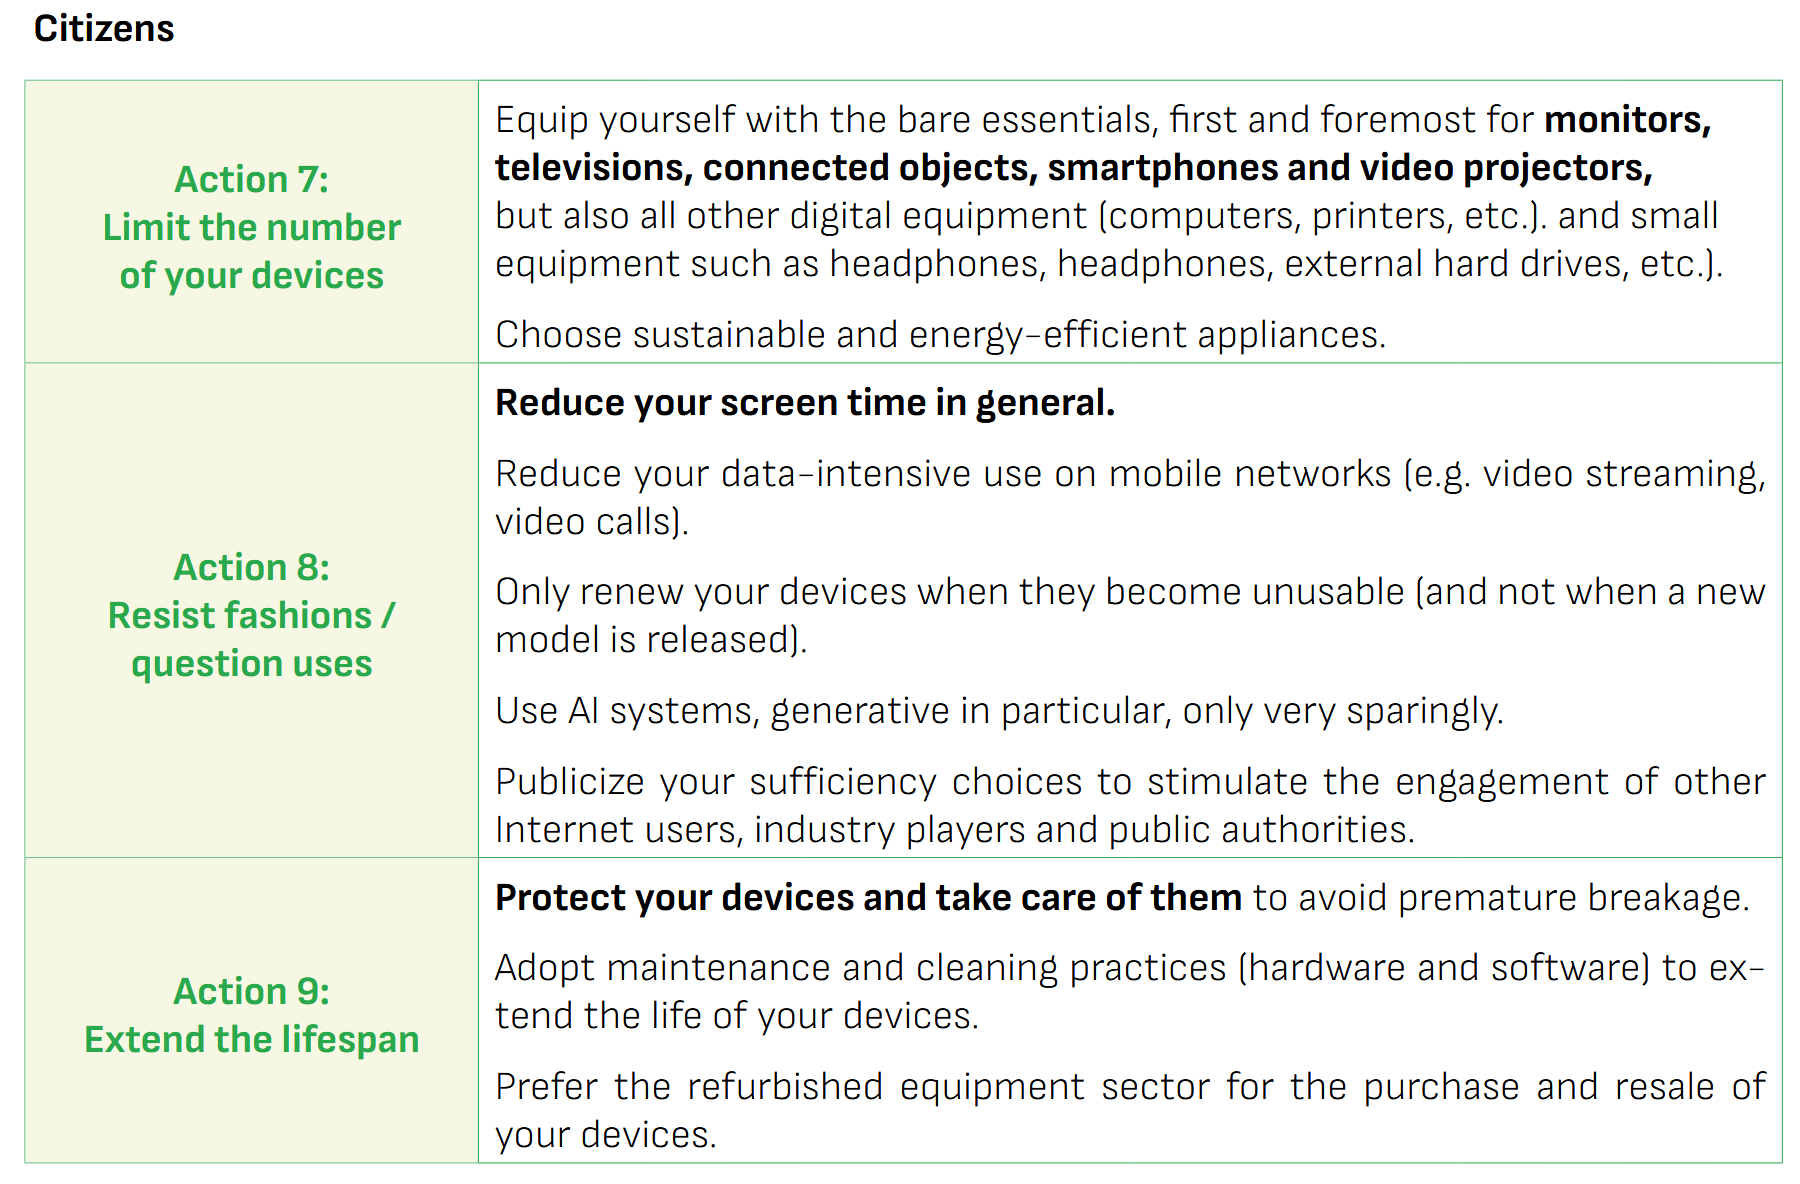
Proposals for good practices by individuals to reduce the impacts of digital technology
Distribution of the environmental impacts of digital technology by Tier and by stage of the life cycle (1)
Distribution of the environmental impacts of digital technology by Tier and by stage of the life cycle (2)
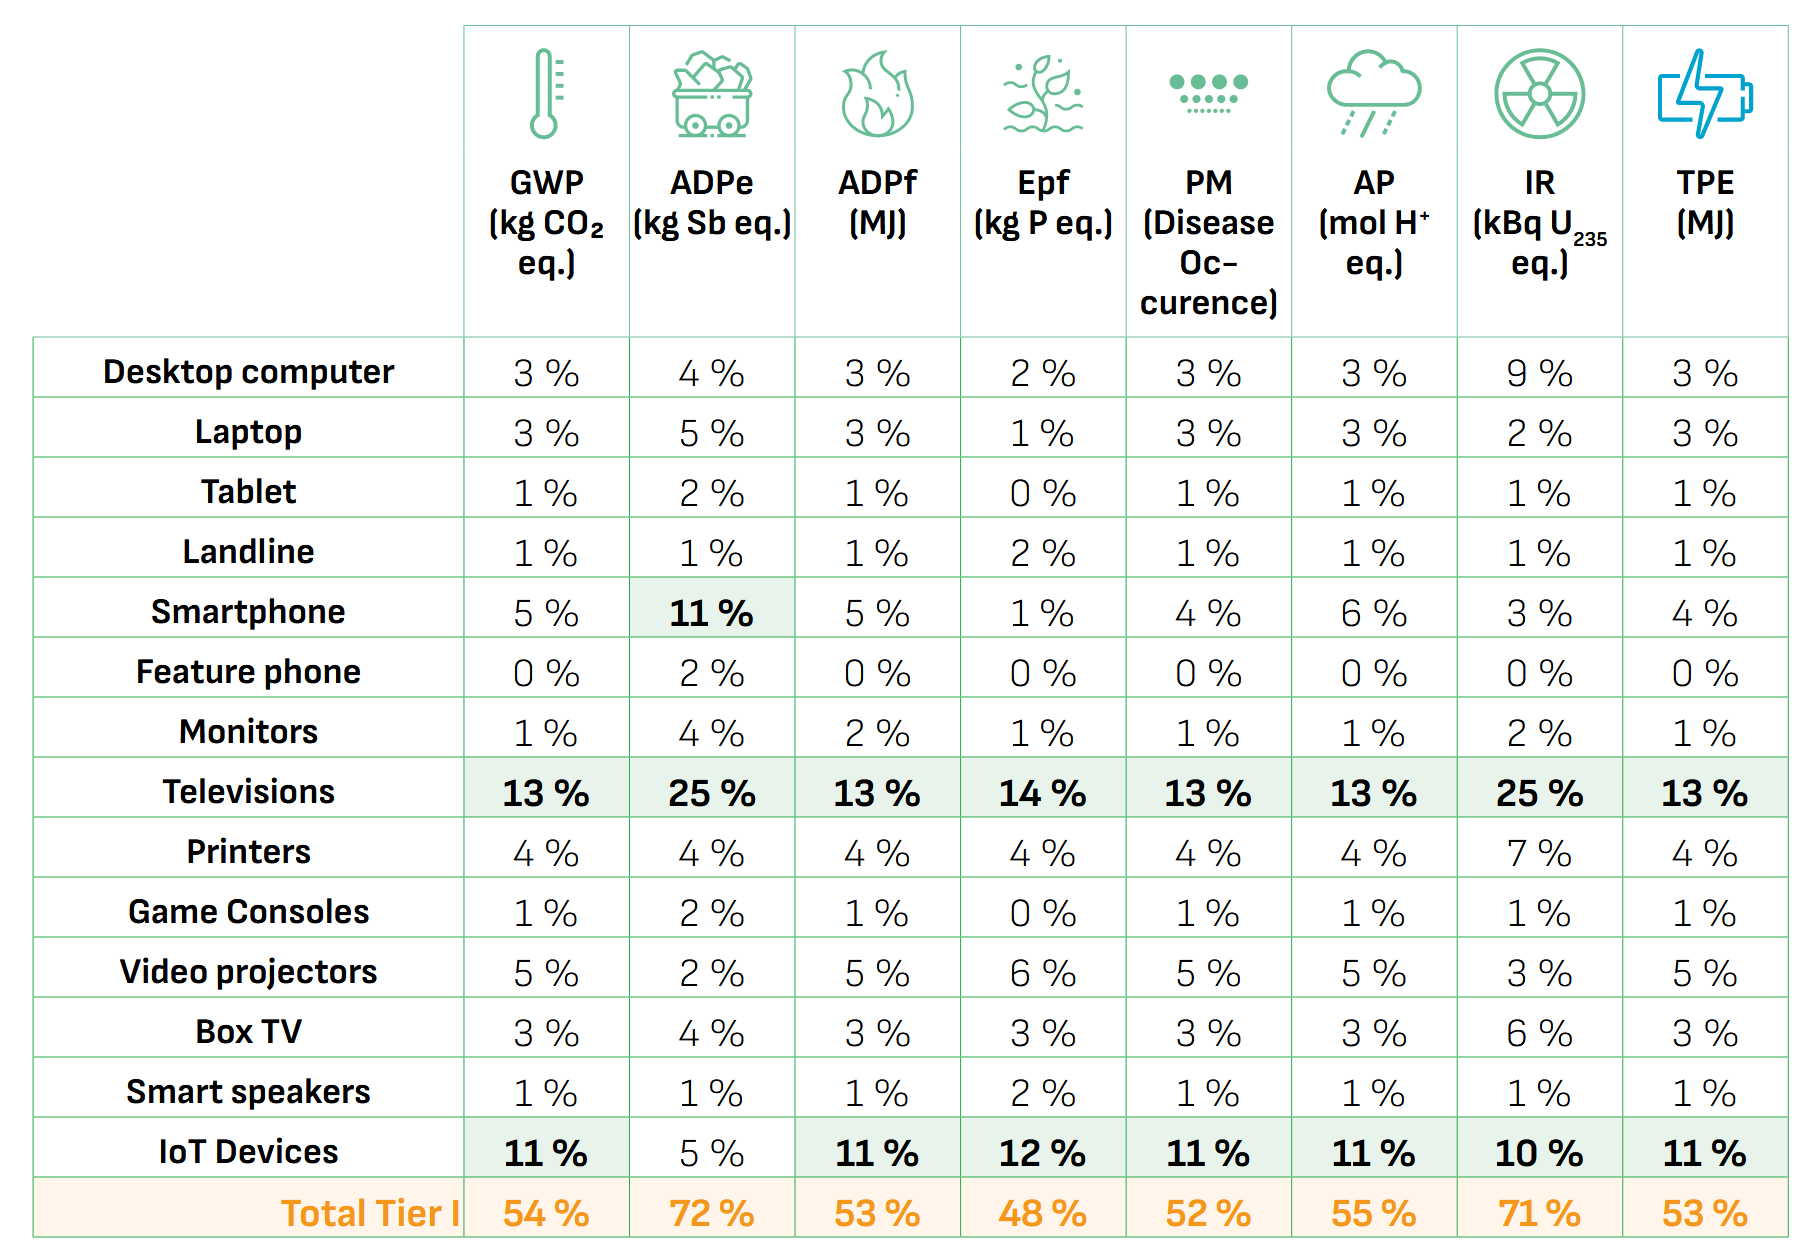
Distribution of the environmental impacts of user equipment (Tier I) by equipment category as a proportion of the total environmental impacts of digital technology in the world over the 3 Tiers
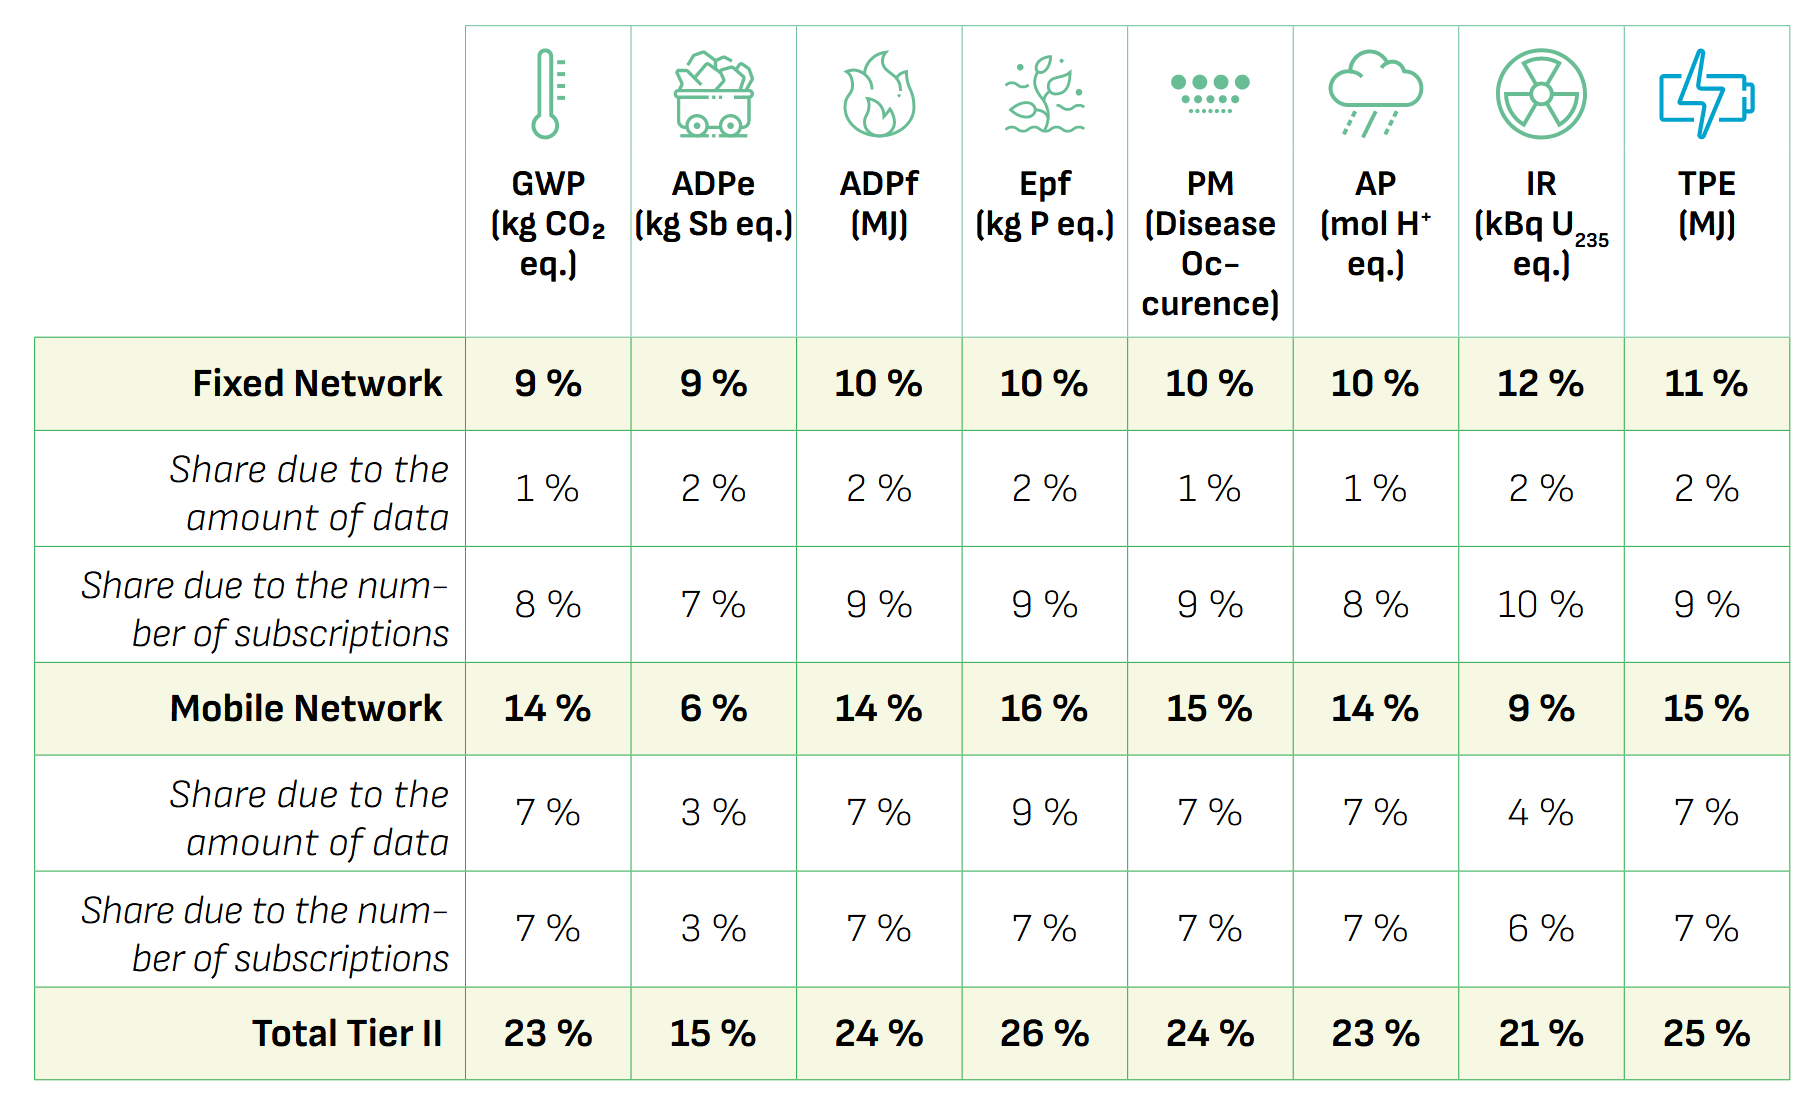
Distribution of the environmental impacts of networks (Tier II) according to the type and share due to the subscription or the amount of data exchanged, in proportion to the total environmental impacts of digital technology in the world on the 3 Tiers
Distribution of the environmental impacts of data centers (Tier III), as a proportion of the total environmental impacts of digital technology in the world over the 3 Thirds