The Datacenter as a Computer: Designing Warehouse-Scale Machines
Status:: 🟩
Links:: Power Proportionality and Idle Power Consumption of Servers
Metadata
Authors:: Barroso, Luiz André; Hölzle, Urs; Ranganathan, Parthasarathy
Title:: The Datacenter as a Computer: Designing Warehouse-Scale Machines
Date:: 2019
Publisher:: Springer International Publishing
URL:: https://link.springer.com/10.1007/978-3-031-01761-2
DOI::
Barroso, L.A., Hölzle, U. and Ranganathan, P. (2019) The Datacenter as a Computer: Designing Warehouse-Scale Machines. Cham: Springer International Publishing (Synthesis Lectures on Computer Architecture). Available at: https://doi.org/10.1007/978-3-031-01761-2.
This book describes warehouse-scale computers (WSCs), the computing platforms that power cloud computing and all the great web services we use every day. It discusses how these new systems treat the datacenter itself as one massive computer designed at warehouse scale, with hardware and software working in concert to deliver good levels of internet service performance. The book details the architecture of WSCs and covers the main factors influencing their design, operation, and cost structure, and the characteristics of their software base. Each chapter contains multiple real-world examples, including detailed case studies and previously unpublished details of the infrastructure used to power Google’s online services. Targeted at the architects and programmers of today’s WSCs, this book provides a great foundation for those looking to innovate in this fascinating and important area, but the material will also be broadly interesting to those who just want to understand the infrastructure powering the internet.
The third edition reflects four years of advancements since the previous edition and nearly doubles the number of pictures and figures. New topics range from additional workloads like video streaming, machine learning, and public cloud to specialized silicon accelerators, storage and network building blocks, and a revised discussion of data center power and cooling, and uptime. Further discussions of emerging trends and opportunities ensure that this revised edition will remain an essential resource for educators and professionals working on the next generation of WSCs.
Notes & Annotations
Color-coded highlighting system used for annotations
📑 Annotations (imported on 2024-03-17#07:00:33)
Although this breakdown will vary significantly depending on how systems are configured for a given workload, the graph indicates that CPUs are the dominant energy consumer in WSCs. Interestingly, the first edition of this book showed the relative energy use of the memory system rising to near parity with CPU consumption. Since then that trend has reversed due to a combination of effects. First, sophisticated thermal management has allowed CPUs to run closer to their maximum power envelope, resulting in higher energy consumption per CPU socket. Second, memory technology has shifted away from power hungry FBDIMMs to DDR3 and DDR4 systems with better energy management. Third, DRAM voltage has dropped from 1.8 V down to 1.2 V. Finally, today’s systems have a higher ratio of CPU performance per gigabyte of DRAM, possibly as a result of a more challenging technology scaling roadmap for main memory.
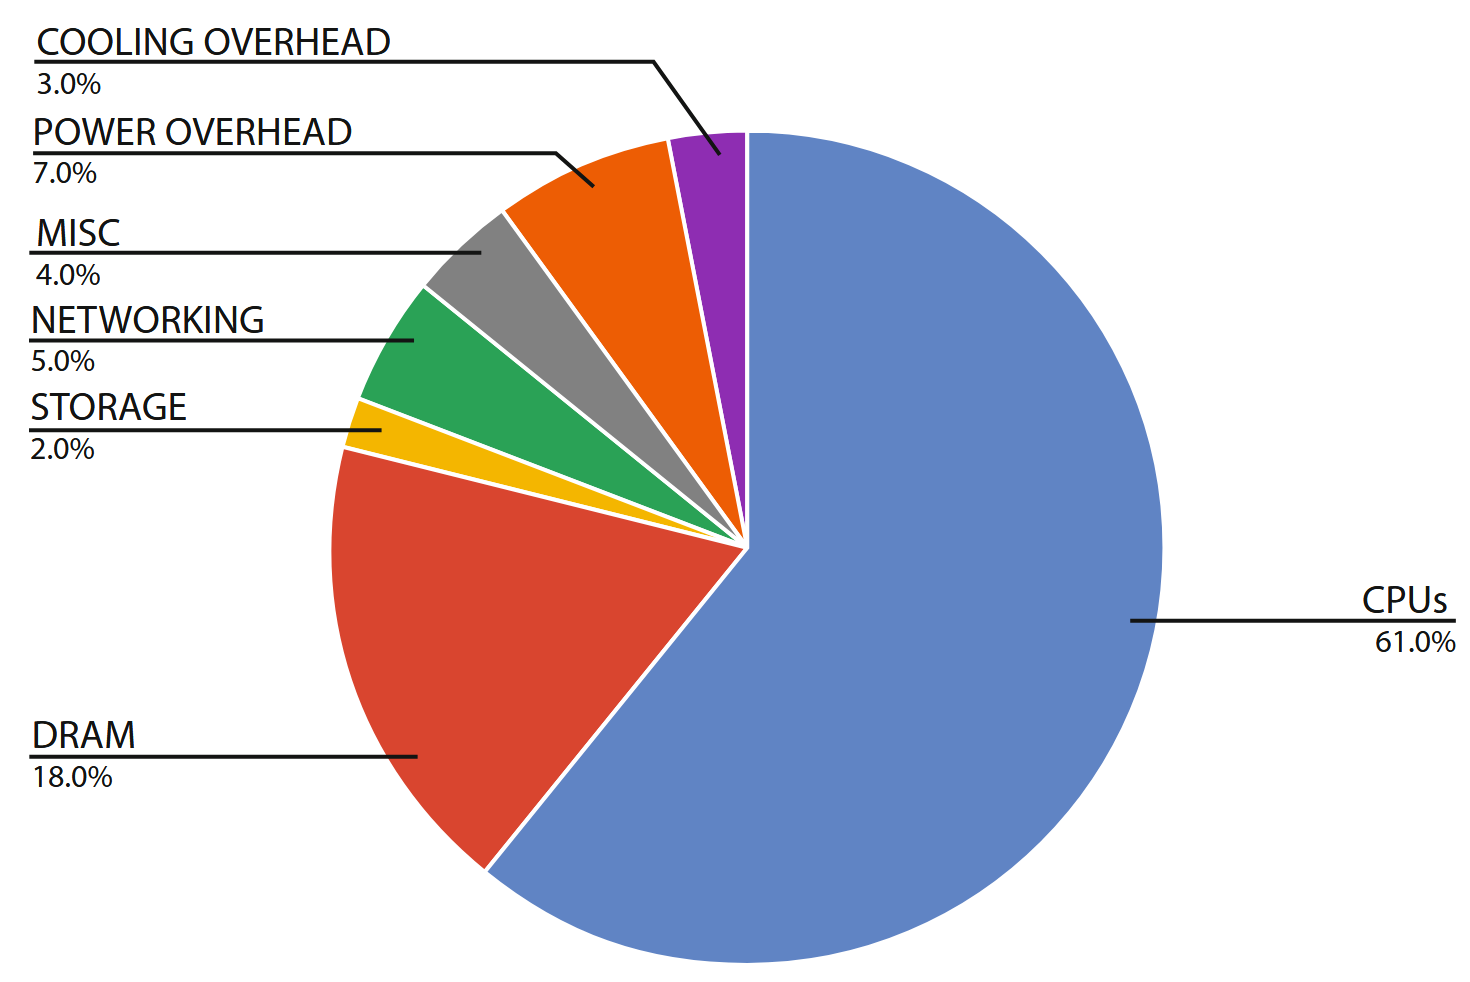
Approximate distribution of peak power usage by hardware subsystem in a modern data center using late 2017 generation servers. The figure assumes two-socket x86 servers and 12 DIMMs per server, and an average utilization of 80%.
Power usage effectiveness (PUE) reflects the quality of the data center building infrastructure itself [TGGc], and captures the ratio of total building power to IT power (the power consumed by the computing, networking, and other IT equipment).
A subsequent EPA survey of over 100 data centers reported an average PUE of 1.91 [PUE10]. A few years back, an Uptime Institute survey of over 1,100 data centers covering a range of geographies and sizes reported an average PUE value between 1.8 and 1.89 [UpI12, Hes14]. More recently, a 2016 report from LBNL noted PUEs of 1.13 for hyperscale data centers (warehouse-scale computers) and 1.6–2.35 for traditional data centers [She+16].
Very large operators (usually consumer internet companies like Google, Microsoft, Yahoo!, Facebook, Amazon, Alibaba, and eBay) have reported excellent PUE results over the past few years, typically below 1.2, although only Google has provided regular updates of its entire fleet based on a clearly defined metric (Figure 5.2) [GDCa].
Figure 5.3 shows the typical distribution of energy losses in a WSC data center. Much of this inefficiency is caused by a historical lack of attention to power loss, not by inherent limitations imposed by physics. Less than 10 years ago, PUEs weren’t formally used and a total overhead of 20% was considered unthinkably low, yet as of 2018 Google reported a fleet-wide annual average overhead of 11% [GDCb] and many others are claiming similar values for their newest facilities.
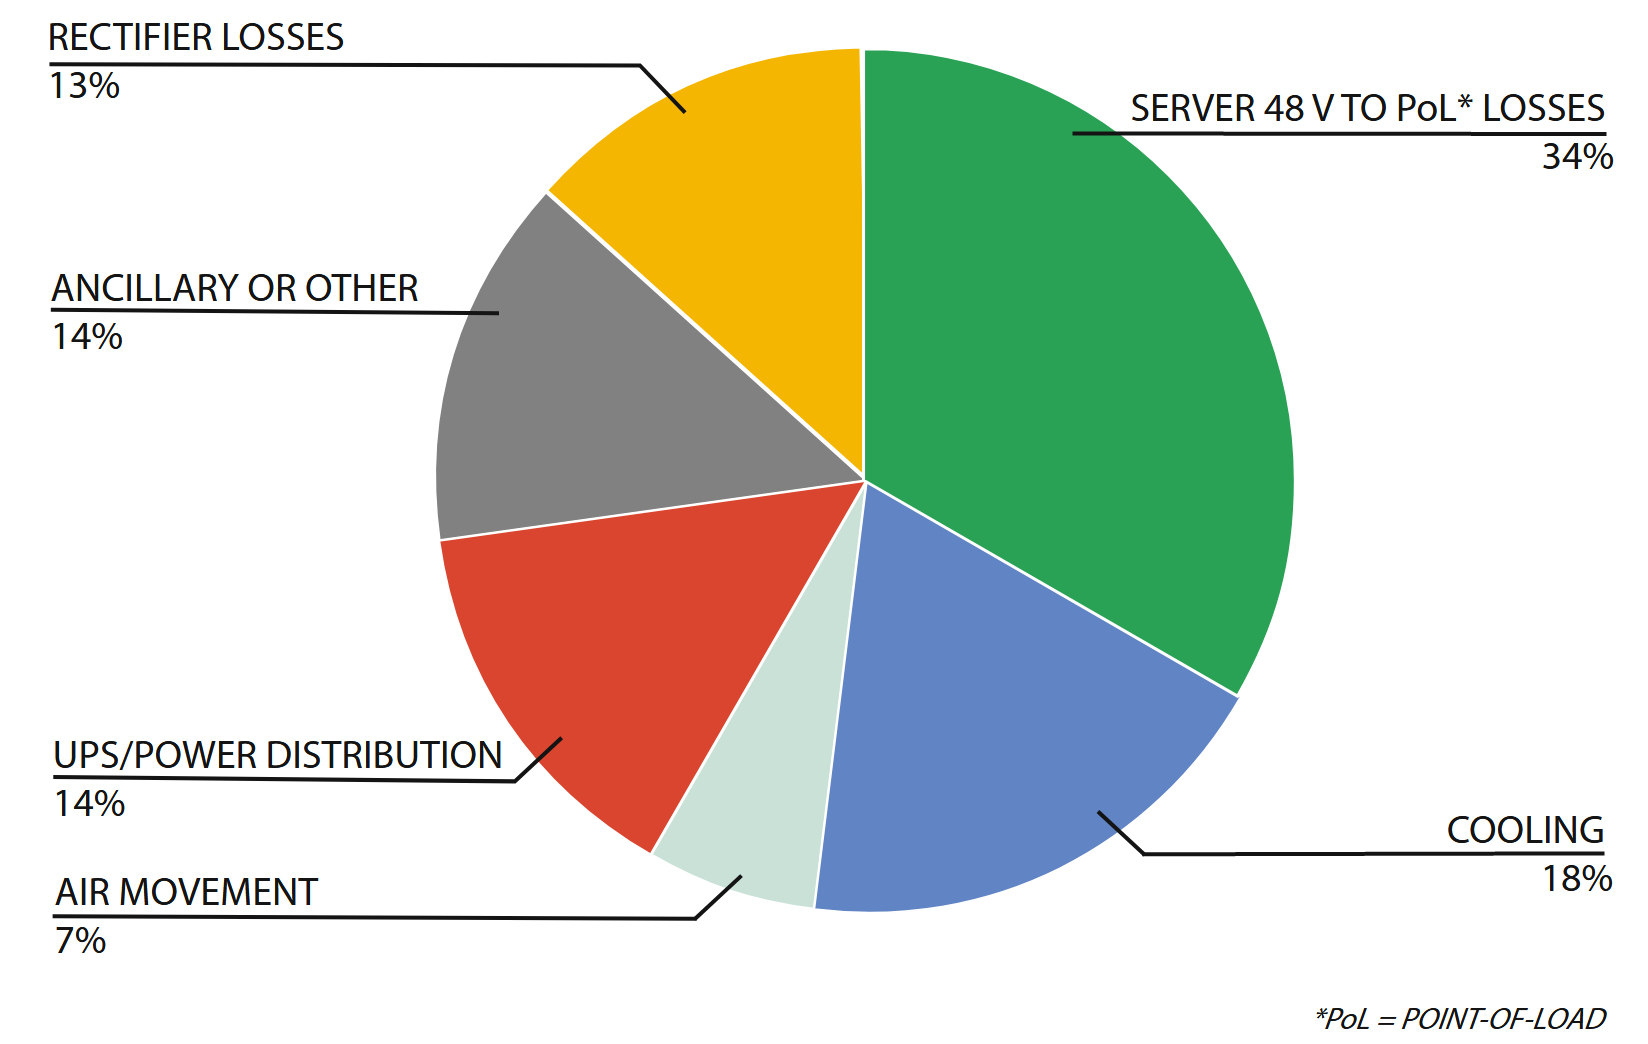
A representative end-to-end breakdown of energy losses in a typical datacenter. Note that this breakdown does not include losses of up to a few percent due to server fans or electrical resistance on server boards.
Clearly, the same application binary can consume different amounts of power depending on the server’s architecture and, similarly, an application can consume more or less of a server’s capacity depending on software performance tuning. Furthemore, systems efficiency can vary with utilization: under low levels of utilization, computing systems tend to be significantly more inefficient than when they are exercised at maximum utilization.
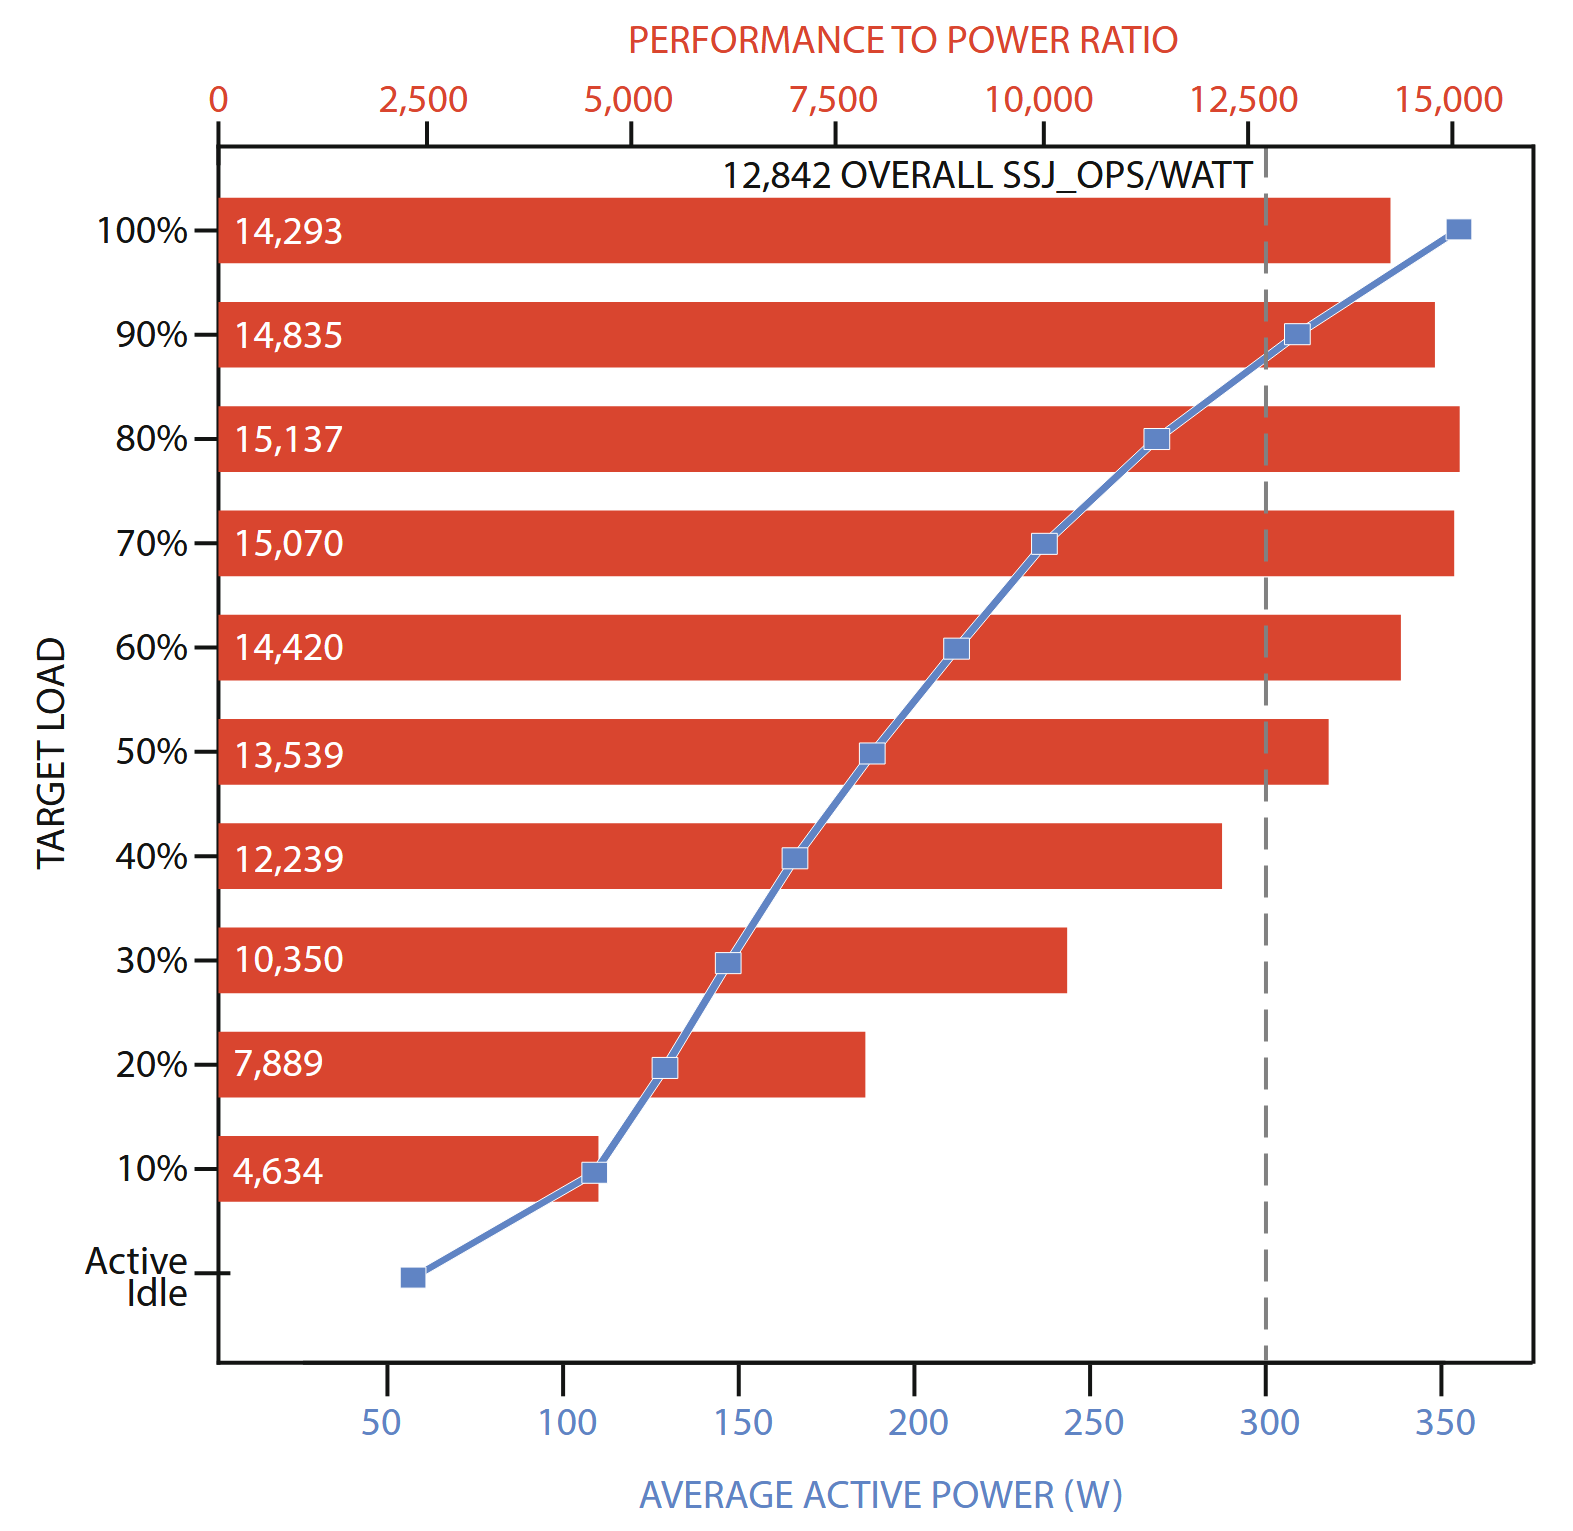
Example benchmark result for SPECpower_ssj2008; bars indicate energy efficiency and the line indicates power consumption. Both are plotted for a range of utilization levels, with the average energy efficiency metric corresponding to the vertical dark line. The system has two 2.1 GHz 28core Intel Xeon processors, 192 GB of DRAM, and one M.2 SATA SSD.
Figure 5.4 shows the SPECpower benchmark results for the top performing entry as of January 2018 under varying utilization. The results show two metrics: performance- (transactions per second) to-power ratio and the average system power, plotted over 11 load levels. One feature in the figure is noteworthy and common to all other SPECpower benchmark results: the performance-to-power ratio drops appreciably as the target load decreases because the system power decreases much more slowly than does performance. Note, for example, that the energy efficiency at 30% load has 30% lower efficiency than at 100%. Moreover, when the system is idle, it is still consuming just under 60 W, which is 16% of the peak power consumption of the server.
Figure 5.5 shows the average CPU utilization of two Google clusters during a representative threemonth period (measured between January and March 2013); each cluster has over 20,000 servers. The cluster on the right (b) represents one of Google’s most highly utilized WSCs, where large continuous batch workloads run. WSCs of this class can be scheduled very efficiently and reach very high utilizations on average. The cluster on the left (a) is more representative of a typical shared WSC, which mixes several types of workloads and includes online services. Such WSCs tend to have relatively low average utilization, spending most of their time in the 10–50% CPU utilization range. This activity profile turns out to be a perfect mismatch with the energy efficiency profile of modern servers in that they spend most of their time in the load region where they are most inefficient.
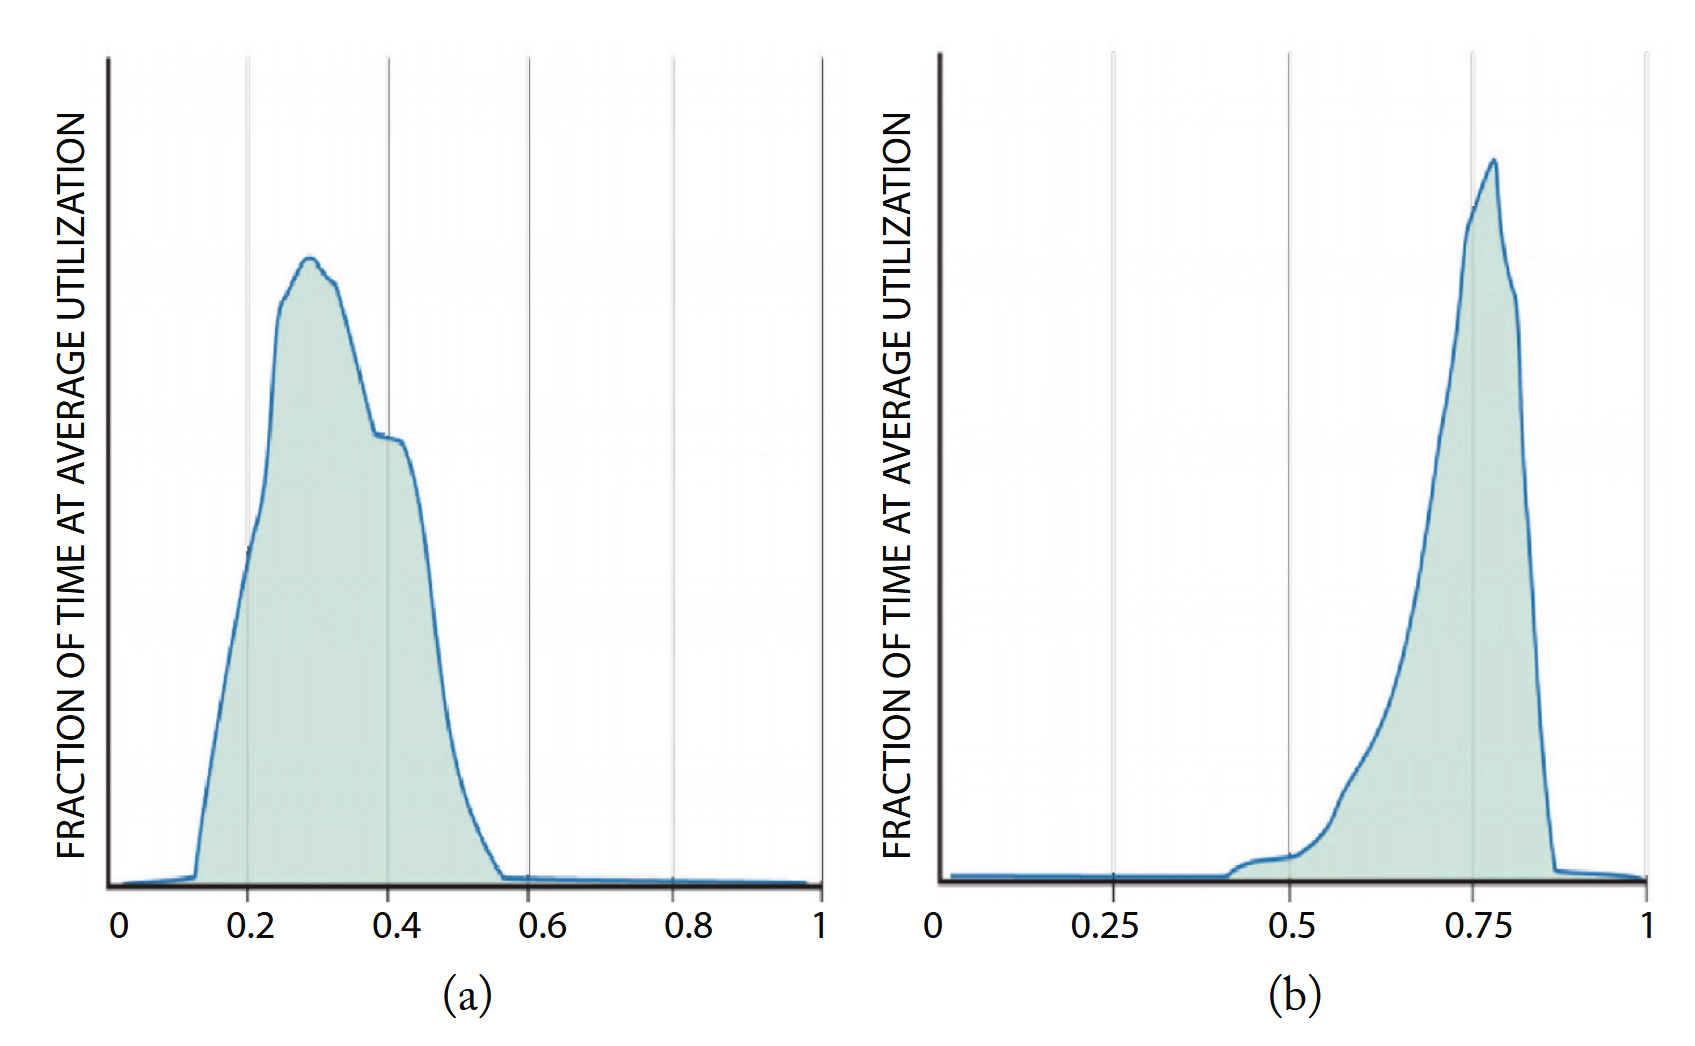
Figure 5.5: Average activity distribution of a sample of 2 Google clusters, each containing over 20,000 servers, over a period of 3 months.
We suggest that energy proportionality should be added as a design goal for computing components. Ideally, energy-proportional systems will consume almost no power when idle (particularly in active idle states where they are still available to do work) and gradually consume more power as the activity level increases.
Note, however, that linearity is not necessarily the optimal relationship for energy savings. As shown in Figure 5.5(a), since servers spend relatively little time at high activity levels, it might be fine to decrease efficiency at high utilizations, particularly when approaching maximum utilization. However, doing so would increase the maximum power draw of the equipment, thus increasing facility costs.
Although CPUs historically have a bad reputation regarding energy usage, they are not necessarily the only culprit for poor energy proportionality. Over the last few years, CPU designers have paid more attention to energy efficiency than their counterparts for other subsystems. The switch to multicore architectures instead of continuing to push for higher clock frequencies and larger levels of speculative execution is one of the reasons for this more power-efficient trend.
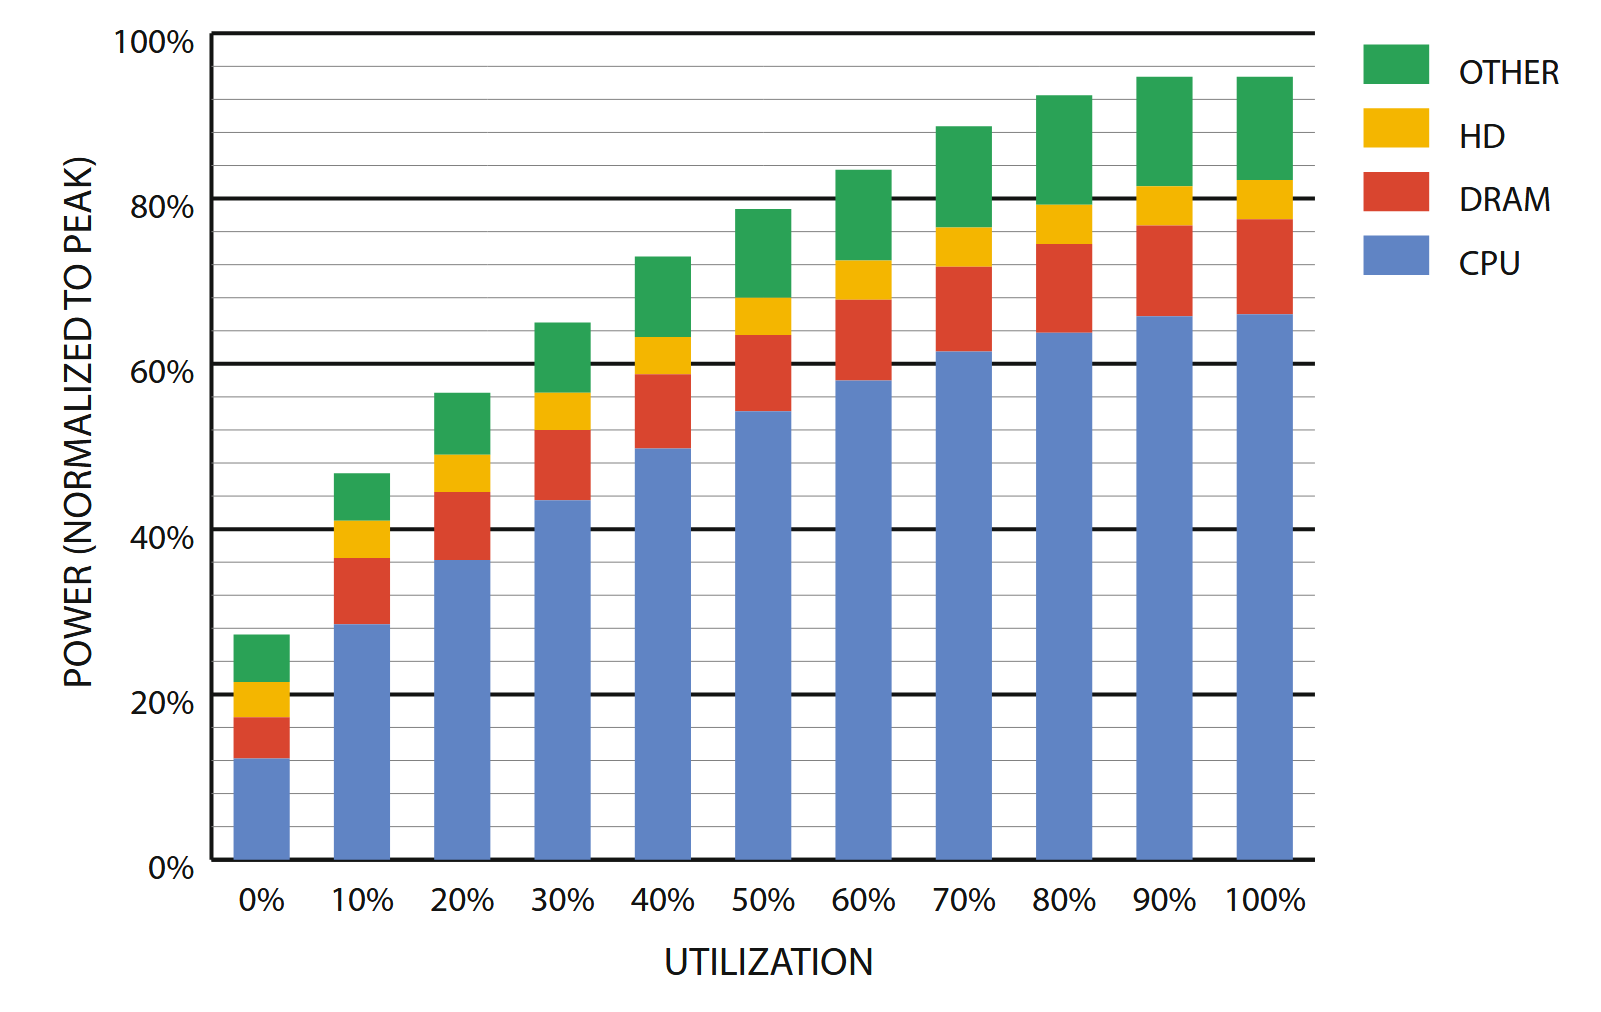
Figure 5.7: Subsystem power usage in an x86 server as the compute load varies from idle to full usage.
Figure 5.7 shows the power usage of the main subsystems for a Google server (circa 2012) as the compute load varies from idle to full activity levels. Unlike what we reported in the first edition, the CPU portion (everything inside a CPU socket) is once more the dominant energy consumer in servers, using two-thirds of the energy at peak utilization and about 40% when (active) idle.
In our experience, server-class CPUs have a dynamic power range that is generally greater than 3.0x (more than 3.5x in this case), whereas CPUs targeted at the embedded or mobile markets can do even better. By comparison, the dynamic range of memory systems, disk drives, and networking equipment is much lower: approximately 2.0x for memory, 1.3x for disks, and less than 1.2x for networking switches. This suggests that energy proportionality at the system level cannot be achieved through CPU optimizations alone, but instead requires improvements across all components.
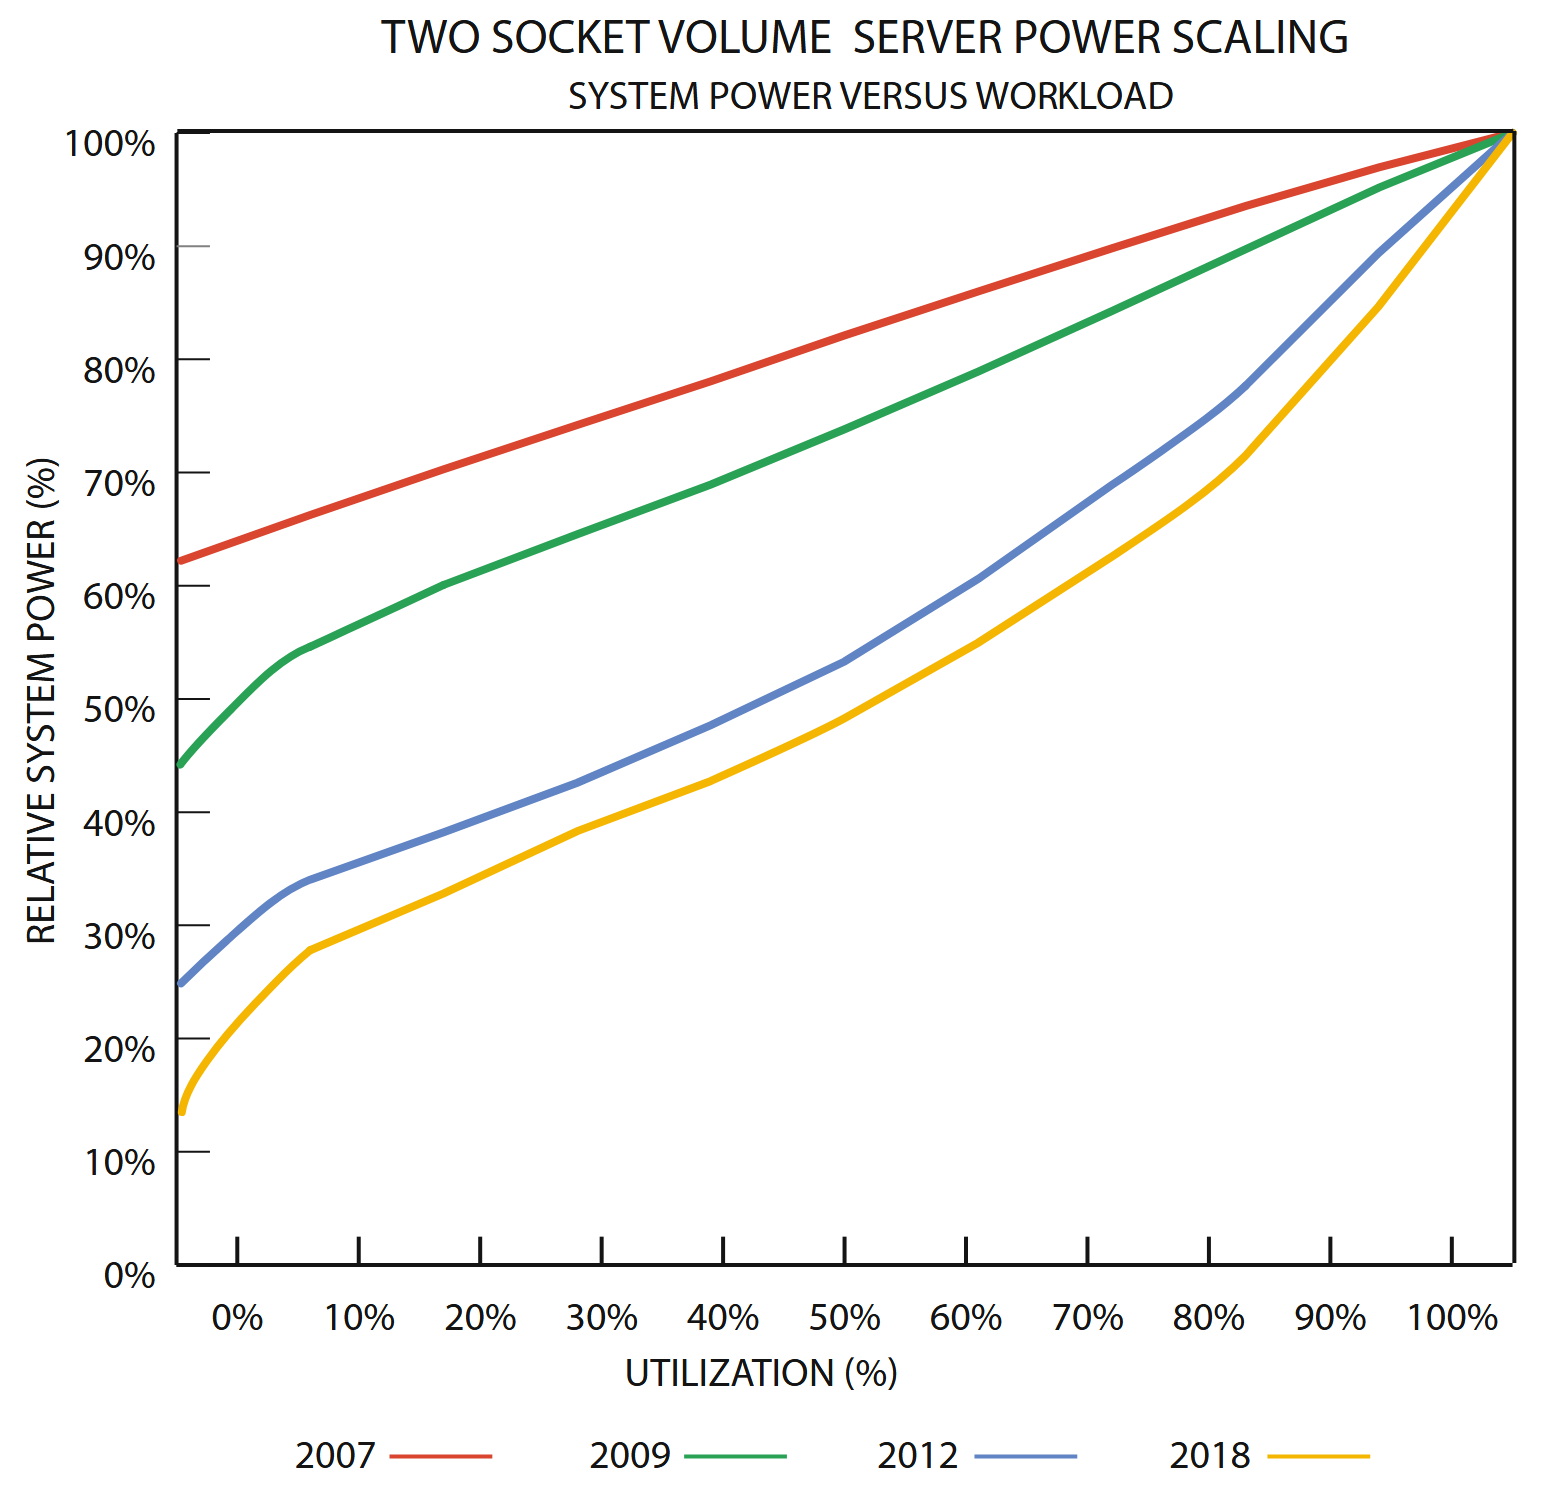
Figure 5.8: Normalized system power vs. utilization in Intel servers from 2007–2018 (courtesy of David Lo, Google). The chart indicates that Intel servers have become more energy proportional in the 12-year period.
While processor energy proportionality has improved, greater effort is still required for DRAM, storage, and networking. Disk drives, for example, spend a large fraction of their energy budget (as much as 70% of their total power for high RPM drives) simply keeping the platters spinning.
Traditionally, data center networking equipment has exhibited rather poor energy proportionality. At Google we have measured switches that show little variability in energy consumption between idle and full utilization modes.
Software plays an important role in improving cluster-level energy efficiency despite poor energy proportionality of underlying servers. By increasing the utilization of each individual server, cluster management software can avoid operating servers in the region of poor energy efficiency at low loads. Cluster scheduling software such as Borg [Ver+15] and Mesos [Hin+11] take advantage of resource sharing to significantly improve machine-level utilization through better bin-packing of disparate jobs (encapsulation).
To counter the effects of interference, service owners tend to increase the resource requirements of sensitive workloads in order to ensure that their jobs will have sufficient compute capacity in the face of resource contention. This extra padding has an effect of lowering server utilization, thus also negatively impacting energy efficiency. To avoid this pitfall and to further raise utilization, contention aware scheduling needs to be utilized.
While general-purpose CPUs improve marginally over time when it comes to energy efficiency improvements at peak load, the demand for compute is growing at a steady rate. Currently, this demand is being driven by technologies powered by artificial intelligence and machine learning, which require extraordinary amounts of compute commensurate with large model sizes and gargantuan amounts of data being fed into such workloads. While general-purpose CPUs are fully capable of performing the operations necessary for artificial intelligence, they are not optimized to run these kinds of workloads.
Specialized accelerators have an important role to play in improving the energy efficiency of WSCs of the future. Large emerging workloads such as machine learning are ripe targets for acceleration due to the sheer volume of compute they demand. The challenge is to identify workloads that benefit from being implemented on specialized accelerators and to progress from concept to product in a relatively short timespan.
As discussed in Chapter 5, reaching a high data center power utilization is not as simple as it may seem. Even if the vendor provides a power calculator to compute the actual maximum power draw for a particular configuration, that value will assume 100% CPU utilization. If we install servers based on that value and they run at only 30% CPU utilization on average (consuming 200 W instead of 300 W), we just stranded 30% of the data center capacity. However, if we install servers based on the average value of 200 W and at month’s end the servers actually run at near full capacity for a while, our data center will overheat or trip a breaker. Similarly, we may choose to add additional RAM or disks to servers at a later time, which would require physical decompaction of server racks if we left no slack in our power consumption calculations. Thus, in practice, data center operators leave a fair amount of slack space to guard against these problems. Reserves of 20–50% are common, which means that real-world data centers rarely run at anywhere near their rated capacity. In other words, a data center with 10 MW of critical power will often consume a monthly average of just 4–6 MW of actual critical power (plus PUE overhead).
📑 Annotations (imported on 2024-12-14#19:13:19)
Server costs are computed similarly, except that servers have a shorter lifetime and thus are typically depreciated over 3–4 years.