Beyond PUE: Tackling IT’s Wasted Terawatts
Status:: 🟩
Links:: Power Usage Effectiveness | Data Center Sustainability Metrics | Uptime Institute
Zotero Tags:: #zotero/✅ #zotero/💎
Metadata
Type:: #zotero/report
Authors:: Bashroush, Rabih; Lawrence, Andy
Title:: Beyond PUE: Tackling IT’s Wasted Terawatts
Date:: 2020
Publisher:: Uptime Institute
URL:: https://uptimeinstitute.com/beyond-pue-tackling-it%E2%80%99s-wasted-terawatts
Bibliography
Bashroush, R., & Lawrence, A. (2020). Beyond PUE: Tackling IT’s Wasted Terawatts (p. 21). Uptime Institute. https://uptimeinstitute.com/beyond-pue-tackling-it%E2%80%99s-wasted-terawatts
Zotero
Abstract
Analysis of data center energy efficiency trends over the past decade, supported by detailed power usage data from over 300 data centers, shows that significant improvements have been made. While gains in mechanical and electrical efficiency have stalled over the past few years, it remains that over 65% of the power used by IT in data centers is used to process just 7% of the work, due to aging equipment inefficiencies. But if it is time for operators to pay more attention to IT energy efficiency, they need to do their analysis carefully: the slowdown in Moore’s law is creating new complications.
Notes & Annotations
Several indicators to help measure and track infrastructure efficiency have been developed, of which power usage effectiveness (PUE) is the most widely used. PUE, adopted and promoted by The Green Grid in 2006, is the ratio of the total facility energy consumption to IT equipment energy consumption. The ISO/IEC 30134-2:2016 (ISO, International Organization for Standardization; IEC, International Electrotechnical Commission) Standard now defines what PUE is and how it is measured.
If energy demand growth in the past decade has lagged the growth in IT demand, it is only partially the result of data center efficiency initiatives. The biggest improvements are the result of increased hardware efficiency (from processors, memory/storage and more), virtualization and the rise in consolidation activities. Despite this progress, major energy efficiency opportunities remain untapped. This may, in part, be due to a misplaced management focus on infrastructure and on key performance indicators (KPIs) such as PUE.
A key finding of the data (in the EURECA sample) is that aging IT kit (older than five years) represented 40% of deployed servers, consumed 66% of the energy, but contributed just 7% of the compute capacity
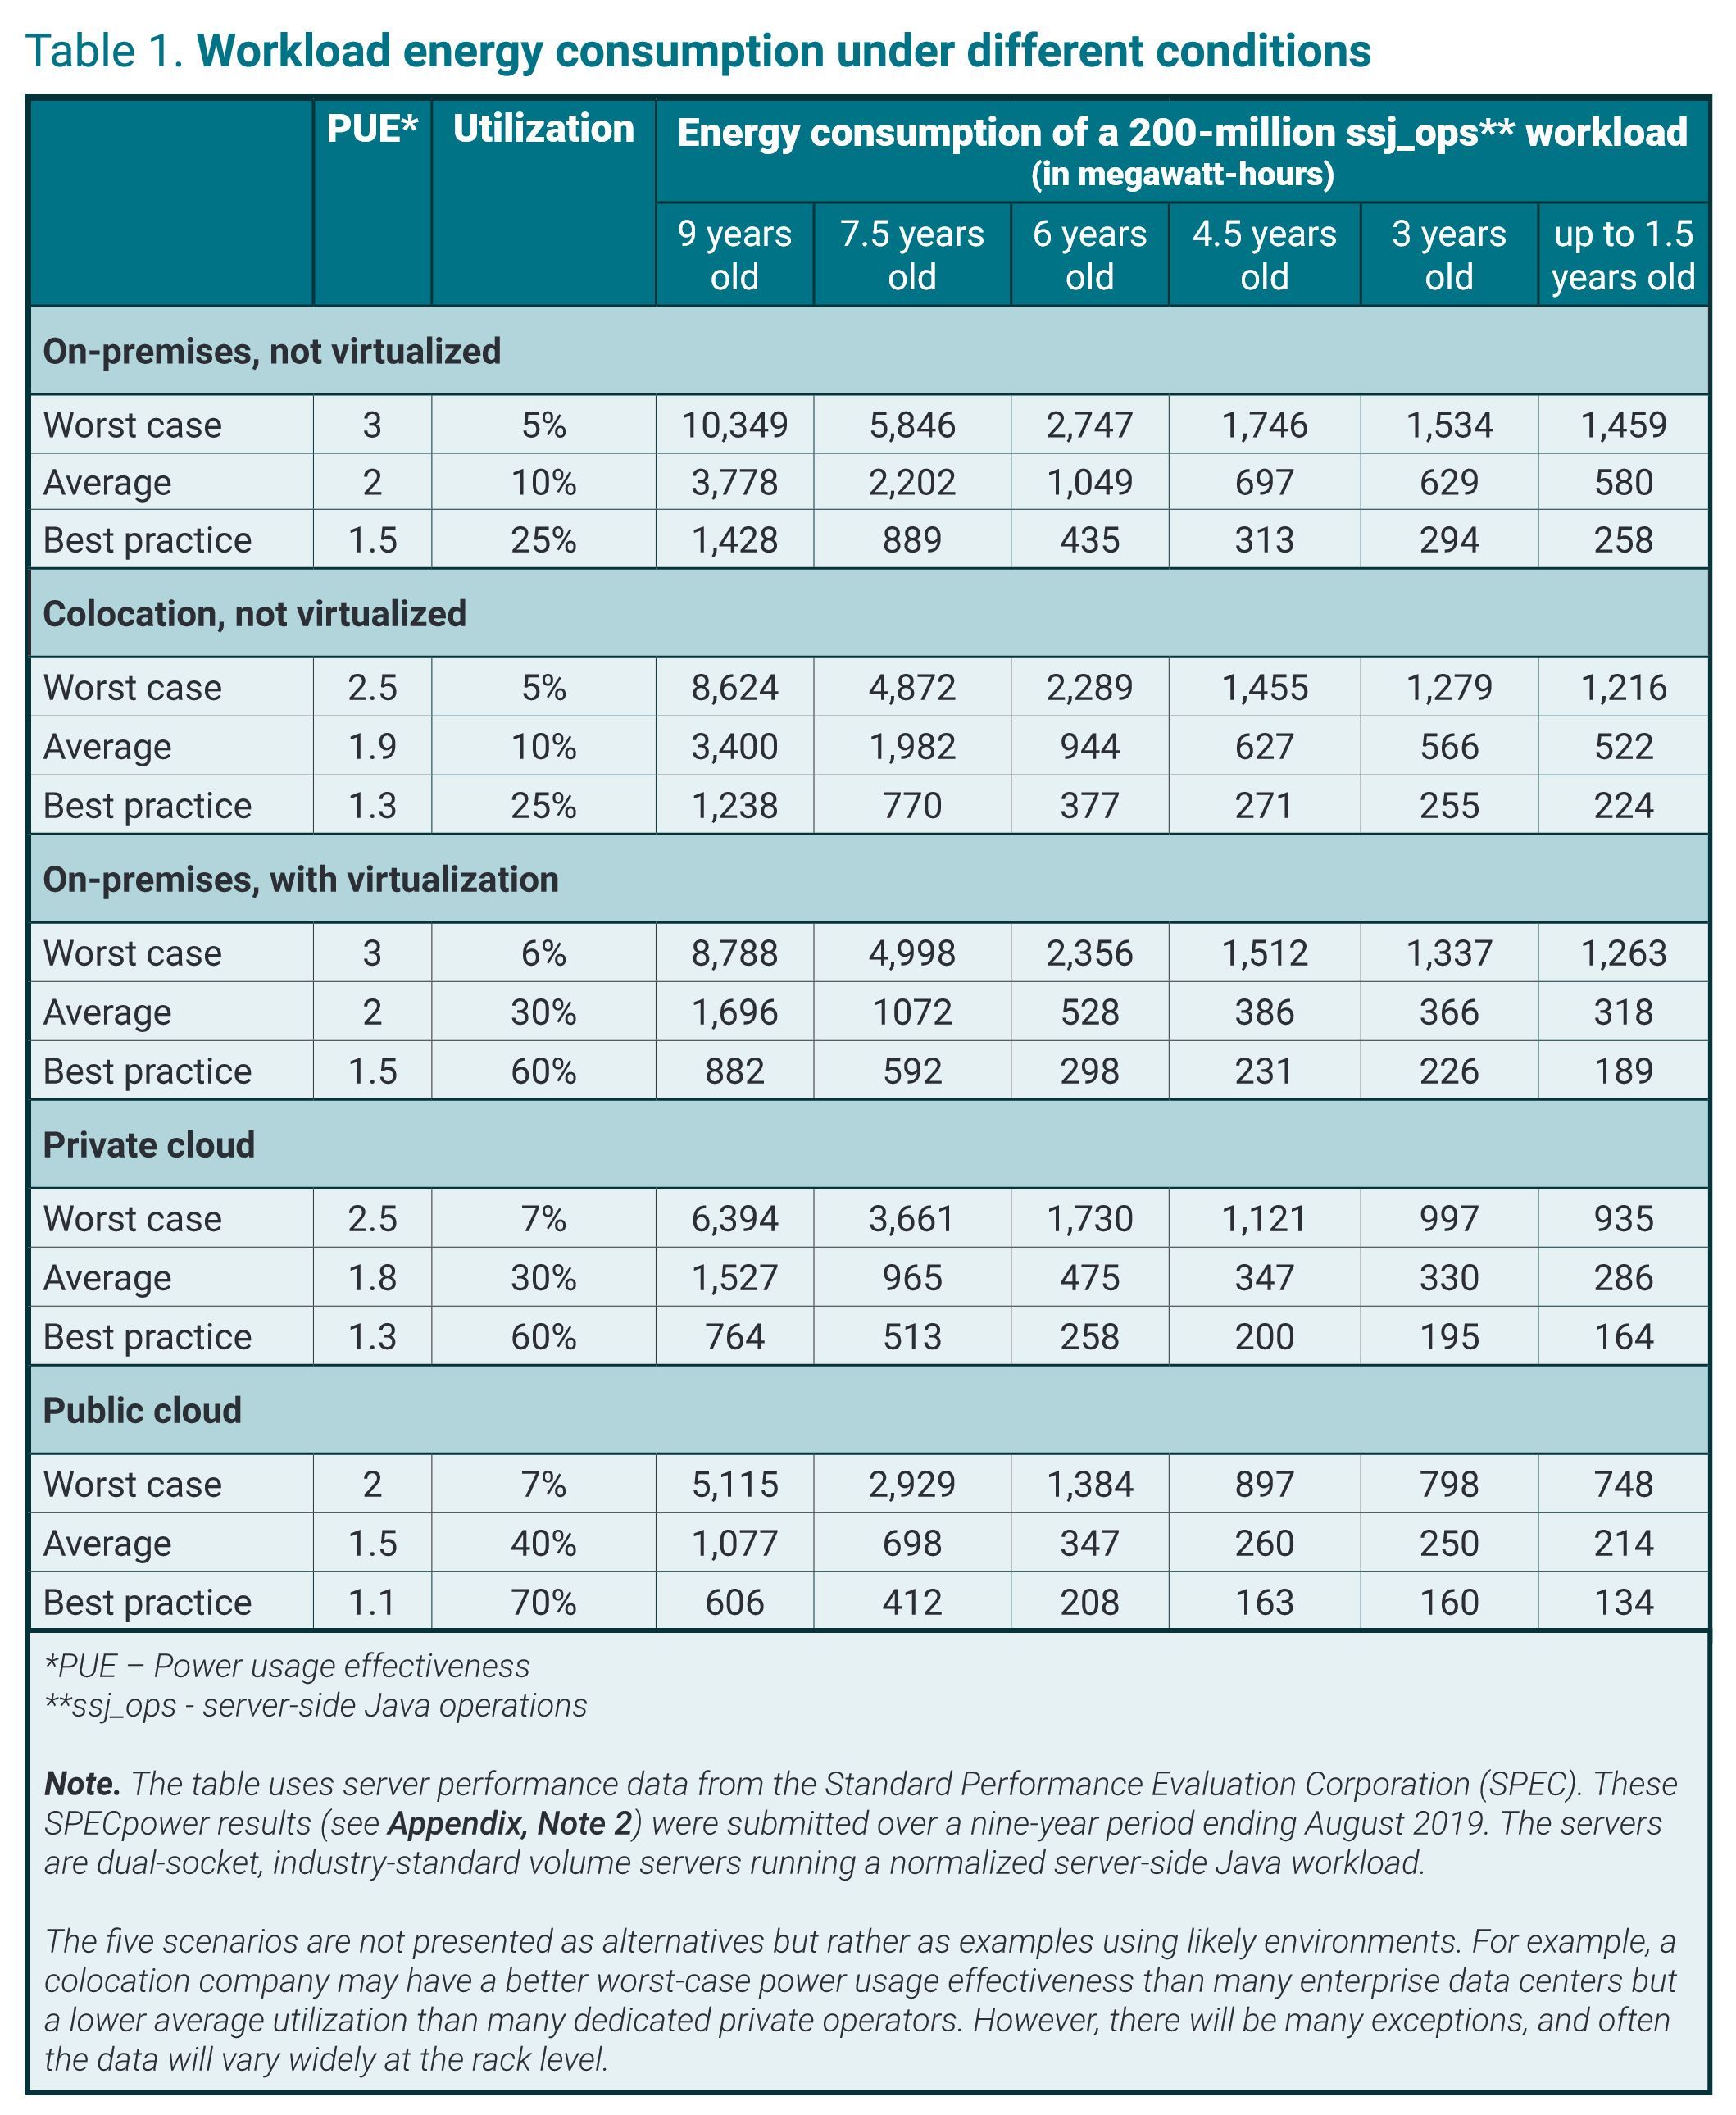
Looking at the first row in Table 1, note that running the selected workload on 9-year-old servers consumes over 10 gigawatt-hours (GWh) of electricity at a cost of over $1 million (assuming an energy price of $0.10 per kilowatt-hour, or kWh). Running the same workload within the same environment at the same utilization level but using the latest servers drops the energy consumption to 1.5 GWh, at a mere cost of $150,000. This represents a staggering reduction of 85% in energy consumption, all for the same PUE (see Appendix, Note 3) — and an operational energy savings of $850,000.
At a cost of $3,000 per server (assuming a volume dual-socket server) and 15% procurement cost/overhead, the refresh in this case would cost $2.3 million and would pay for itself within three years (due to the reduced energy consumption).
The refresh will also save over 2,623 metric tons of CO2 emissions annually in Europe (assuming a grid emission factor of 295 grams per kWh), or over 5,067 metric tons of CO2 emissions in the United States (assuming a grid emission factor of 570 grams per kWh).
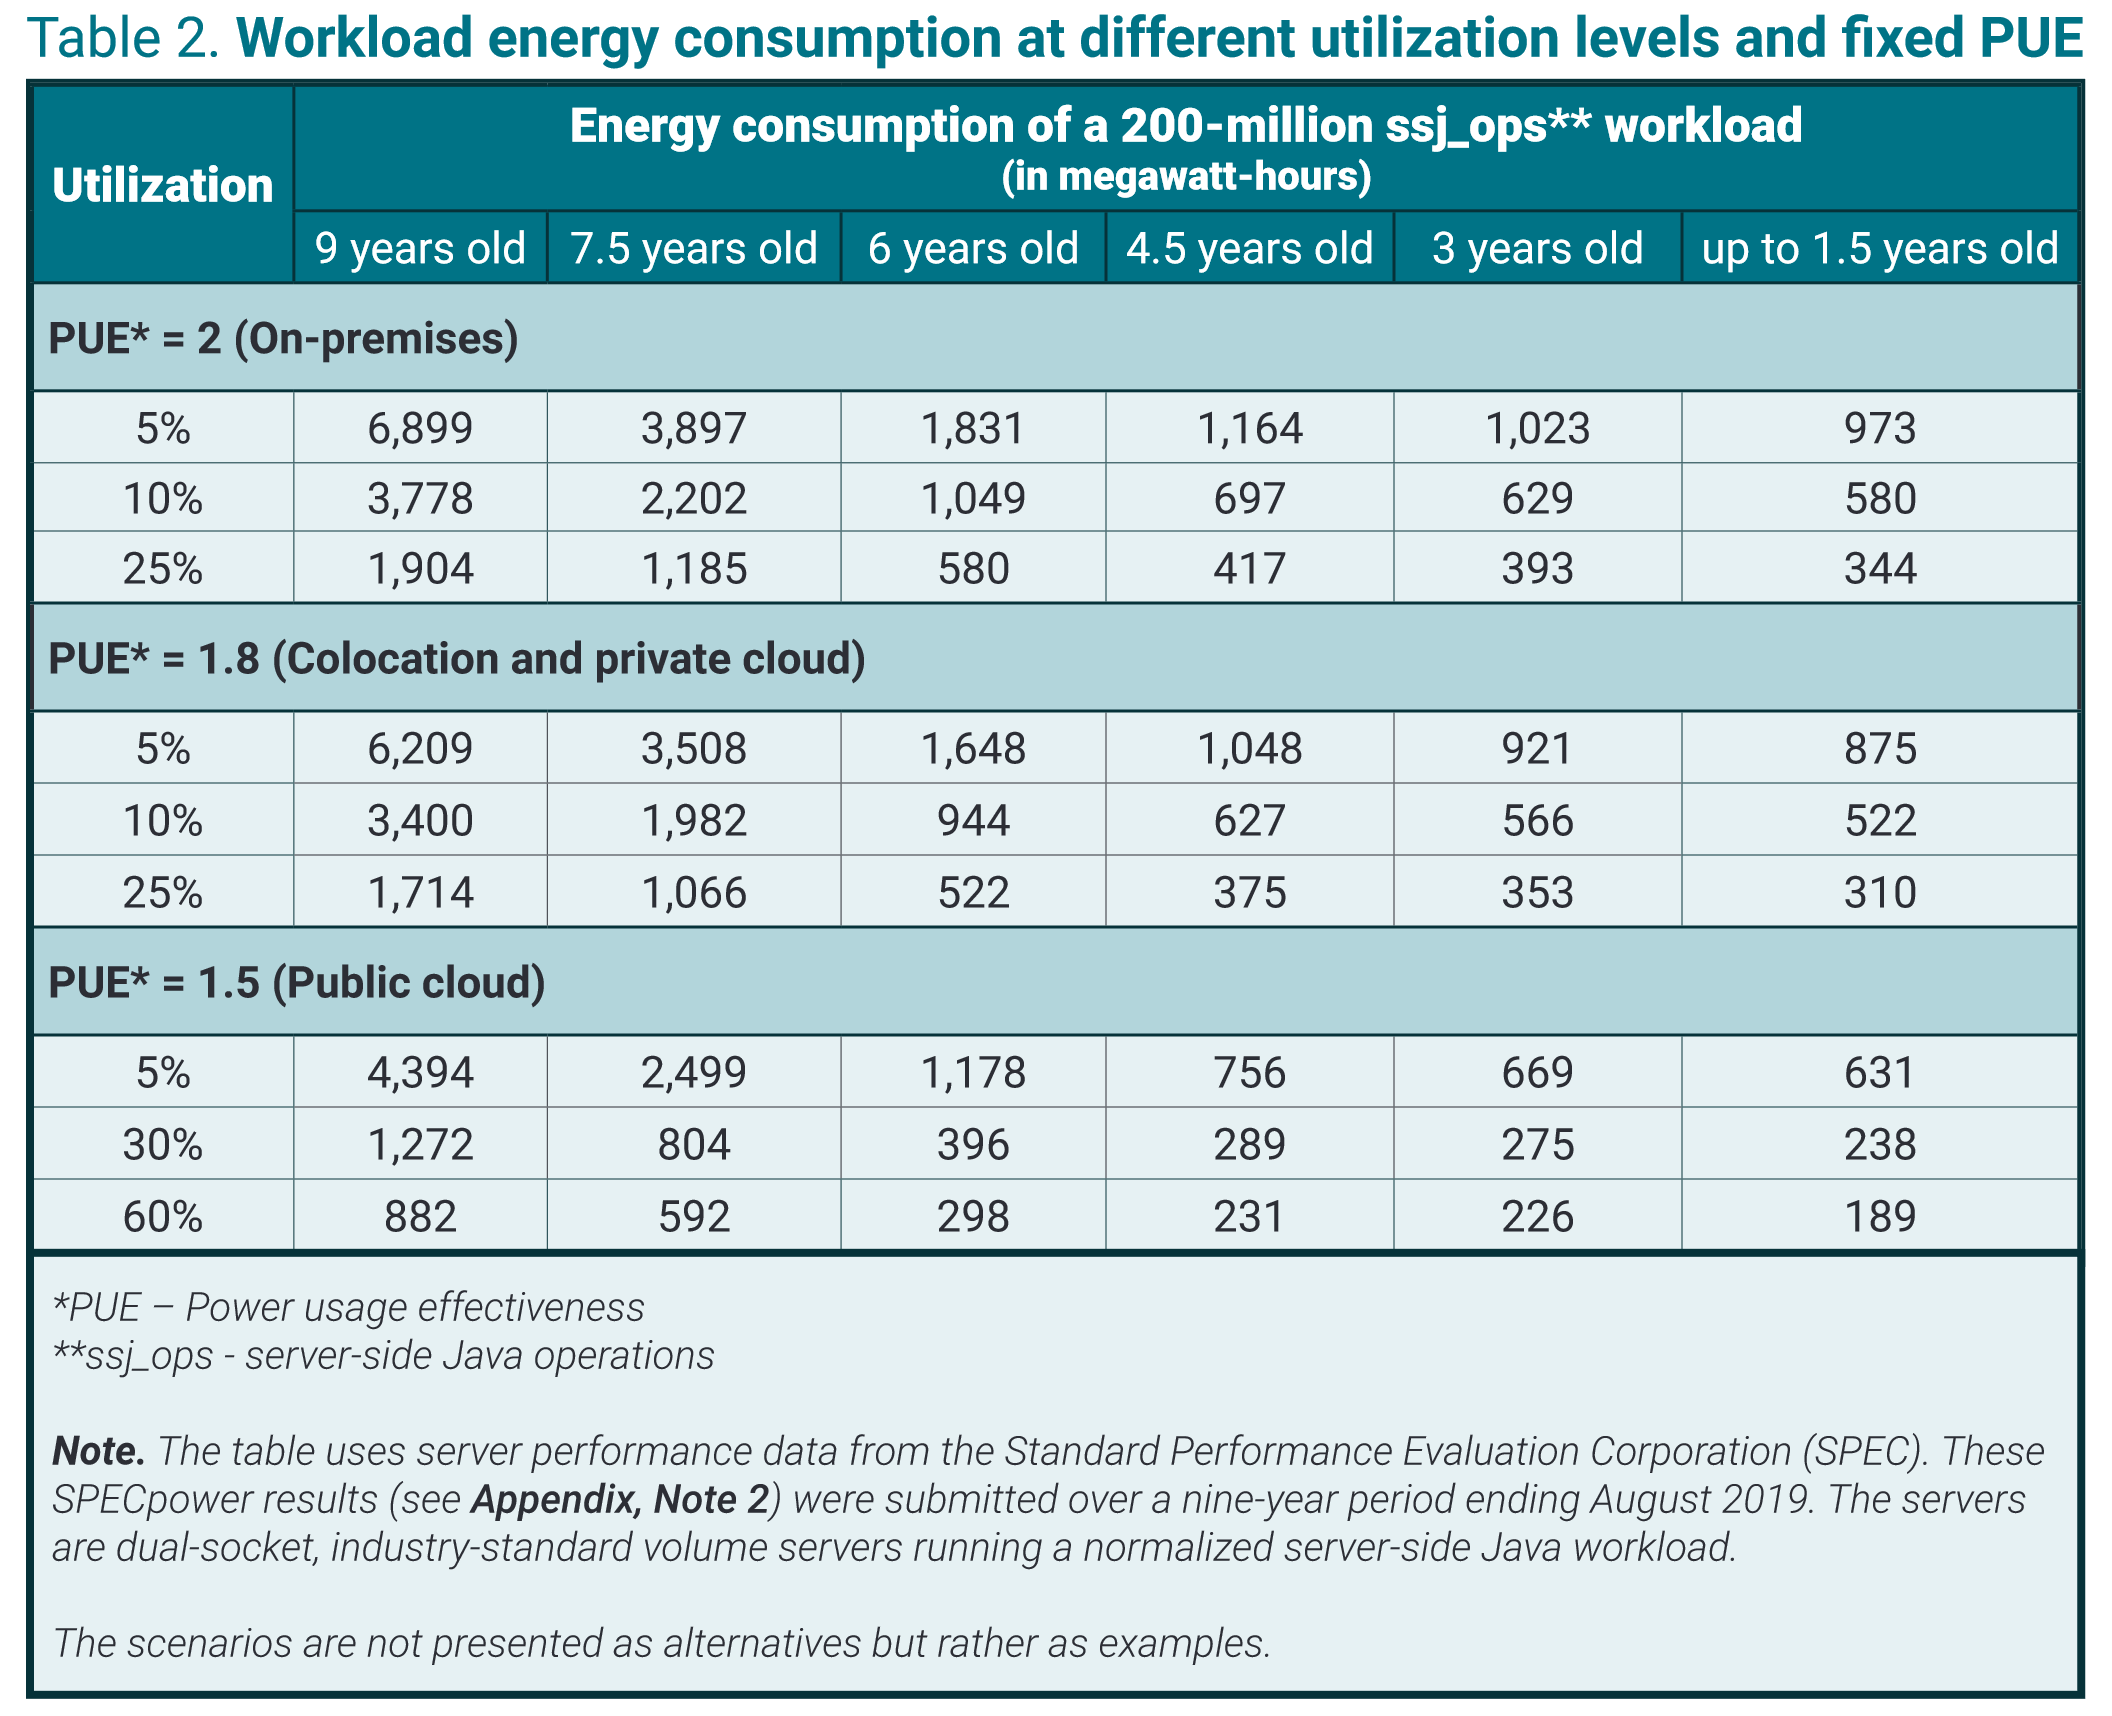
For example, running the workload on 3-year-old kit, with a PUE of 2 but increasing the utilization from 5% to 25%, reduces the energy consumption by 62%.
This is an important point that will likely have escaped many buyers and operators: If a server spends a disproportionate amount of time in active idle mode — as is the case for most — the focus should be on active idle efficiency (e.g., choosing servers with lower core count) rather than just on higher server performance efficiency, while satisfying overall compute capacity requirements.
The dynamic range is the ratio of the energy consumption at 100% target load over idle. The higher the dynamic range is, the more energy proportionate a server is. Ideally, a server uses 1% of power when doing next to no work, and 100% when fully active, giving a ratio of 100. More realistically, servers use 17% to 25% of their power at active idle.