Benchmarks and performance metrics for assessing the migration to microservice-based architectures
Status:: 🟩
Links:: Microservices vs. Monolith
Metadata
Authors:: Bjørndal, Nichlas; Araújo, Luiz; Bucchiarone, Antonio; Dragoni, Nicola; Mazzara, Manuel; Dustdar, Schahram
Title:: Benchmarks and performance metrics for assessing the migration to microservice-based architectures
Publication Title:: "Journal of Object Technology"
Date:: 2021
URL:: https://www.researchgate.net/publication/353337921_Benchmarks_and_performance_metrics_for_assessing_the_migration_to_microservice-based_architectures
DOI:: 10.5381/jot
Bjørndal, N., Araújo, L., Bucchiarone, A., Dragoni, N., Mazzara, M., & Dustdar, S. (2021). Benchmarks and performance metrics for assessing the migration to microservice-based architectures. Journal of Object Technology. https://doi.org/10.5381/jot
The migration from monolithic to microservice-based systems have become increasingly popular in the last decade. However, the advantages of this type of migration have not been extensively investigated in the literature, to the best of the authors' knowledge. This paper aims to present a methodology and performance indicators to support better assessment on whether the migration from a monolithic to microservice-based architecture is beneficial. A systematic review was conducted to identify the most relevant performance metrics in the literature, validated in a survey with professionals from the industry. Next, this set of metrics, including latency, throughput, scalability, CPU, memory usage, and network utilization-were used in two experiments to evaluate monolithic and microservice versions of the same system. The results reported here contribute to the body of knowledge on benchmarking different software architectures. In addition, this study illustrates how the identified metrics can more precisely assess both monolithic and microservice systems.
Notes & Annotations
Color-coded highlighting system used for annotations
📑 Annotations (imported on 2024-03-24#12:56:08)
figure 6 presents the results regard- ing latency metric. Both simple workloads and complex monolithic workload perform similarly. However, the simple microservice workload crosses the 200ms threshold much earlier than the monolithic counterpart. The monolith workload has a higher latency than the simple workload, but they still follow each other until approximately 15,000 requests per minute. Lastly, it might be noted that the microservice system handles the complex workload significantly worse as the average is many times higher than the three other workloads. The microservice system was also only able to handle the first two requests sizes.
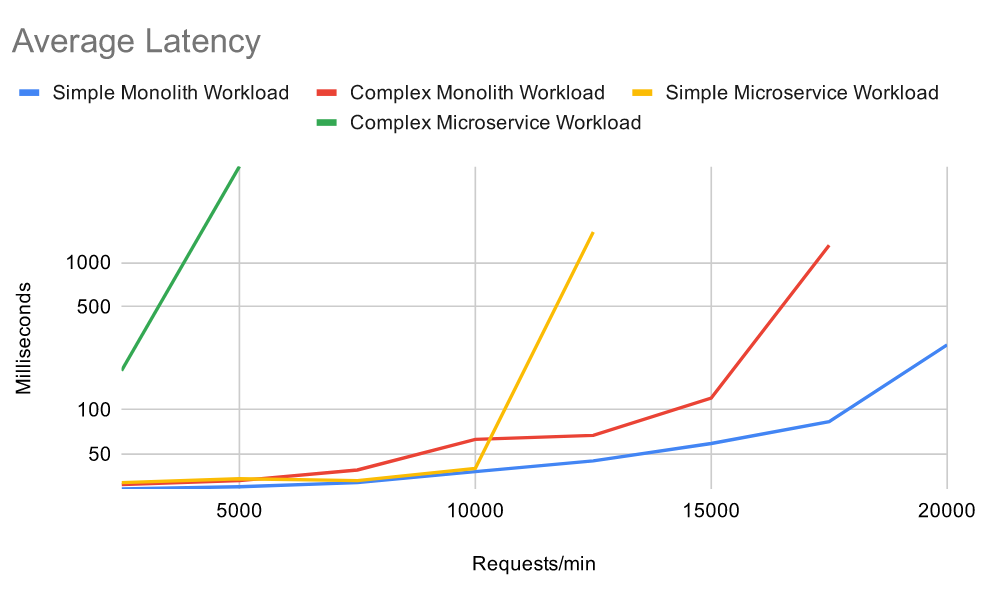
figure 6 Average latency per workload in experiment 1.
Figure 7 presents the through- put for different workloads, which apparent to mirror the latency in figure 6 regarding the break-off points. The selected workloads perform similarly until 10,000 requests per minute, except by the complex microservice. The monolith system handled more than 1.5 times successful requests for the simple workload than its microservice counterpart. On the other hand, the microservice system underperformed during the complex workload according to metrics trend. Higher throughput in both simple and complex workloads favour the monolith architecture for the setup used in this experiment.
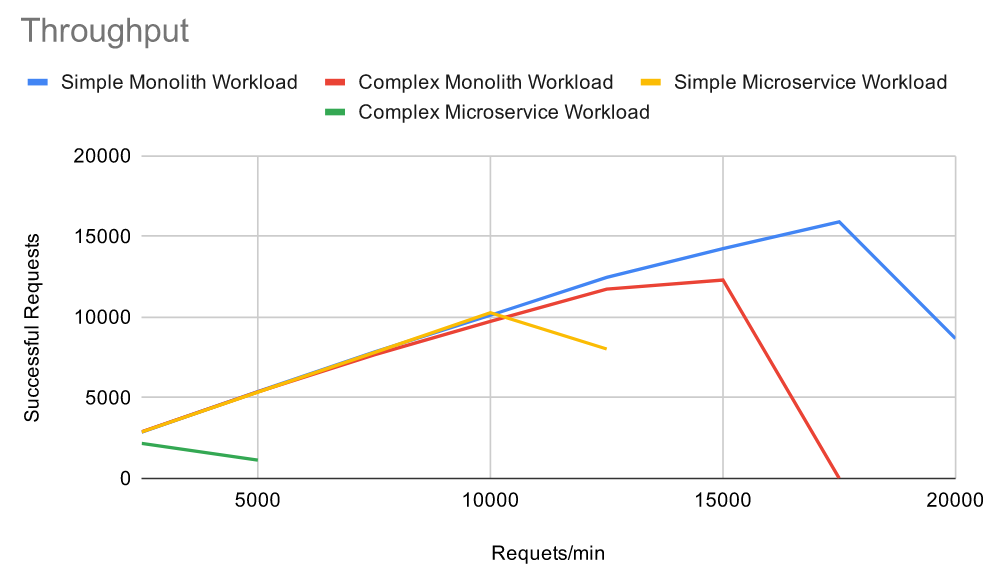
Figure 7 Throughput per workload in experiment 1.
The second benchmarking experiment consists of testing the two versions of LibraryService running on production-grade hardware - a medium to large scale experiment. In this experi- ment, Azure’s Performance Testing tool46 will be used to test the two systems at scale with different VM configurations.
The monolithic version is first configured with one CPU core, 3.50 GB memory, and 12 server instances. An alternative configuration had four CPU cores, 14 GB memory, and 30 server instances, i.e., a four times increase in resources.
The microservice system’s first configuration has two nodes of 2 CPU cores, 7 GB memory, 24 BookService pods, and three pods for each of the other services. The second setup had five nodes of similar capacity and 144 BookService pods, representing a 2.5 times increase in computational power.
The scalability is calculated by the ratio between the increase in concurrent users and the resultant increase in hardware power. The results before and after the increase are shown in Table 8. The microservice system’s scalability ratio is over six times bigger than the monolith system, indicating that the microservice version scales considerably better with increased hardware resources
App Service and Kubernetes auto horizontal scaling features based on CPU and memory usage were used. However, Azure requires a fair amount of time for the auto-scaler to reach the ideal performance, with the system properties only being sampled once a minute.
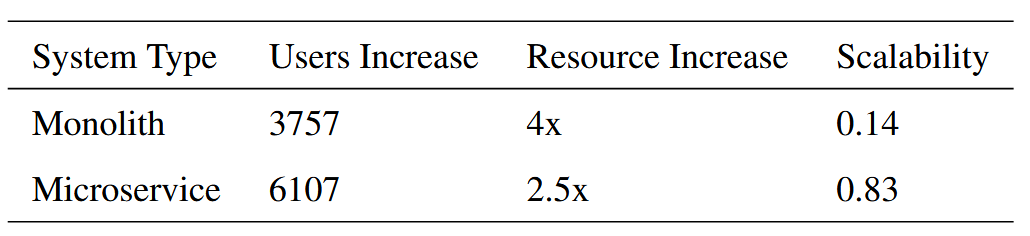
Table 8 Scalability ratio for the monolith and microservice systems.
Then, two experiments were conducted to compare the performance of both a monolithic and microservice-based version of a system developed for this study. The results stressed the relevance of the following metrics for assessing architecture migration: latency, throughput, scalability, CPU, memory and network utilization.
In summary, the monolithic architecture appears to perform better for small to medium-sized systems as used in this article. However, the much higher scalability ratio of the microservice system indicates that microservice-based architectures outperform monolith-based architectures for systems that must support many concurrent users.