Green software metrics
Status:: 🟩
Links:: climatiq @Guldner.etal.2024.DevelopmentEvaluationReference Software Carbon Intensity Specification Estimate carbon emissions of cloud applications
Metadata
Authors:: Brunnert, Andreas
Title:: Green software metrics
Date:: 2024
Publisher:: Association for Computing Machinery
URL:: https://doi.org/10.1145/3629527.3652883
DOI:: 10.1145/3629527.3652883
Brunnert, A. (2024). Green software metrics. Companion of the 15th ACM/SPEC International Conference on Performance Engineering, 287–288. https://doi.org/10.1145/3629527.3652883
Efficiency has always been at the core of software performance engineering research. Many aspects that have been addressed in performance engineering for decades are gaining popularity under the umbrella of Green IT and Green Software Engineering. Engineers and marketers in the industry are looking for ways to measure how green (in terms of carbon dioxide emissions) their software products are. Proxy measures are proposed, such as hosting cost or the power consumption of the hardware environment on which the software is running. In environments where a software system runs on a dedicated server instance, this may make sense, but in virtualised, containerised or serverless environments, it is necessary to find ways of allocating the energy consumption of the entire server to software components that share the same infrastructure. This paper proposes the use of resource demand measurements as a basis for measuring how green a given software actually is.
Notes & Annotations
Color-coded highlighting system used for annotations
📑 Annotations (imported on 2024-06-27#10:11:23)
Just looking at the price differences for the same runtime environment on a cloud environment when choosing different payment options (e.g., up-front or on-demand) shows that there is no direct correlation between price and resource use.
The SCI specification combines the carbon emissions of all components and transactions of a software system into a single rate value. The advantage of this approach is the simplicity of the result but it makes it difficult to understand the carbon emissions of specific transactions or components of a system.
As an alternative approach, the Green Software Measurement Model (GSMM) [4] attempts to describe a reference model for assessing the resource and energy efficiency of software products and components. GSMM focuses mainly on the individual components of a software system, without considering their interrelationships while processing individual units of work (e.g., transactions). Therefore, the authors [4] also note that the current GSMM methods are not fully applicable to complex architectures or distributed systems.
Measuring or calculating [6] the resource demands (i.e., CPU, memory, storage, network) of software systems is common in the software performance engineering community, as such data is required for capacity planning and performance modeling techniques. We propose to use the same data to quantify the emissions of a software system on a given runtime environment.
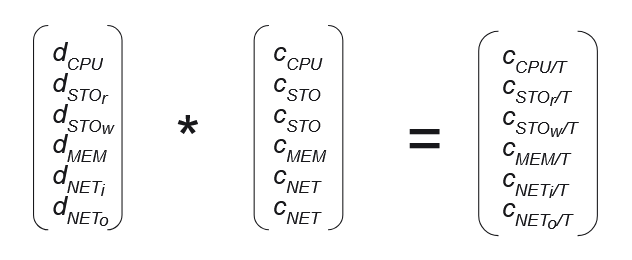
Figure 2: Calculating Carbon Emissions per Transaction
Resource profiles contain resource demands for the following resource types: CPU (dCPU ), storage (differentiated by read dSTOr and write dSTOw operations), memory (dMEM ), and network (differentiated by incoming dNETi and outgoing dNETo traffic).
For this calculation we need to be able to quantify the carbon emissions (c) of the different resource types (CPU: cCPU ,storage: cSTO , memory: cMEM , network: cNET ) in the same unit as the resource demand is stored in the vector. For CPU, we need to know how much carbon is emitted when a core is running at a certain utilisation level; for memory, the carbon emissions for a given size (e.g., GB); and for storage and network, how much carbon is emitted when a given amount of data is processed.
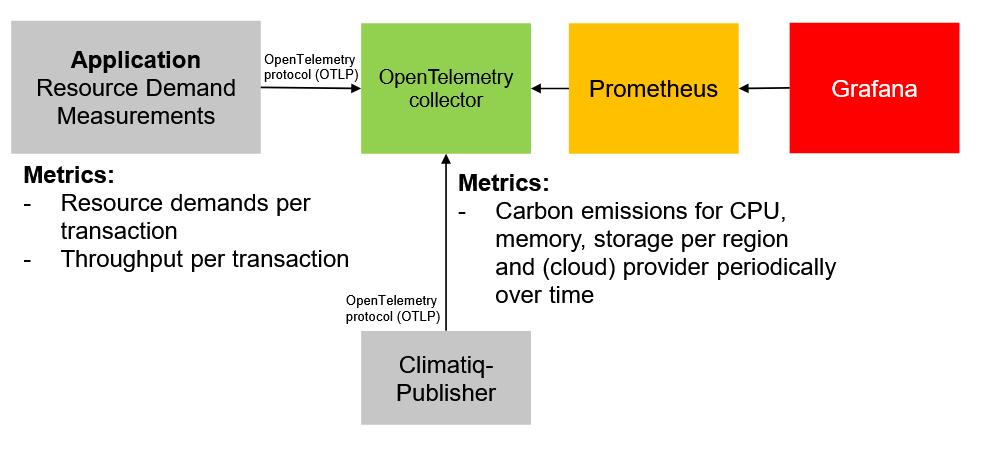
Figure 3: Prototype Architecture
We are using OpenTelemetry3 as a standard for transferring the required metrics from the application and climatiq to Prometheus4 as a time series database. We need to store both sets of data (resource demand and emission data) correlated by time as emissions vary over time depending on the amount of green energy used to power the runtime environment (e.g., lack of solar power at night). Grafana5 is used to visualize the results of this calculation to show the carbon emissions per transaction as well as per server, container, or virtual machine involved in processing a transaction over time.