ICT Sector Guidance built on the GHG Protocol Product Life Cycle Accounting and Reporting Standard
Status:: 🟩
Links:: GHG Protocol
Metadata
Authors:: Carbon Trust, ; Global e-Sustainability Initiative,
Title:: ICT Sector Guidance built on the GHG Protocol Product Life Cycle Accounting and Reporting Standard
Date:: 2017
URL:: https://ghgprotocol.org/guidance-built-ghg-protocol
DOI::
Carbon Trust, & Global e-Sustainability Initiative. (2017). ICT Sector Guidance built on the GHG Protocol Product Life Cycle Accounting and Reporting Standard. World Resources Institute. https://ghgprotocol.org/guidance-built-ghg-protocol
This ICT Sector Guidance provides guidance and accounting methods for the calculation of GHG (greenhouse gas) emissions for ICT (Information and Communication Technology) products with a focus on ICT services. This ICT Sector Guidance is built on, and in conformance with, the GHG Protocol Product Standard.
Notes & Annotations
Color-coded highlighting system used for annotations
📑 Annotations (imported on 2024-03-11#11:58:06)
The purpose of this Sector Guidance, which is in conformance with the Product Standard, is to provide additional guidance to practitioners who are implementing the Product Standard for ICT products (including ICT services). This Sector Guidance follows a life cycle approach to the assessment of ICT products (including services).
As with the Product Standard, this ICT Sector Guidance is not intended to support product comparisons.
The Product Standard does not address accounting of avoided emissions, however it was considered important to include in this ICT Sector Guidance a methodology for assessing the avoided emissions caused by the enabling effect of ICT, because of the significant potential that ICT has in this area. As this methodology is different from that for assessing products, it will be included in the Transport Substitution Chapter as a separate appendix
ICT Product Emissions
The life cycle emissions of the ICT solution that is causing the enabling effect.
Enabling Effects
The avoided emissions due to the activities avoided as a result of using the ICT solution. These are further subdivided into immediate enabling effects and longer-term enabling effects.
Rebound Effects
The increased emissions as a result of using the ICT solution, caused by rebound effects. These rebound effects may be caused by related consequential effects or by unrelated (and sometimes unintended) effects and are often related to human behavioral changes. These effects are further subdivided into immediate rebound effects and longer-term rebound effects. Because of the nature of rebound effects, assessing them is inherently uncertain as it is difficult to accurately estimate the effects.
For ICT products (including services) the following are typical goals, which this Guidance aims to address:
- Understand emissions through the life cycle of the product, and where in the life cycle the majority of the emissions occur (e.g., understand the proportion of embodied to in-use emissions). This can help to direct efforts to reduce emissions of the product such as:
- Reduction of emissions due to changes in the design of the product
- Reduction of emissions due to changes in the manufacture of a good, or provision of a service
- Reduction of emissions in the use stage of a product
- Reduction of emissions in response to behavioral changes in the use of the product.
- Track changes over time, to monitor the impact of product enhancements and new versions of products.
- Respond to customer questions on the GHG emissions of the product offering.
- Public reporting on the GHG emissions of a product (this is required to conform with the Product Standard).
No air travel was involved in the making of this Guidance, with all meetings being held remotely using online collaborative working tools.
Software has a significant impact on the energy used by ICT hardware (because of both the operating system and the applications). Thus designing software for energy efficiency can reduce the GHG emissions of ICT products (including services).
The term “embodied emissions” used in this Guidance combines the emissions from the following life cycle stages: raw material acquisition and preprocessing, production, distribution and transport, installation (by which is meant service deployment and build), and end-of-life treatment (i.e., all life cycle stages other than the use stage). This categorization is for simplicity of reporting, because for many ICT products the use stage is responsible for the majority of the emissions, thus the term “embodied emissions” is often used to refer to all the emissions other than those from the use stage.
The functional unit is the quantified performance of the product being assessed, and is used as the reference unit against which the product is measured.
The definition of the functional unit should consider the following three parameters:
- The magnitude or quantity of the function that the product fulfills
- The duration or service life (the time required to fulfill the function)
- The expected quality level provided by the product
For ICT products, data collection usually relates to collecting activity data and emission factors, (the alternative being to directly measure the emissions released from a process). Activity data is the quantitative measure of a level of activity that results in GHG emissions. Activity data can be measured, modeled, or calculated. For ICT products it is often necessary to use modeling techniques (e.g., based on sampling methods) when collecting activity data.
Because of the complex nature of ICT products, it may sometimes not be possible to obtain primary data outside the reporting companies’ ownership or control or it may not be cost effective to collect the data, and therefore data gaps may exist. The Product Standard specifies what may be done to fill data gaps, where primary or secondary data cannot be obtained that are sufficiently representative (in order of preference):
- Use proxy data
- Use estimated data
Allocation refers to the partitioning of emissions among products where more than one product shares a common process.
Allocation of emissions among independent products that share the same process: for example, multiple products sharing the same transport process (vehicle); multiple telecommunication services sharing the same network; multiple cloud services (email, data storage, database applications) sharing the same data center.
The general approach for calculating GHG inventory is to multiply the activity data by the appropriate emission factor:
Activity data refers to the quantified measure of an activity that gives rise to GHG emissions. It can refer to the quantity of a physical material or substance, or to the amount of activity.
For many ICT goods and services, the use stage dominates the total emissions. Use stage emissions are primarily caused by the ICT hardware’s use of electricity.
Overhead energy is typically the energy used for cooling the ICT equipment, but may also include heating of the building, diesel fuel used for generators, energy used in backup systems such as UPS (uninterruptible power supply) and ICT infrastructure. The preferred approach is to calculate the total overhead energy and then allocate a proportion based on a usage factor; an alternative approach is to multiply the energy used by a power usage effectiveness (PUE) ratio.
The emission factor for the electricity used should be appropriate for the region where the electricity is consumed. Electricity grid emission factors are published on a national basis, and in some cases on a regional basis. Because of the potential high impact on the result, it is important to ensure the most up-todate emission factors are used.
The Scope 2 Guidance defines two methods for determining emission factors: the location-based method, which reflects average emissions of the grids where the emissions occur (typically using grid-average emission factors); and the market-based method, which reflects the emissions of the electricity purchased (using emission factors derived from contractual instruments).
For the use stage, both energy consumed (kWh) and equivalent GHG emissions (kg CO2e) should be reported. The electricity emission factor(s) used should be clearly stated.
For ICT products that have an enabling effect, the “avoided emissions” shall not be included in the product’s total inventory results, but should be reported separately.
It is well understood within the industry that a data center uses more input energy than it delivers to the IT equipment. The resulting energy overhead is because of the data center mechanical and electrical (M&E) infrastructure, and is commonly measured with the metric power usage effectiveness (PUE), which represents the ratio between the total facility power and the IT equipment power. This energy overhead (or non-IT energy) includes the energy used by cooling systems, and power-delivery components such as the uninterruptible power supply (UPS), switch gear, generators, and batteries.
Depending on the service being assessed and the allocation method being used, the following data may be required:
- Users: use profiles and number of users at any given period of time
- Licensing or service level agreements: the units of service defined, for example, the number of users for a specified period of time
- Transactions: for example, measured Iops (input-output operations per second) or WebAPIs/requests processed by the platform, over a specified time period
- Data centers: number and location
- Server count: number of servers provisioned to host and fulfill the cloud application and data storage requirements. This includes redundancy for business continuity and disaster recovery
- Network link equipment count: number of in-data-center routers and switches required to fulfill WebAPI requests and process web transactions. This includes redundancy for business continuity and disaster recovery
- Device utilization: computational load that a device is managing relative to the specified peak load
- Power consumption per type of IT hardware: calculated energy consumed by a server at a given rate of device utilization and estimated power for networking and storage equipment
- Data center power usage effectiveness (PUE): defined as the ratio of overall power drawn by the data center facility, to the power delivered to the IT hardware. This is a data-center-specific metric and accounts for energy consumption of active cooling, power conditioning, lighting, and other critical data center infrastructure.
- Emission factors – equipment: factors for the embodied emissions of relevant IT equipment, ideally obtained from equipment manufacturers. See also the Hardware Chapter for methods of calculating and estimating these.
- Emission factors – electricity: the emission factor for the electricity used should be appropriate for the region where the electricity is consumed. Electricity grid emission factors are published nationally, and in some cases, regionally. Electricity grid emission factors should include the full life cycle of the energy source (i.e., include emissions from extraction and transportation of the fuel, as well as generation and transmission of electricity).
If primary data is not available, secondary data and/or assumptions may be developed for processes that are not under the ownership or control of the reporting company. These might include:
- Internet transfer: secondary data on access and core network usage (see Section 4.7.4 “Calculating network emissions,” and also the Telecommunications Network Services Chapter for more details)
- Embodied emissions for hardware: estimates of embodied emissions per server
One characteristic, common to many but not all IH products, is the significance of the use stage in the total life cycle GHG emissions. Therefore, the estimated magnitude of the use stage, in the absence of more detailed life cycle analyses, can provide an approximate estimation of the other life cycle stages. The emphasis on the use stage makes this method most relevant for products with a long operating time. However, if the manufacturing stage (or embodied) emissions are significantly more important, then ratios based on that stage may be applicable.
For small ICT devices that are designed for consumers (e.g., PCs, printers, IP phones, cable modems), and have a relatively short operating life, servicing resources (materials and personnel) are typically small and account for insignificant GHG emissions.
Example life cycle stage ratios were compiled from published ICT life cycle assessments such as E. Fryer, “Evaluating the Carbon Impact of ICT: The Answer to Life, the Universe and Everything: Understanding the Limitations of LCA Based Carbon Footprinting Methodologies,” Intellect, UK, (August 2012): p.16, and others.
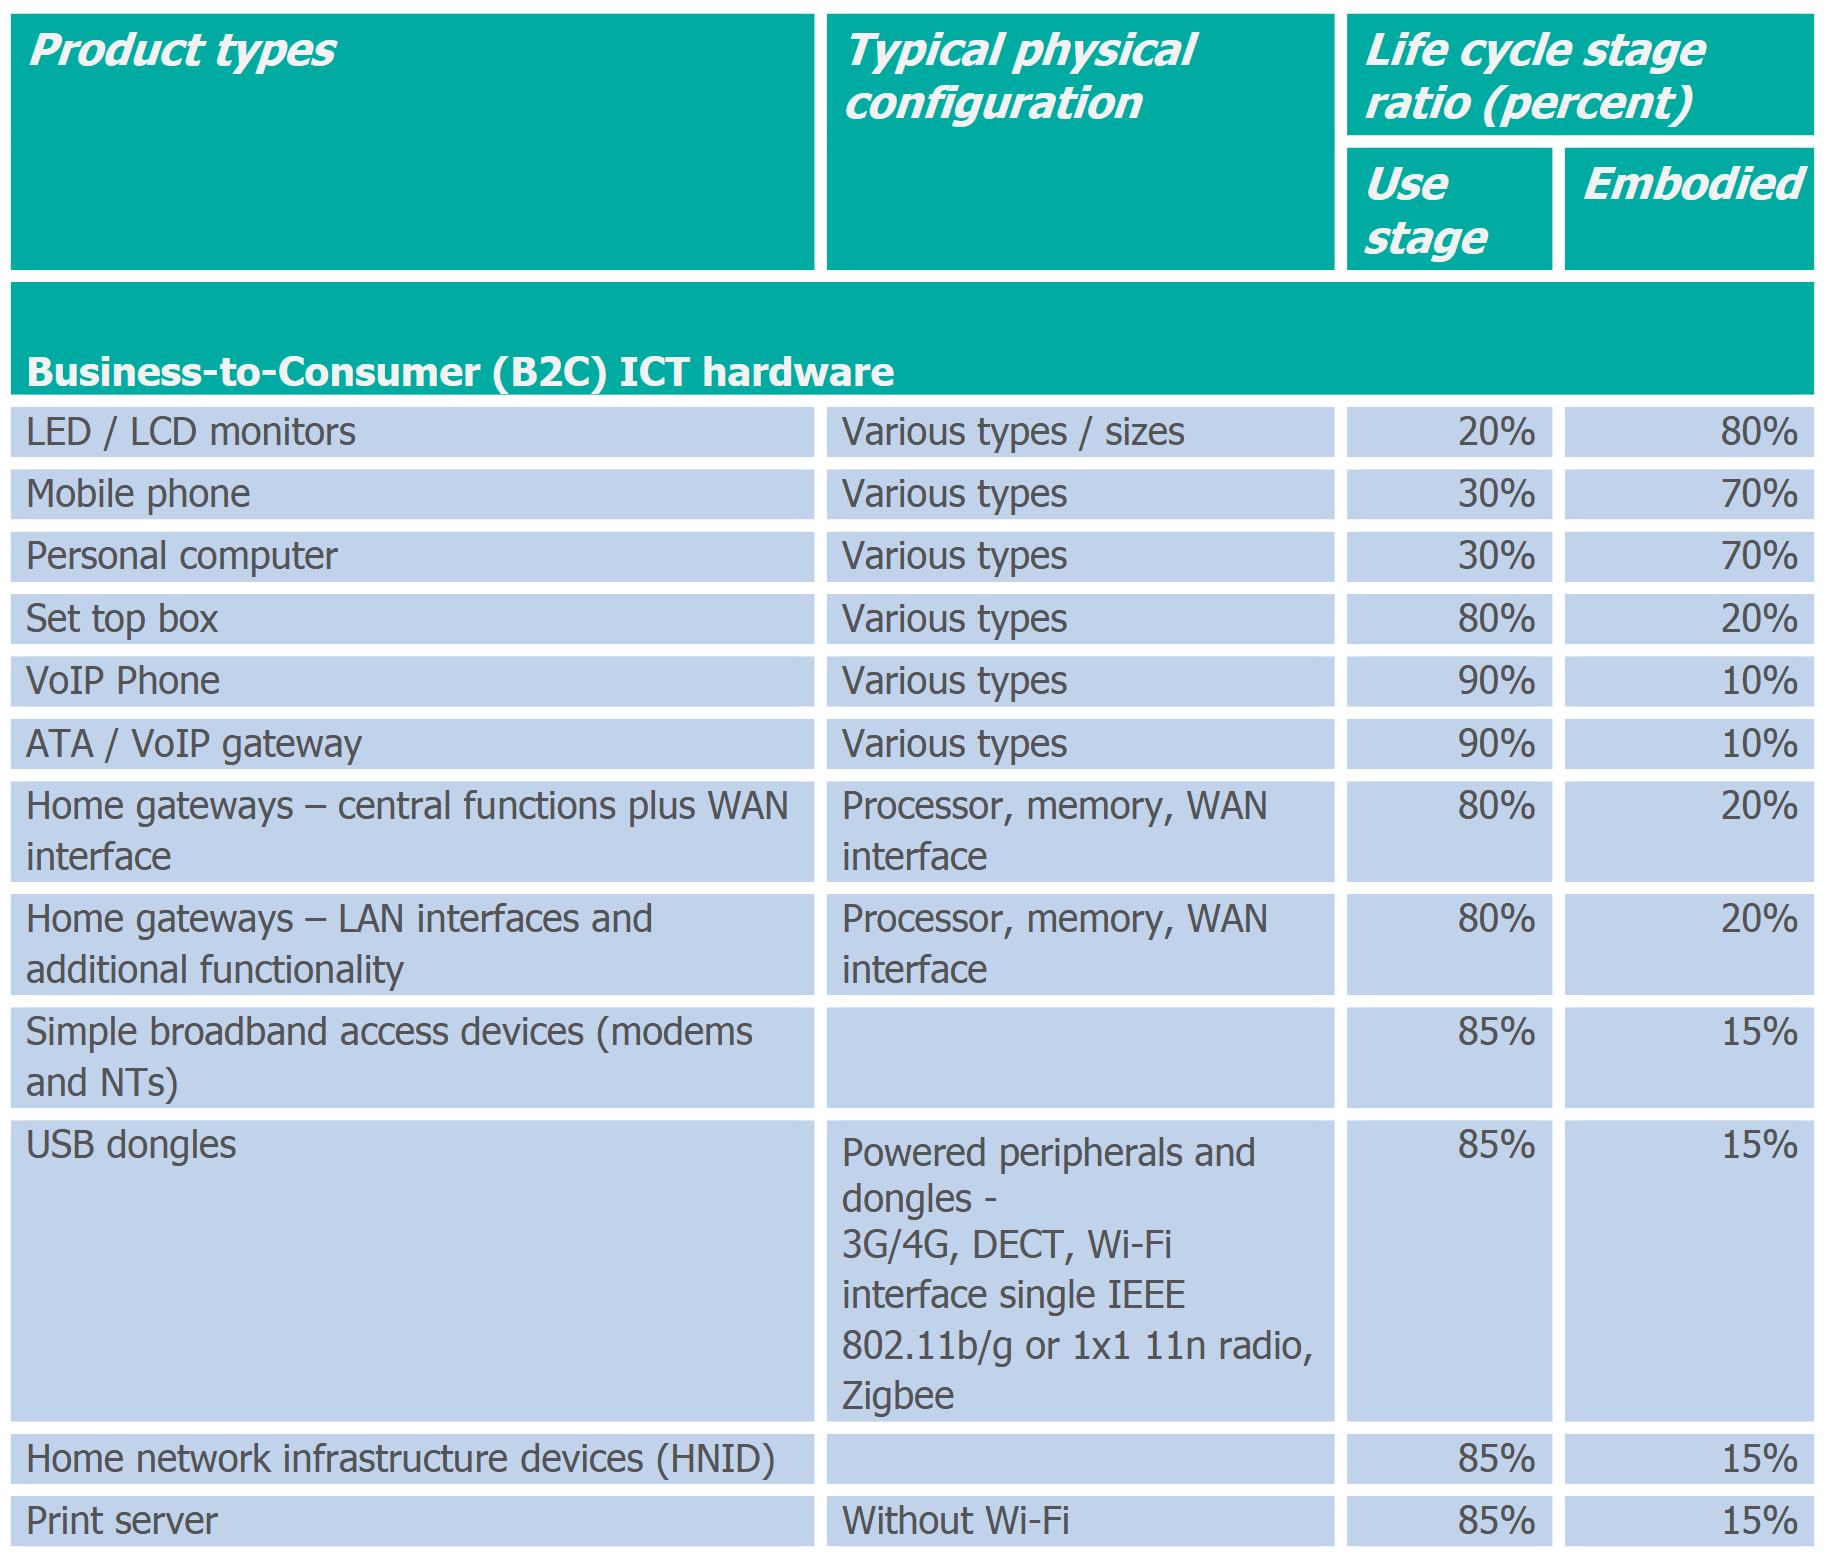
Examples of business-to-consumer ICT hardware life cycle stage ratio profiles
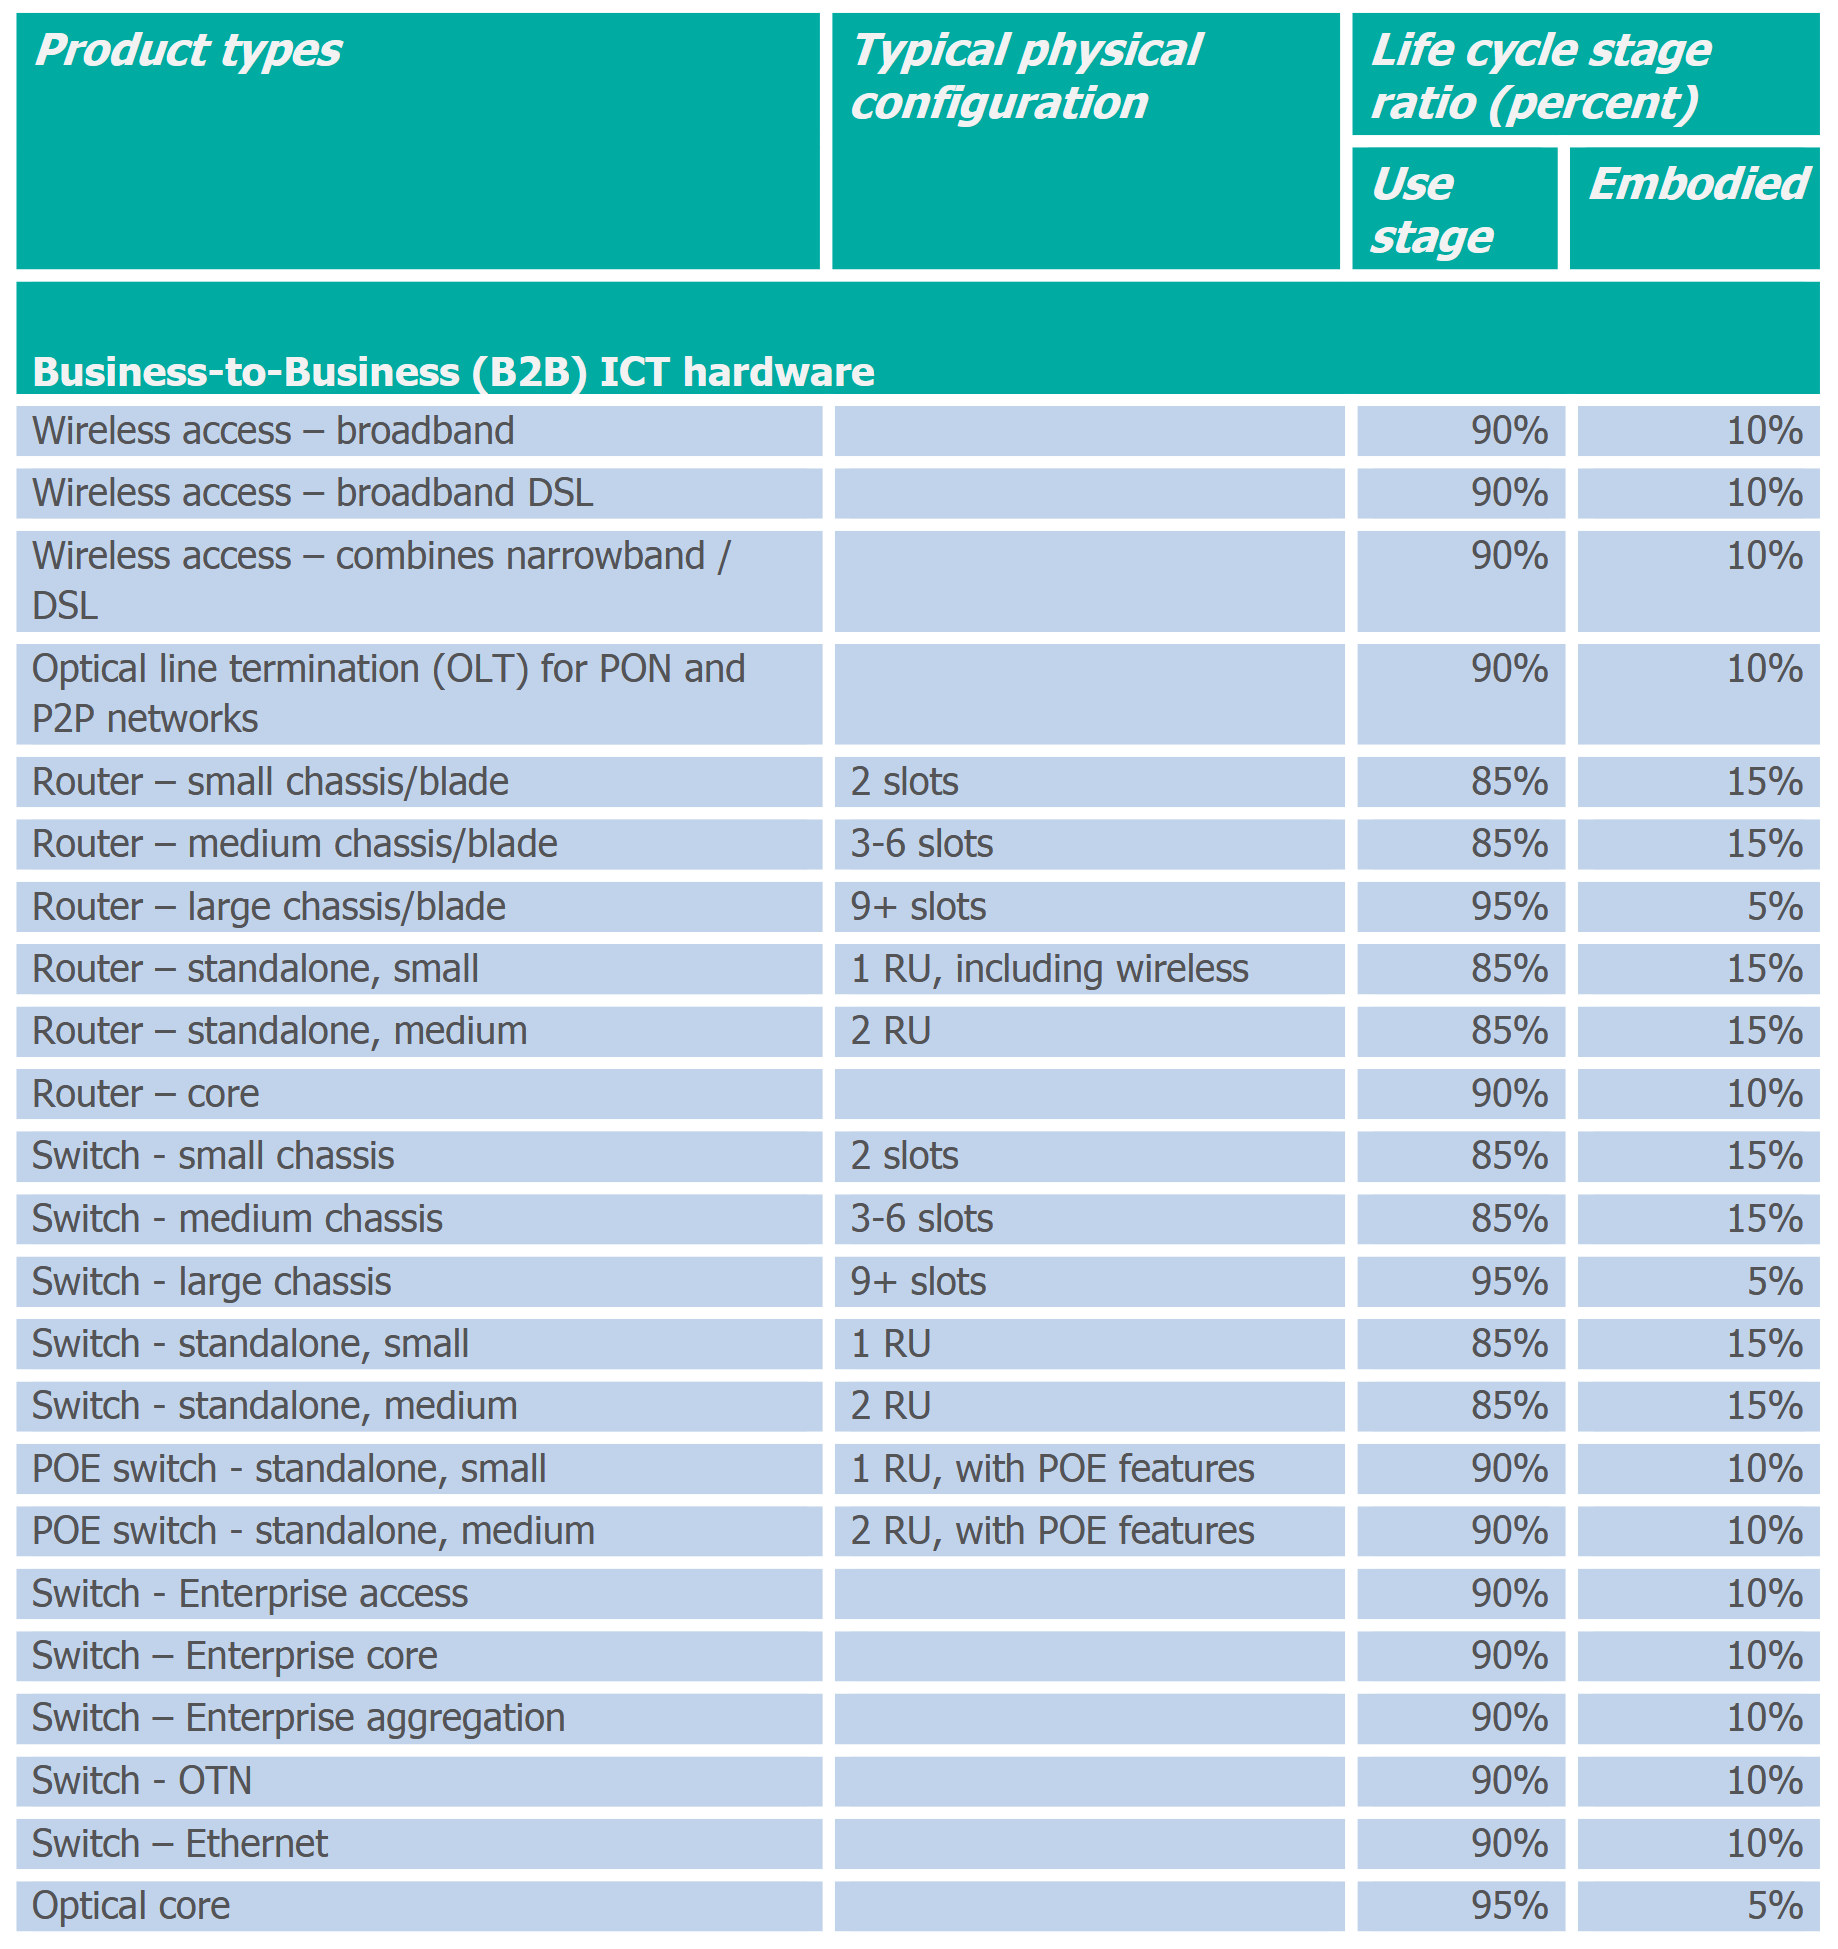
Examples of business-to-business ICT hardware life cycle stage ratio profiles
Most of the energy consumed by ICT hardware can be attributed to its application software. Because the design of software significantly impacts the amount of energy used, software designers should understand how their software uses energy. Only then can they design software with efficient energy use. Software design can reduce energy use by optimizing central processing unit (CPU) usage; the disk input/output (IO) usage; remote calls such as database calls, and web accesses.
In most cases, the “embodied emissions” (all stages excluding the use stage) of software are not significant compared with the overall emissions of the ICT system, particularly when the embodied emissions caused by development of the software are amortized over a large number of copies. In these cases, it is not necessary to carry out a detailed life cycle assessment of the software as part of a wider system.
Software use and design directly affect the power consumption of a device. Computer devices are commonly built from different components such as a CPU, memory, and input and output devices. Each component is designed to process information at variable rates according to supply and demand, defined as the “utilization rate.” The utilization rate is usually directly correlated to power consumption. Therefore, each component consumes different amounts of power according to the task being undertaken, which is controlled by software.
Calculating the power consumption of software, requires consideration of these three software types:
- OS: The software needed to run the hardware and applications. The methodologies allow users of this guidance to calculate the power used by the OS, which acts as the baseline from which to calculate the impact of applications. If OS power consumption is not known, it should be measured according to Section 6.5 “OS measurement.”
- Applications: The optional application(s) used to achieve a defined task, including OS-integrated applications.
- Virtualization: Software used to create multiple OS instances within one physical device. The methodology assesses the total power consumption of a single VM running on a host computer. The sections on operating systems and applications provide guidance for the allocation of power consumption to applications running inside the VM.
Part B considers only the energy consumed by the use of software, and does not include the embodied emissions of the device on which the software is running. The methodology assesses the run-time power consumption, excluding power used in software or hardware production or end-of-life activities. Part B does not take into account the processes used to create, distribute, or remove the software from a device.
An idle energy measurement test should be carried out for studies that are not analyzing the impact of power management settings.
Measure the idle power for 30 minutes at least three times and note the average power consumption (e.g., five watts) for each test. The power measurements should be analyzed for in-test high variations (greater than ±15 percent). If either in-test power variation or high variations between tests are recorded, check the OS for nonidle processes that run automatically in the background.
For each test period, record the energy consumption (kilowatt hours [kWh]). This is commonly calculated by the measurement device (in watt hours [Wh] or joules [J]). If it is not recorded, energy consumption can be calculated by multiplying the average power consumption by the test’s time period.
To assess the impact of power management, measure the various power states that the device can be put into.
Application energy consumption can be reported for a single application or for a set of applications. Measuring a set of applications reflects a realistic use case of software. When reporting a set of applications, report the power consumption for the set, rather than for one application.
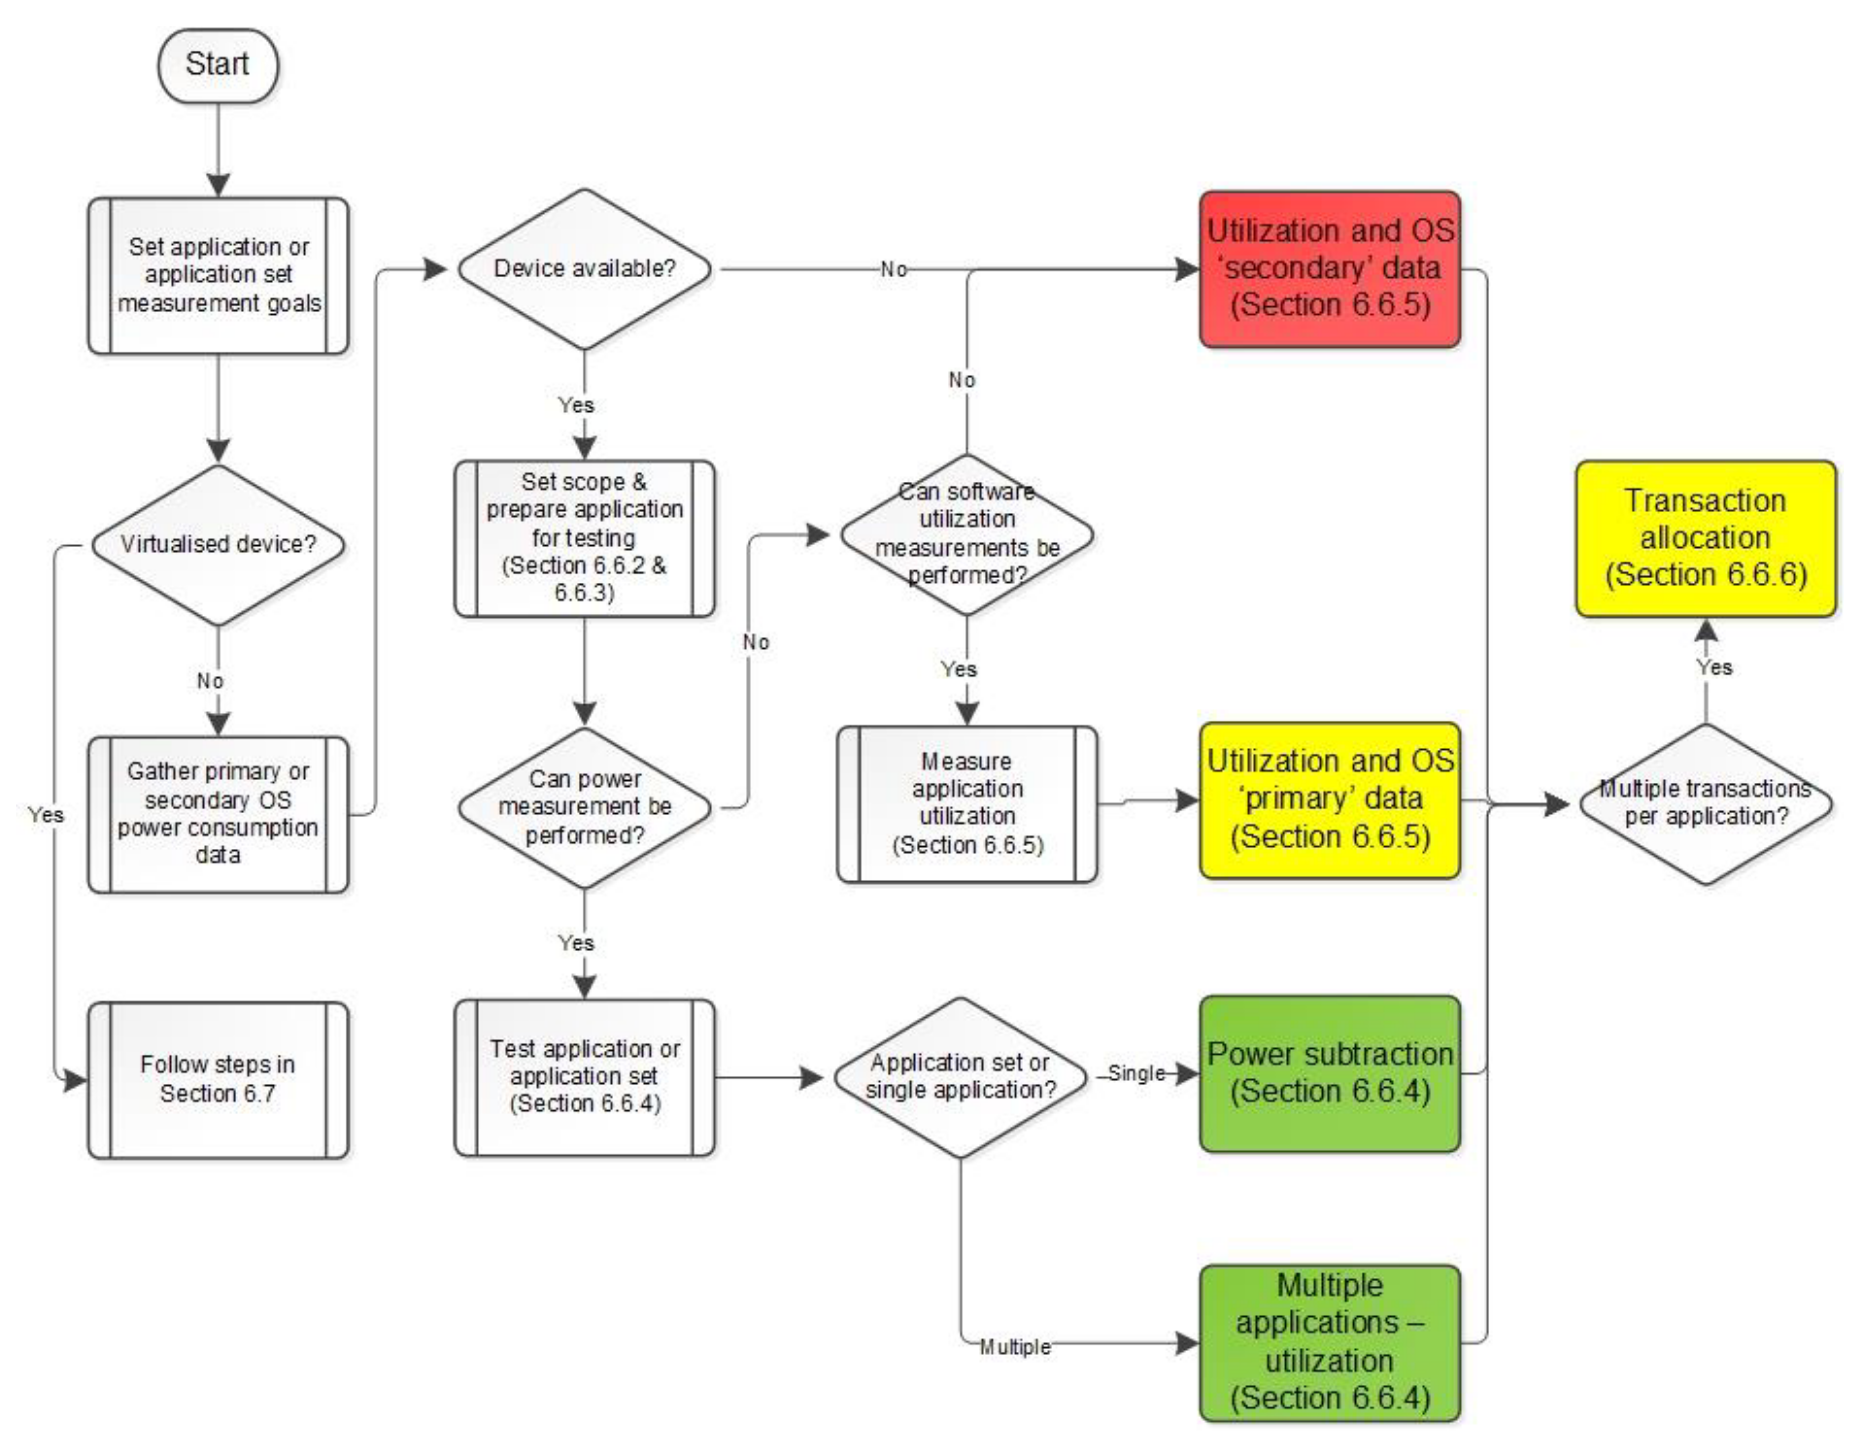
Application measurement selection process
The power consumption of the networking equipment should be taken into account if a remote device is used. It can be calculated using the guidance in the Telecommunications Network Services Chapter.
The overall energy consumption recorded in the testing process is a combination of the energy used by the OS and the application(s). The power subtraction method can be used to separate the energy use of the OS from that of the application or application set.
Use the following equation to separate overall energy consumption from the application or application set and OS:
Where
The “utilization value” is the percentage of a device’s resources being consumed by an application.
To assess Application 1’s energy consumption, first calculate the total processor utilization across all applications (e.g., 60 + 8 = 68%). Next, calculate the required application’s overall % of the measured processor utilization (e.g., for Application 1, 60/68 = 88 %). The utilization value (U) for application 1 is thus 88% which can be used in the following equation to calculate proportional energy consumption for application 1.
Many VMs (thousands) can run simultaneously on one server; therefore, a part of the power consumption of the entire server should be allocated to each VM. While the host device’s power consumption can be empirically measured, the allocation of power consumption to a particular VM requires calculation.
Resource utilization can be measured dynamically within the virtualized device, or can be a static estimate of average use. The total power consumption of the host device depends on the utilization of the host device resources by each VM. Therefore, information about the levels of resource utilization by each VM is required to allocate power consumption to a VM. Dynamic measurement is preferred because of the high variation common in a virtualized device. The more accurate the estimate of resource use, the more certain the result.
A static-useprofileis an informed guess or average measured value of likely utilization of a device’s resources relative to its capabilities. It represents the simplest and quickest process; data center operators can typically provide such estimates. Hardware vendors may also be able to characterize expected resource utilization depending on utilization of the server hardware components.
A dynamic-useprofilecan be either a direct monitoring of device activity or based on a measurement of likely VM behavior, such as application load test cases or network traffic traces. A dynamic profile is essential for performing empirical device power consumption measurements.
A test profile can either represent a real workload or a synthetic workload composed of smaller units of work. Ideally, the typical application profile of a VM will match historical use. An assessment of VM power consumption based on a representative test profile will reduce uncertainty associated with the results. In some cases instead of developing a custom test profile it is recommended using an existing profile that closely matches the anticipated VM application. For web applications, popular test profiles are provided by organizations such as the Transaction Processing Performance Council, the Standard Performance Evaluation Corporation (SPEC), and the Storage Performance Council.
When sourcing secondary data, it should be based on a close match to the device’s hardware. Important hardware configuration aspects that impact power consumption are: the number and type of CPUs, the amount and type of installed memory, the number and make of hard disks and network controllers, the mainboard model, and the model and number of power supply units.
A precise correlation of utilization of components to overall system power is specific to the server configuration in hardware and software. For the purpose of this assessment, and accepting significant levels of uncertainty, CPU load can be used as a proxy for overall device utilization. If possible in a specific context, the weighted influence of other components can be included in the utilization value, provided the assumptions leading to the adoption of such weightings are documented.
A dynamic VM resource utilization measurement provides a more accurate assessment of per-VM power consumption. Such an assessment allocates power consumption of the host device to individual VMs based on their share of utilization of the hardware components. This assessment requires measuring each VM’s level of utilization of device components over time and relating that to the total power consumption of the device. This data can then be used with the equations in Methods 2a and 2b to gain more precise results. A benefit of using dynamic rather than static values is that they measure the variation of power consumption over time. For example, a VM could be analyzed per second or a set of VMs could be assessed every minute for eight hours per component. For server systems, the most important components regarding power consumption are the CPU, the memory and communication bus on the mainboard, the hard disk, and the network interfaces.