Investigating the inconsistencies among energy and energy intensity estimates of the internet
Status:: 🟩
Links:: Energy consumption of network communication
Metadata
Authors:: Coroama, Vlad
Title:: Investigating the inconsistencies among energy and energy intensity estimates of the internet
Date:: 2021
URL:: https://vs.inf.ethz.ch/publ/papers/Coroama2021_InternetEnergy.pdf
DOI::
Coroama, V. (2021) Investigating the inconsistencies among energy and energy intensity estimates of the internet. Swiss Federal Office of Energy SFOE. Available at: https://vs.inf.ethz.ch/publ/papers/Coroama2021_InternetEnergy.pdf.
The report performs an in-depth analysis of estimates of the energy intensity (EI) and the overall energy (E) consumption of the Internet. The two values should be connected via the overall Internet traffic (T), as multiplying EI by T should yield E. This identity, however, is not satisfied by the existing assessments today; on the contrary, the results obtained via the two methods lie a factor of 5-26 apart. The study identifies two important sources for this inconsistency: the different treatment of access networks (ANs), and the inherent biases towards overestimates and underestimates that seem to reside within top-down and bottom-up modelling, respectively. Considering the wide-area network (WAN), fixed access networks (FANs), and radio access networks (RANs) individually, the study shows that, rather surprisingly, the largest discrepancies do not stem from the fairly recent and quite heterogeneous RANs, but from the well-established WAN.
Notes & Annotations
Color-coded highlighting system used for annotations
📑 Annotations (imported on 2025-08-08#11:48:16)
The energy intensity of the Internet (EI) has been addressed in several studies, such as (Schien et al. 2013; Coroama et al. 2013). For fixed access networks, the current academic state-of-the-art indicates an average energy intensity of 0.007 kWh/GB for 2020 (Aslan et al. 2018). For the energy consumption of networks as a whole, on the other hand, there is some divergence in the academic literature, ranging from 325 TWh yearly (Malmodin and Lundén 2018) to 723 TWh (Andrae and Edler 2015).
According to (Cisco 2020), the worldwide Internet data traffic for 2020 was around 254 EB/month, corresponding to 3048 EB (or 3.05 zettabytes, ZB) yearly. Multiplying this value by the 0.007 kWh/GB from (Aslan et al. 2018) would yield an annual energy consumption of only 21.3 TWh/year, one order of magnitude below the low end of current estimates for the overall energy consumption of the Internet from (Malmodin and Lundén 2018).
In line with most of the literature, e.g. (Baliga et al. 2009; 2011; Coroama and Hilty 2014; Coroama et al. 2015; Schien et al. 2015; Wu, Ryan, and Smith 2019), we consider the following high-level topology of the Internet, as presented in Figure 3: data are usually transmitted from data centres (DCs) to end devices (sometimes also called end-user devices) via the network. The network consists of the widearea network (WAN), which is “a network spanning a region, country or the globe [...] comprising a diverse range of telecommunication networks” (Ryan, Smith, and Wu 2019).
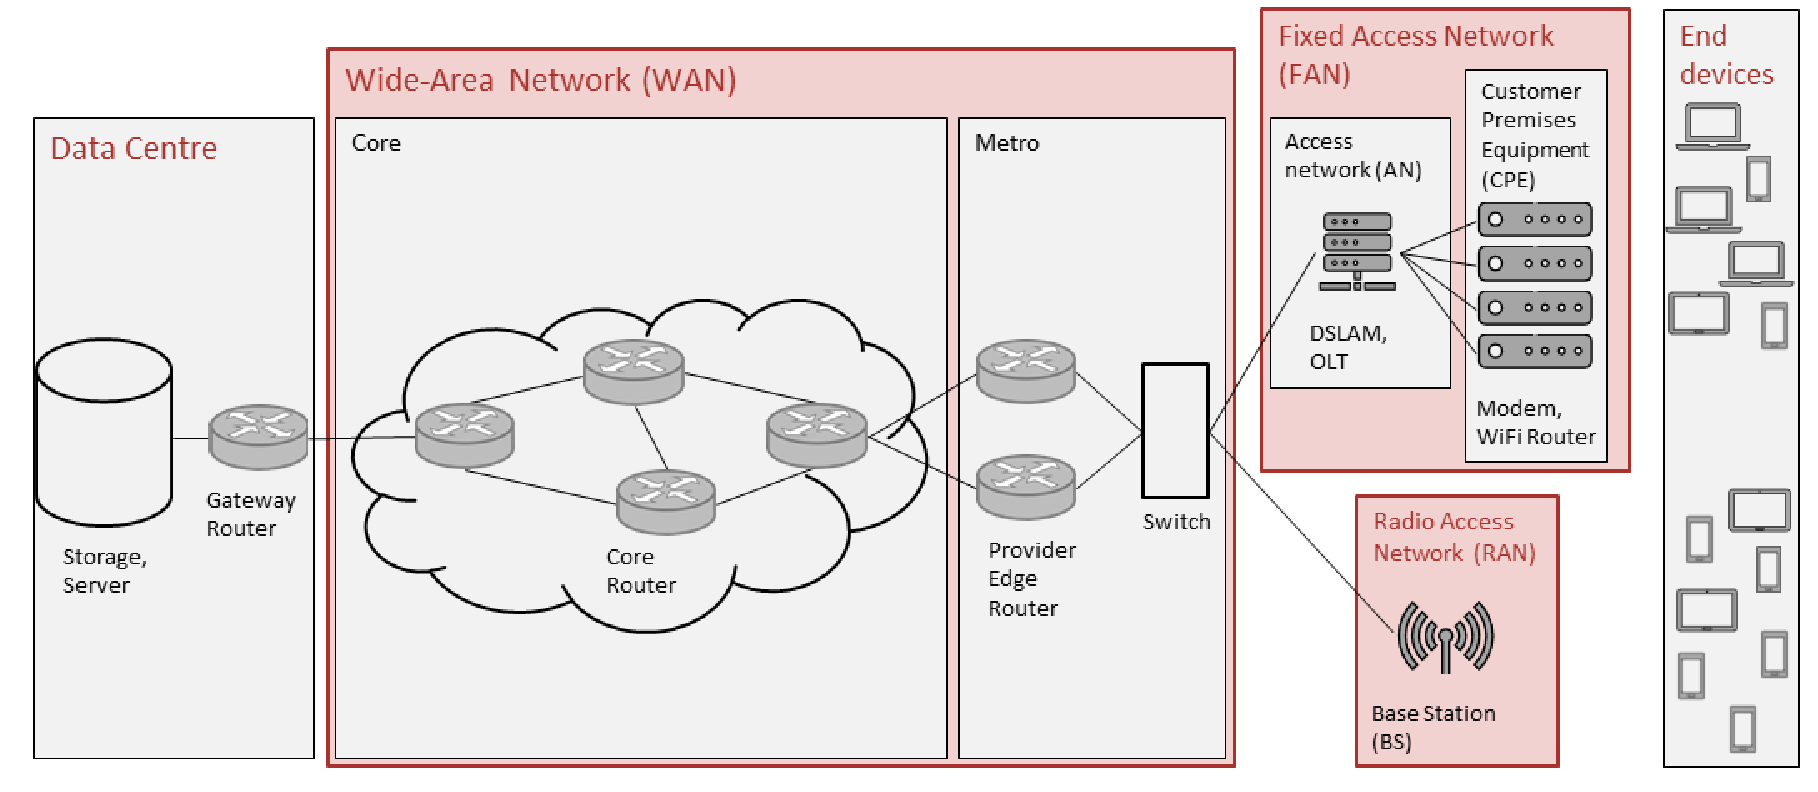
Figure 3 High-level topology of the Internet, distinguishing between data centres (DCs), end devices, and three distinct types of the network: the wide-area network (WAN), fixed access network (FAN), and radio access network (RAN).
Our main interest lies in the numbers of today (i.e., 2020). We will, however, also consider studies referring to the last decade, 2010-2019, for three reasons: First, many of the ubiquitously cited and sometimes also societally discussed studies are already a couple of years old and still very relevant. Second, trends are at least as important as today’s numbers, and to understand trends some historic perspective is important (albeit not a too long one, as discussed above). Finally, the authors themselves often make predictions that reach to today and beyond.
As stated in the Introduction, the study by (Aslan et al. 2018) is the current state of the art of the academic understanding on the energy intensity of the WAN. Extrapolating exponential past trends (up to 2017) via least squares fit yields a value of around EI2019 (WAN) = 0.01 kWh/GB and EI2020 (WAN) = 0.007 kWh/GB. The study does not address the energy intensities of either FAN or RAN.
(Pihkola et al. 2018) also extrapolate their 2010-2017 results into the future, devising an energy intensity of just below EI2020 (RAN) = 0.1 kWh/GB.
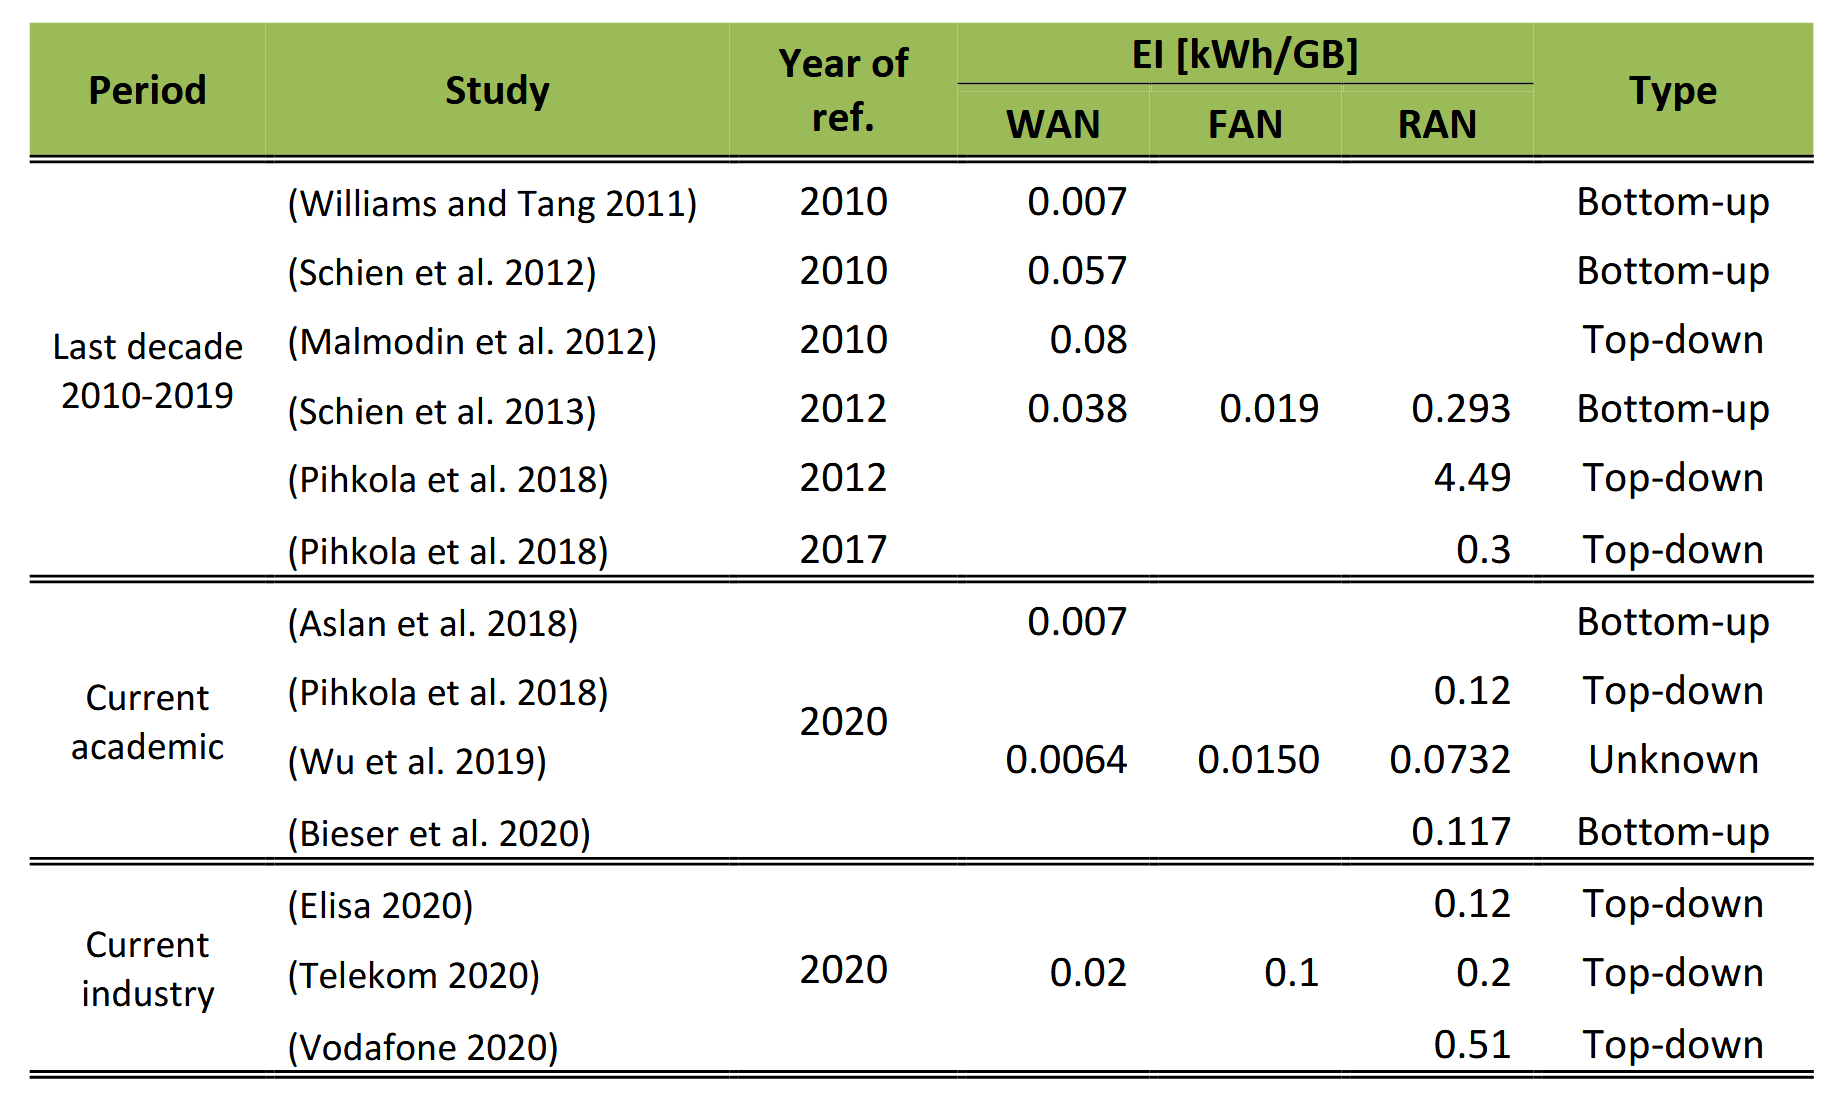
Table 1 Summary of existing estimates for EI (WAN), EI (FAN), and EI (RAN) for the last decade (2010 – 2019) and for today (2021).
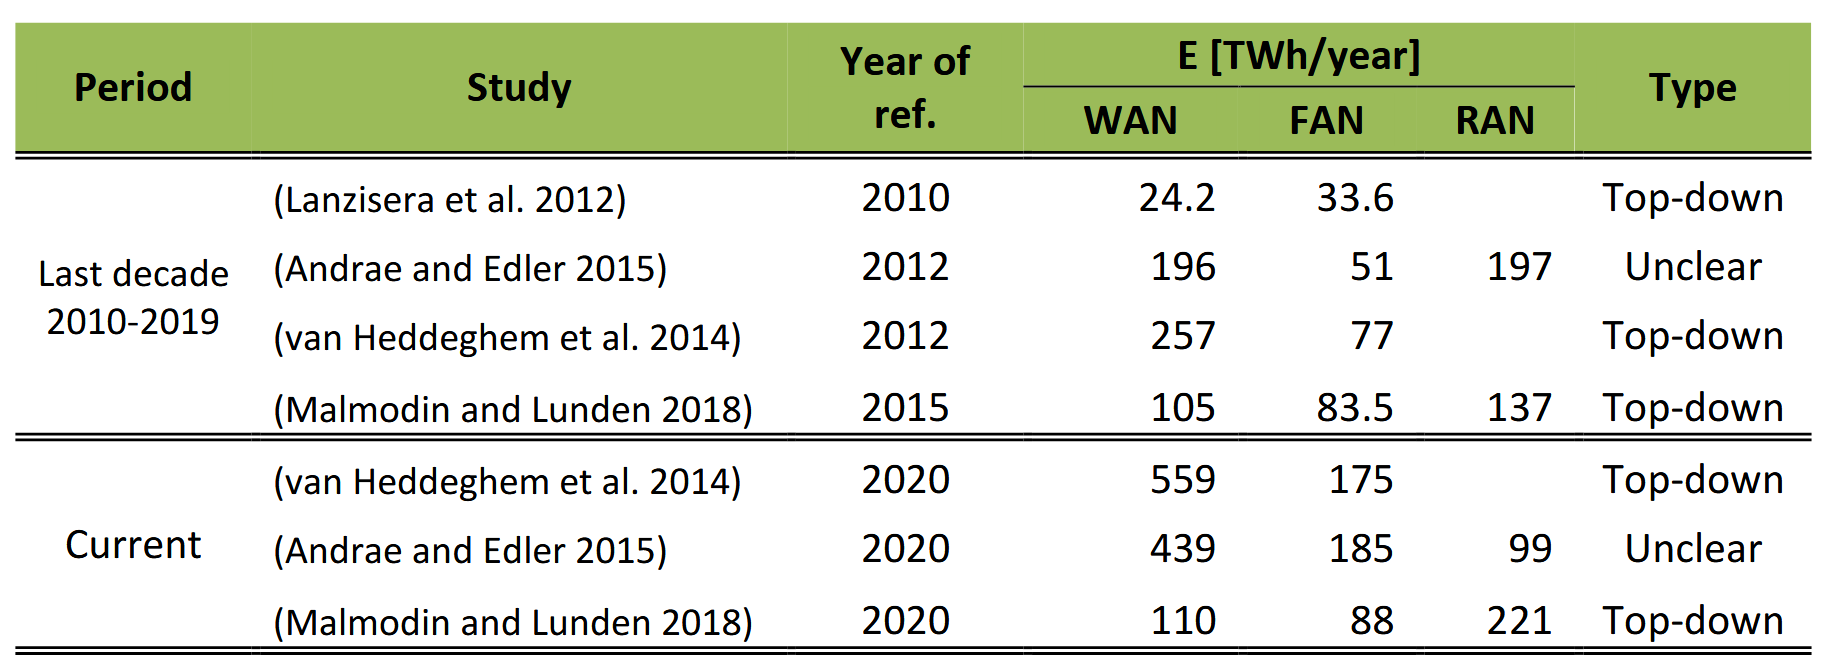
Table 2 Summary of existing estimates for the overall E (WAN), E (FAN), and E (RAN) for the last decade (2010 – 2019) and for today (2021).
As can be observed in the overview given by Table 1, the energy intensity of the AN is higher than that of the WAN. This is particularly valid for the RAN, for which current state-of-the-art estimates range around 0.12 – 0.2 kWh/GB (Pihkola et al. 2018; Wu, Ryan, and Smith 2019; Bieser et al. 2020; Elisa 2020; Telekom 2020) as compared to the 0.006 – 0.007 kWh/GB for the WAN (Wu, Ryan, and Smith 2019; Aslan et al. 2018); a factor of about 20 more.
With the wide adoption of the much more energy efficient (NGMN Alliance 2015; FernándezFernández, Cervelló-Pastor, and Ochoa-Aday 2017; Gourhant and Tuffin 2020, 5; Nokia 2020) 5G radio, RANs might ultimately become more energy efficient than FANs (Wu, Ryan, and Smith 2019). They will both, however, remain most likely less energy efficient than the WAN.
Additionally, with sharply increasing data transfers worldwide, the trend of mirroring content at the provider edge is likely to continue. In particular popular content such as the newest episodes of trending series or recent software updates are likely to be delivered not across the core network, but from CDNs, edge servers of the ISP, or servers of content providers collocated at edge sites of ISPs. This will contribute to a further increase of the energy efficiency (and thus the decrease of the energy intensity) of the WAN, which for an increasing portion of the traffic will consist only of few edge and/or metro routers.
Not considering the AN can lead to estimates such as (Aslan et al. 2018), which are then easily and often misinterpreted as ‘the energy intensity of the Internet’ and can lead to massive understatements such as the 21.3 TWh/year we computed according to Equation (6).
due to the sheer complexity of the networks, their topologies and the plethora of equipment involved, bottom-up modelling might be inherently bound to ignore parts of the network, set its system boundaries to narrow and thus contain an inherent bias towards underestimates.
We further argue that EIᵧ(FAN) should include not only the street-level part of the access network, but also the CPE (i.e., essentially Wi-Fi routers nowadays). Although the CPE is located within the customers’ premises, it is equipment used to deliver the Internet and thus semantically belongs to the network, not to end-user devices. An additional argument is that if CPE is not modelled as part of FAN, comparative assessments of EIᵧ(FAN) and EIᵧ(RAN) will be skewed to the detriment of RANs, as the lion’s share of FAN energy consumption will be ignored.
These estimates, whose exact values are presented in row 10 of Table 3 and in Section 5.2, can be rounded as follows:
- EI2020 (WAN) = 0.02 kWh/GB,
- EI2020 (FAN) = 0.07 kWh/GB,
- EI2020 (RAN) = 0.2 kWh/GB,
- E2020 (WAN) = 110 TWh,
- E2020 (FAN) = 130 TWh,
- E2020 (RAN) = 100 TWh
The high EI-values were chosen higher than all academic estimates as follows: EI (WAN) and EI (RAN) follow our computation based on (Telekom 2020), EI (FAN) an own assumption as described in Section 5.1; the low E-values are: E (WAN) from (Malmodin and Lundén 2018) very conservatively extrapolated 2015-2020, E (FAN) an average between (Malmodin and Lundén 2018) and (Van Heddeghem et al. 2014), E (RAN) from (Andrae and Edler 2015).
These numbers probably also represent a reasonable basis for extrapolation for a couple of years into the future. The yearly efficiency gains (corresponding to the yearly decreases of the energy intensity) need to be taken into account according to the rather trivial equation:
(14)
EIᵧ₊₁(X) = eirfᵧ(X) × EIᵧ(X)
for all X ∈ {WAN, FAN, RAN}, and where eirfᵧ(X) represents the yearly energy intensity reduction factor for the year y.
There are approximations of the intensity reduction factors in the literature; their caveat, however, is that – as shown above – they typically resulted in too optimistic results in the past. Until updated factors validated against top-down studies emerge, we suggest using slightly more pessimistic values than those of the literature, as follows:
- eirf₂₀₂₀(WAN) = 0.7 (Aslan et al. 2018) + 0.1 = 0.8
- eirf₂₀₂₀(FAN) = 0.75 (Wu 2021) + 0.1 = 0.85
- eirf₂₀₂₀(RAN) = 0.7 (Pihkola et al. 2018) − 0.8 (Elisa 2020)
Choose the more pessimistic and directly measured value: 0.8.
Of course, Equation (14) can be used for several years if assuming a constant reduction factor:
(15)
EIᵧ₊ₙ(X) = (eirfᵧ(X))ⁿ × EIᵧ(X)
This is a reasonable assumption for a couple of years; equation (15) should not be used for a longer time horizon anyway, given the uncertainties of the current data (see also next section) and the need for mutual validation between energy and energy intensity values in the new studies to come, which will thus hopefully decrease current uncertainties.