Resource utilization analysis of alibaba cloud
Status:: 🟩
Links:: Server Utilization
Metadata
Authors:: Deng, Li; Ren, Yu-Lin; Xu, Fei; He, Heng; Li, Chao
Authors:: Huang, De-Shuang; Bevilacqua, Vitoantonio; Premaratne, Prashan; Gupta, Phalguni
Title:: Resource utilization analysis of alibaba cloud
Date:: 2018
Publisher:: Springer International Publishing
URL::
DOI:: 10.1007/978-3-319-95930-6_18
Deng, L. et al. (2018) ‘Resource utilization analysis of alibaba cloud’, in D.-S. Huang et al. (eds) Intelligent Computing Theories and Application. Cham: Springer International Publishing, pp. 183–194. Available at: https://doi.org/10.1007/978-3-319-95930-6_18.
Currently, low resource utilization and high costs of cloud platform are becoming big challenges to cloud provider. However, due to confidentiality, few cloud platform providers are willing to publish resource utilization data of their cloud platform. This poses great difficulties in designing an effective cloud resource scheduler. Fortunately, Alibaba released its cloud resource usage data in September 2017. This paper analyzes Alibaba cloud trace data deeply from different aspects and reveals some important features of resource utilization. These features will help to design effective resource management approaches for cloud platform: (1) The maximum resource utilization of online services is closely related to their average utilization. (2) The longer a batch instance runs, the longer it may last. (3) The type of job that runs in a container can be estimated according to the amount of consumed resources and life time of this container. (4) Actual resources used by different batch jobs vary with time greatly and static resource allocation would make resource wasted seriously.
Notes & Annotations
Color-coded highlighting system used for annotations
📑 Annotations (imported on 2024-08-01#17:50:39)
In September 2017, Alibaba released resource usage data of more than 1,300 servers for twelve consecutive hours. These data can be available at website https://github.com/ Alibaba/clusterdata. There are seven trace files altogether (about 1 GB size). Two files are for resource usage description of computing nodes. Two files are for resource usage of batch loads, while the other two files are for online services. The last file is an explanatory document. Only two kinds of workloads, batch jobs and online services, are involved in the trace.
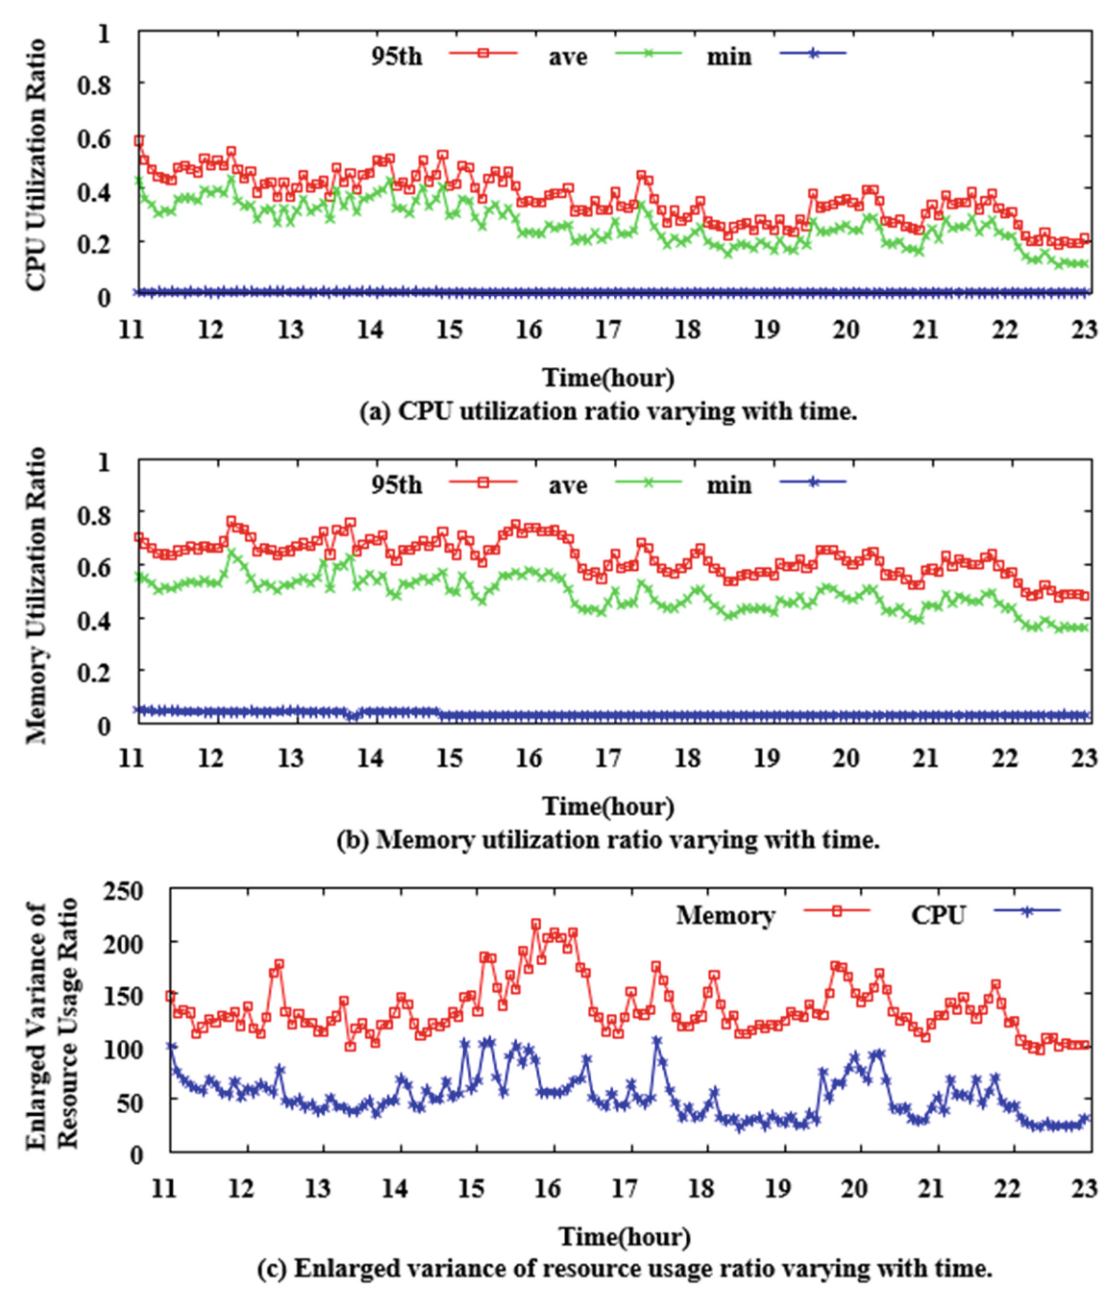
It can be seen that during the entire tracking process, average CPU usage was between 10% and 45%, while the minimum CPU usage was almost close to 0. The 95th percentile CPU usage was fluctuant between 30% and 60%. Figure 1(b) lists dynamic memory resource usage. It is known that average memory usage rate fluctuated between 35% and 65%, while the 95th percentile memory usage was between 45% and 80%. Just like CPU, the minimum memory usage was near close to 0 all the time. There were big gaps both on CPU and memory usage among different servers during the tracking. And, memory usage was larger than CPU usage, which means that more CPUs were idle and much energy was wasted.

Fig. 1. Resource utilization ratio of servers varying with time.
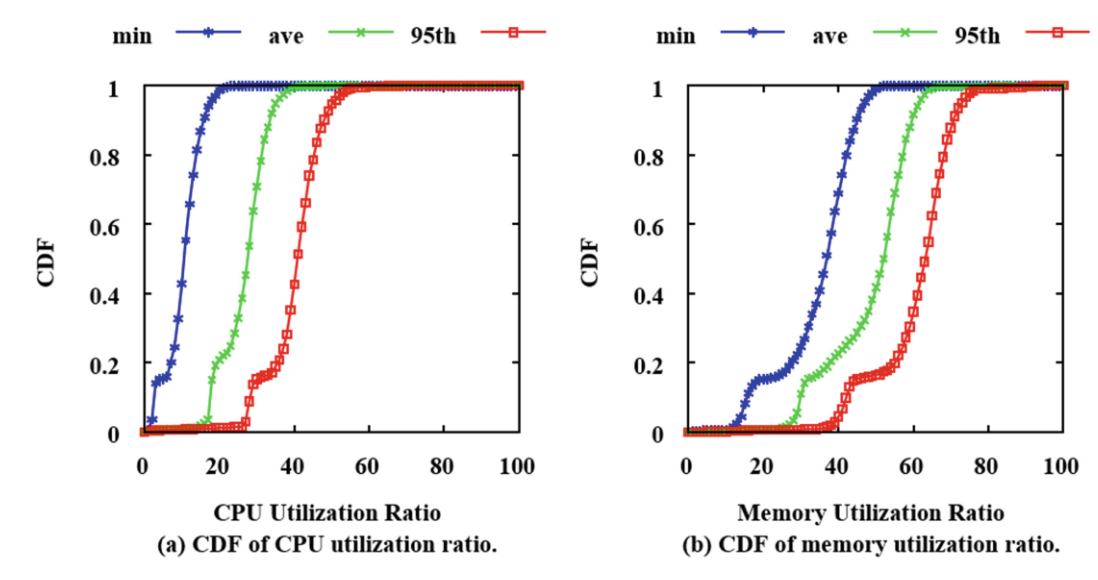
To understand the distribution of servers on resource usage, cumulative distribution function (CDF) of CPU and memory is respectively figured out. For each server, average resource usage (denoted as ave in Fig. 2), the minimum (denoted as min in Fig. 2) and the 95th percentile measurement (denoted as 95th in Fig. 2) during the whole tracking process are respectively computed first. Based on these values, the corresponding CDF is then figured out. Figure 2(a) depicts CDF of CPU usage ratio. It shows that, there are 90% of nodes whose average usage did not exceed 35% and the minimum of all the servers had less than 30%. The minimum usage of 90% of nodes did not exceed 15%. 90% of nodes’ 95th percentile usage was less than 50%. That shows, CPU usage ratio of most nodes were very low. Figure 2(b) depicts CDF of memory usage ratio. It shows that, 90% of nodes’ average utilization rate did not exceed 60% and 90% of nodes’ minimum usage did not exceed 45%. 95% of nodes’ 95th percentile memory usage was less than 70%.

Fig. 2. CDF of resource utilization ratio.
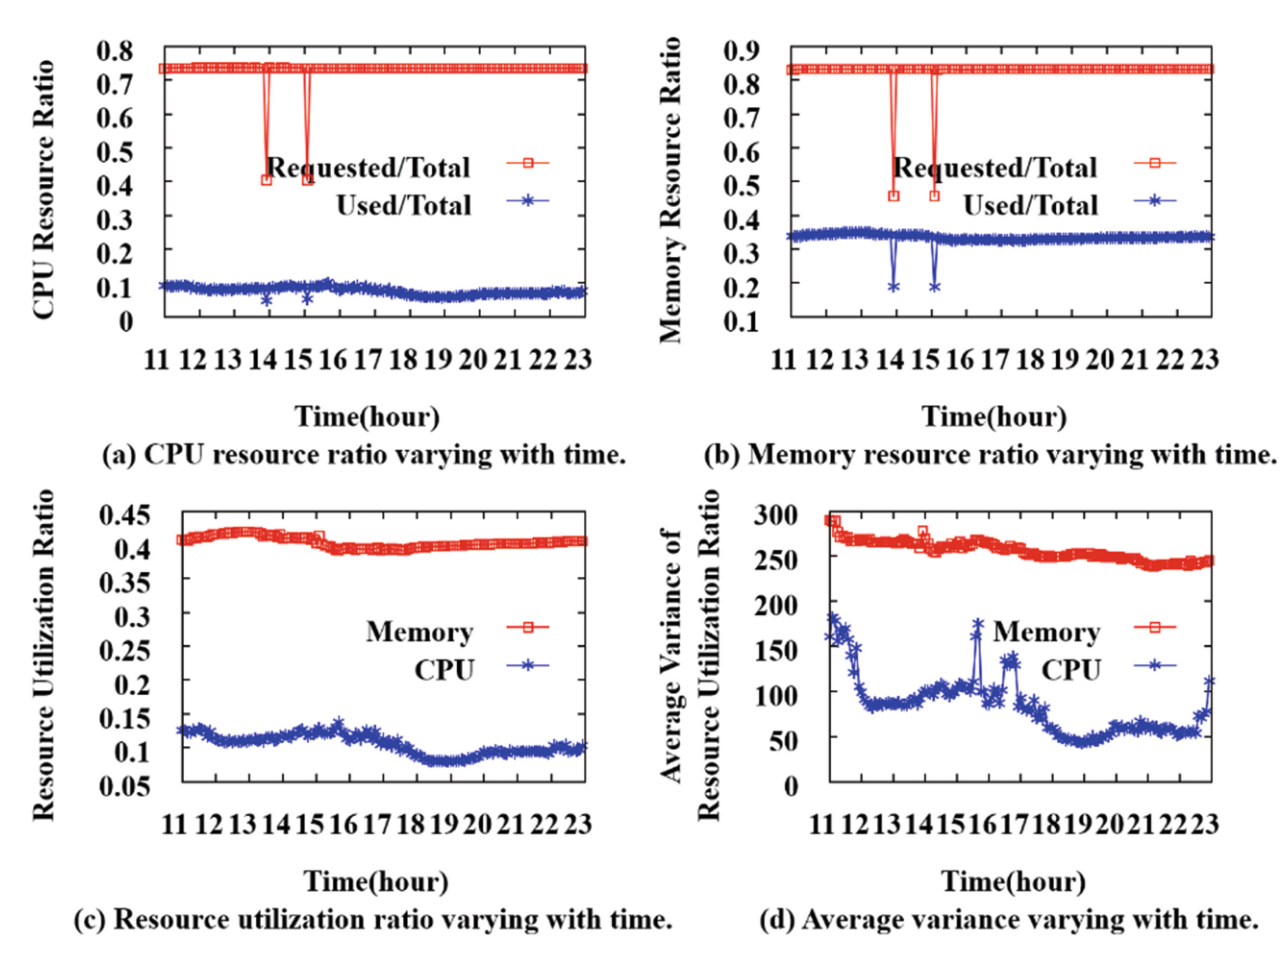
It can be seen that, the amount of CPU requested by online services accounts for 70%–75% of the total amount, while only 6%–11% of total CPUs were actually used by online services. A large number of processor resource were idle. Requested/Total of memory is 80%–85%, while the actually used part occupies 32%–36%. Users tend to amplify their resource requirements which leads to serious waste of resources.

Fig. 3. Resource usage of online services varying with time.
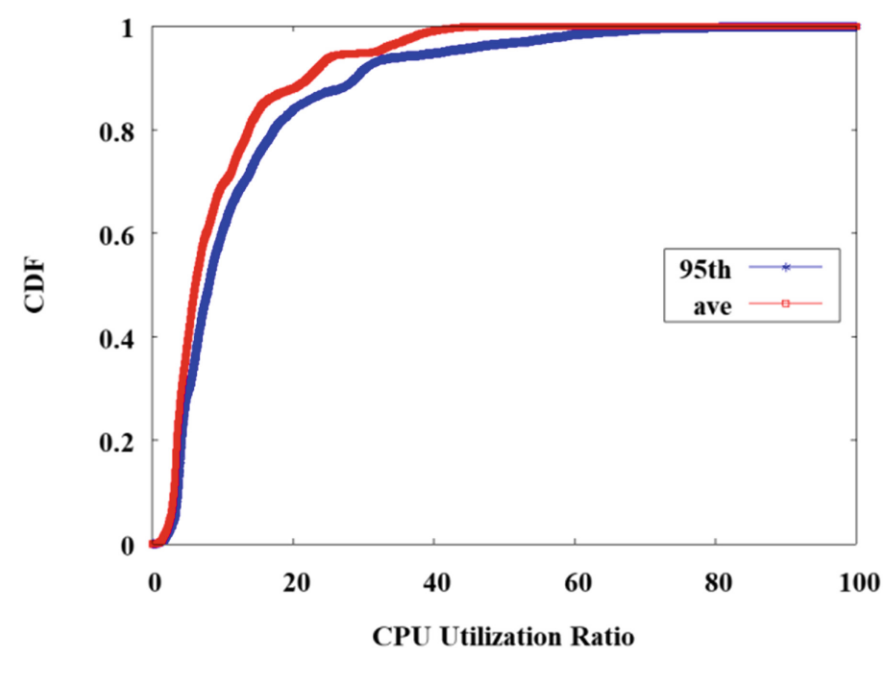
Based on average utilization ratio (represented as ave) and the 95th percentile of CPU usage (denoted as 95th) of each online service, Fig. 4 describes CDF of process utilization ratio. It can be shown that 80% of online services’ average and 95th percentile usage are less than 20%. Most online services have low average CPU usage. Almost average CPU usage of all services is less than 40%. Although the 95th percentile CPU usage for most online services is basically very low, there are still nearly 5% of online services’ 95th percentile CPU usage greater than 50%. This shows that when predicting the usage of online services, it is necessary to take some high CPU usage of online services into account.

Fig. 4. CDF of CPU utilization ratio for online services.