Energy Consumption in Data Centres and Broadband Communication Networks in the EU
Status:: 🟩
Links:: Global energy consumption & carbon emissions of the whole ICT sector
Metadata
Authors:: European Commission. Joint Research Centre.; Kamiya, George; Bertoldi, Paolo
Title:: Energy Consumption in Data Centres and Broadband Communication Networks in the EU
Date:: 2024
URL:: https://data.europa.eu/doi/10.2760/706491
DOI::
European Commission. Joint Research Centre., Kamiya, G., & Bertoldi, P. (2024). Energy Consumption in Data Centres and Broadband Communication Networks in the EU (JRC135926). Publications Office of the European Union. https://doi.org/10.2760/706491
Demand for digital services is rising rapidly, raising concerns about the energy use and environmental impacts of data centres and telecommunication networks. Despite the increasing public and policy interest in addressing these impacts, there is a lack of official statistics on the energy use of digital infrastructure. This study reviews and uses existing literature and public data sources to estimate the energy consumption of data centres and telecommunication networks in the European Union (EU-27) in 2022. Data centres in the EU used an estimated 45–65 TWh of electricity in 2022 (1.8–2.6% of total EU electricity use), while telecommunication networks used an estimated 25–30 TWh of electricity (1–1.2% of total EU electricity use). Network energy use as a share of national electricity use was both lower and more uniform than data centres. Policymakers and companies should work together to improve data collection, quality, and availability in order to better understand trends and make informed policy decisions to manage the energy and environmental impacts of digital infrastructure.
Notes & Annotations
Color-coded highlighting system used for annotations
📝 Note (last modified: 2024-03-16#08:51:19) (
Executive Summary
Demand for digital services is rising rapidly, raising concerns about the energy use and environmental impacts of data centres and telecommunication networks. Despite the increasing public and policy interest in addressing these impacts, there is a lack of official statistics on the energy use of digital infrastructure. This study reviews and uses existing literature and public data sources to estimate the energy consumption of data centres and telecommunication networks in the European Union (EU-27) in 2022.
Data centres in the EU used an estimated 45–65 TWh of electricity in 2022, equivalent to 1.8–2.6% of total regional electricity consumption. The top four data centre markets – Germany, France, the Netherlands, and Ireland – accounted for nearly two-thirds of the region’s data centre energy use, despite having less than 40% of the population. Data centres represent over 2% of national electricity use in Ireland (18%), the Netherlands (5.2%), Luxembourg (4.8%), Denmark (4.5%), and Germany (3%), Sweden (2.3%), and France (2.2%).
Telecommunication networks used an estimated 25–30 TWh of electricity, equivalent to 1–1.2% of total EU electricity use. The four largest Member States by population and GDP (Germany, France, Italy, and Spain) were also the four largest users of energy for telecommunication networks, accounting for 65% of the total. Network energy use as a share of national electricity use was both lower and more uniform compared with data centres, ranging from 0.5% to 1.5%. In contrast, data centres as a share of national electricity use range from as low as 0.4% in some countries to as high as 18% in Ireland.
The combined energy use of data centres and telecommunication networks in the EU was 70–95 TWh in 2022, equivalent to 2.8–3.8% of total regional electricity use. The four largest Member States – Germany, France, Italy, and Spain – accounted for about 60% of total digital infrastructure energy use in the region. Digital infrastructure accounts for more than 5% of national electricity use in four countries, each with major data centre markets: Ireland (19%), the Netherlands (6%), Luxembourg (5.5%), and Denmark (5%).
Policymakers and companies must work together to improve data collection, quality and availability. While the estimates of this study represent a likely range of figures, it is critical to develop more robust estimates to better understand trends and make informed policy decisions to manage the energy and environmental impacts of digital infrastructure. Governments and statistical agencies should develop standardised definitions and classifications for data centres and networks, such as providing criteria and guidance on classifying different data centre types. Governments and companies should work together to improve data quality and availability regarding data centre energy consumption (by size and type), telecommunication network energy use (by type), as well as relevant activity indicators (e.g. connections, data traffic, data centre workloads). Data collection efforts should also seek to better understand energy use characteristics and implications of specific services and tasks such as artificial intelligence.
📑 Annotations (imported on 2024-03-17#07:04:50)

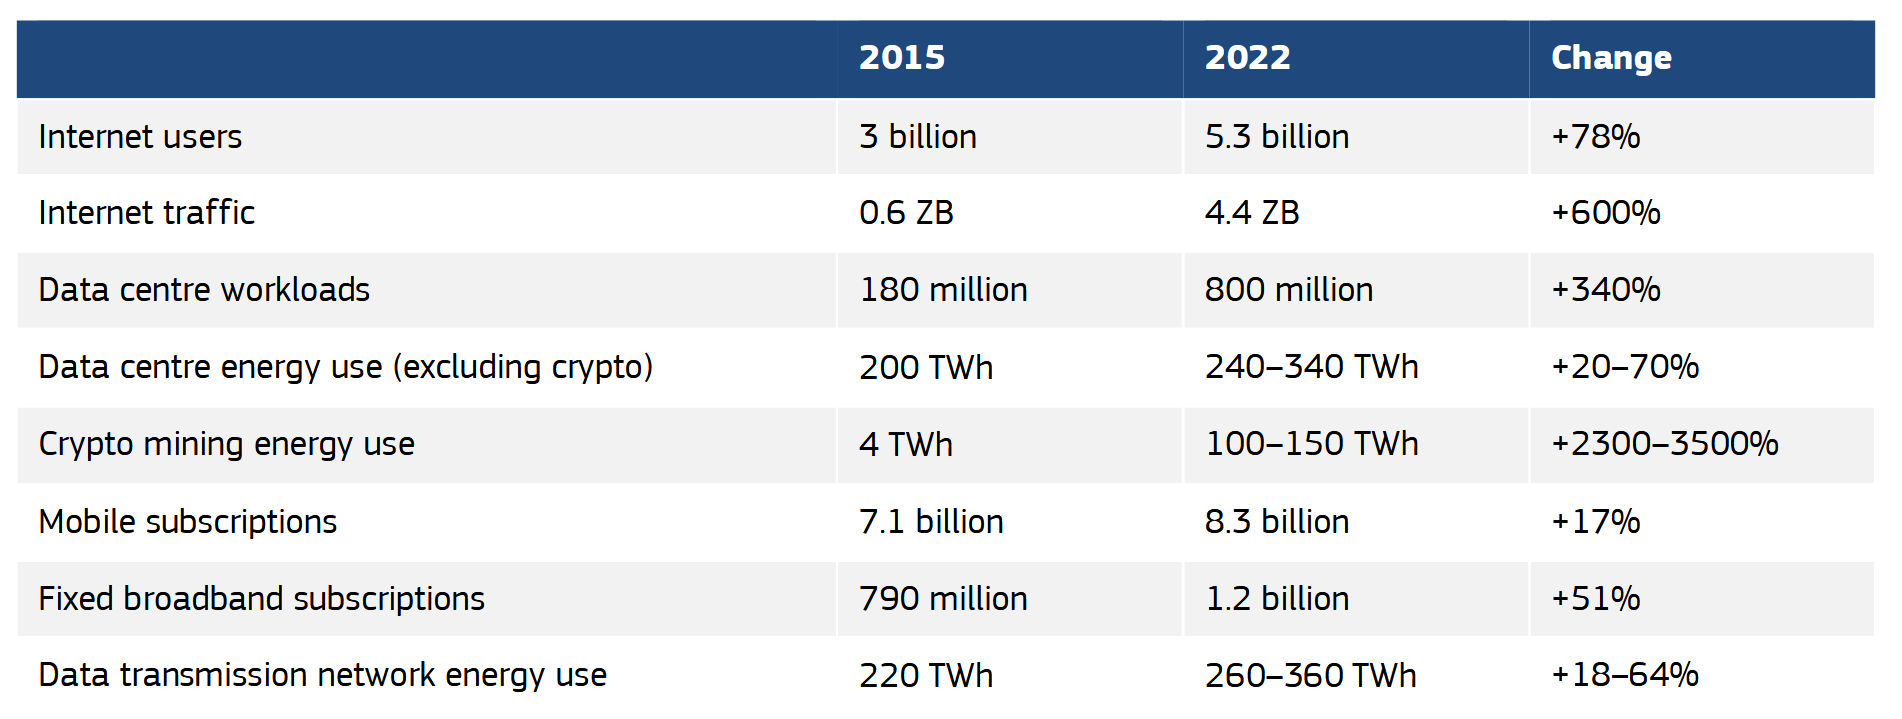
Global trends in digital and energy indicators, 2015–2022
Sources: IEA (2023a); Malmodin et al. (2023)
Germany: The Borderstep Institute estimated that data centres in Germany consumed 14 TWh in 2018, 16.3 TWh in 2020, 17 TWh in 2021, and 17.9 TWh in 2022 (Hintemann et al., 2023; Hintemann & Hinterholzer, 2020, 2022). Based on current trends, they project data centre energy consumption could reach 27 TWh in 2030 (Hintemann et al., 2023). BloombergNEF estimates that colocation and hyperscale data centres in Germany used 7.2 TWh in 2021 (BloombergNEF et al., 2021).
There are only a few estimates on the global estimates for telecommunication network energy use. Malmodin et al. (2023) estimate that networks consumed 244 TWh in 2020, or around 1% of global electricity use. Coroamă (2021) reviewed bottom-up and top-down studies to estimate that networks consumed 340 TWh in 2020 (1.4% of global electricity). The GSMA estimated that telecommunication network operators used 293 TWh of electricity in 20215 (GSMA, 2022).
Google estimated that ML accounted for 10–15% of their total energy use in recent years (i.e. 2–3 TWh in 2021), but noted that it is growing at a similar rate as overall company-wide energy use – around 20–30% per year (Google, 2022; Patterson et al., 2022). Computing demand for ML training and inference at Meta have increased by more than 100% per year in recent years, while overall data centre energy consumption grew about 40% per year (Meta, 2022; Naumov et al., 2020; Park et al., 2018).
The combination of the rapid growth in the size of the largest models (OpenAI, 2018) and ML compute demand (Wu et al., 2022) are likely to outpace strong energy efficiency improvements resulting in a net growth in total AI-related energy use in the coming years. Although AI itself can help reduce energy use in data centres (DeepMind, 2016; Luo et al., 2022), the rapid and mainstream adoption of AI chatbots like OpenAI’s ChatGPT and Google Bard are likely to accelerate energy demand growth for AI.
These figures are substantially higher than more recent estimates published by the IEA (80–180 Wh per hour) and the Carbon Trust (220 Wh) (Kamiya, 2020b, 2020a; The Carbon Trust, 2021). A July 2023 study published by the European Commission estimated that a typical hour of streaming in Europe uses 50 Wh (EC DG Energy et al., 2023). Outdated energy intensity assumption and the use of faulty methodologies have resulted in some studies significantly overestimating the energy and carbon footprint of streaming video, particularly from data transmission (Moulierac et al., 2023). Based on typical viewership patterns today, the vast majority of total end-to-end energy use (i.e. from the data centre to the viewing devices) is consumed by end user devices and home networking equipment (The Carbon Trust, 2021).
Online gaming typically consumes more energy than streaming video, both from higher data intensity and from using more energy intensive devices. Aslan (2020) compared the carbon intensity of different gaming methods, and found that downloading was the least carbon intensive (47g CO2e per hour), followed by disc (55g) and cloud (149g). Mills et al. (2019) also found that cloud gaming is up 30-300% more energy intensive than local gaming, consuming 100–1000 kWh annually per user (Cardoso, 2020). They also estimate that gaming could consume 34 TWh in 2016 in the United States.
Data centres in the EU-27 used an estimated 45–65 TWh of electricity in 2022, or 1.8–2.6% of total electricity consumption. This estimate is slightly lower than Montevecchi et al. (2020), which estimated that data centres accounted for 2.7% of total EU28 electricity use in 2018.
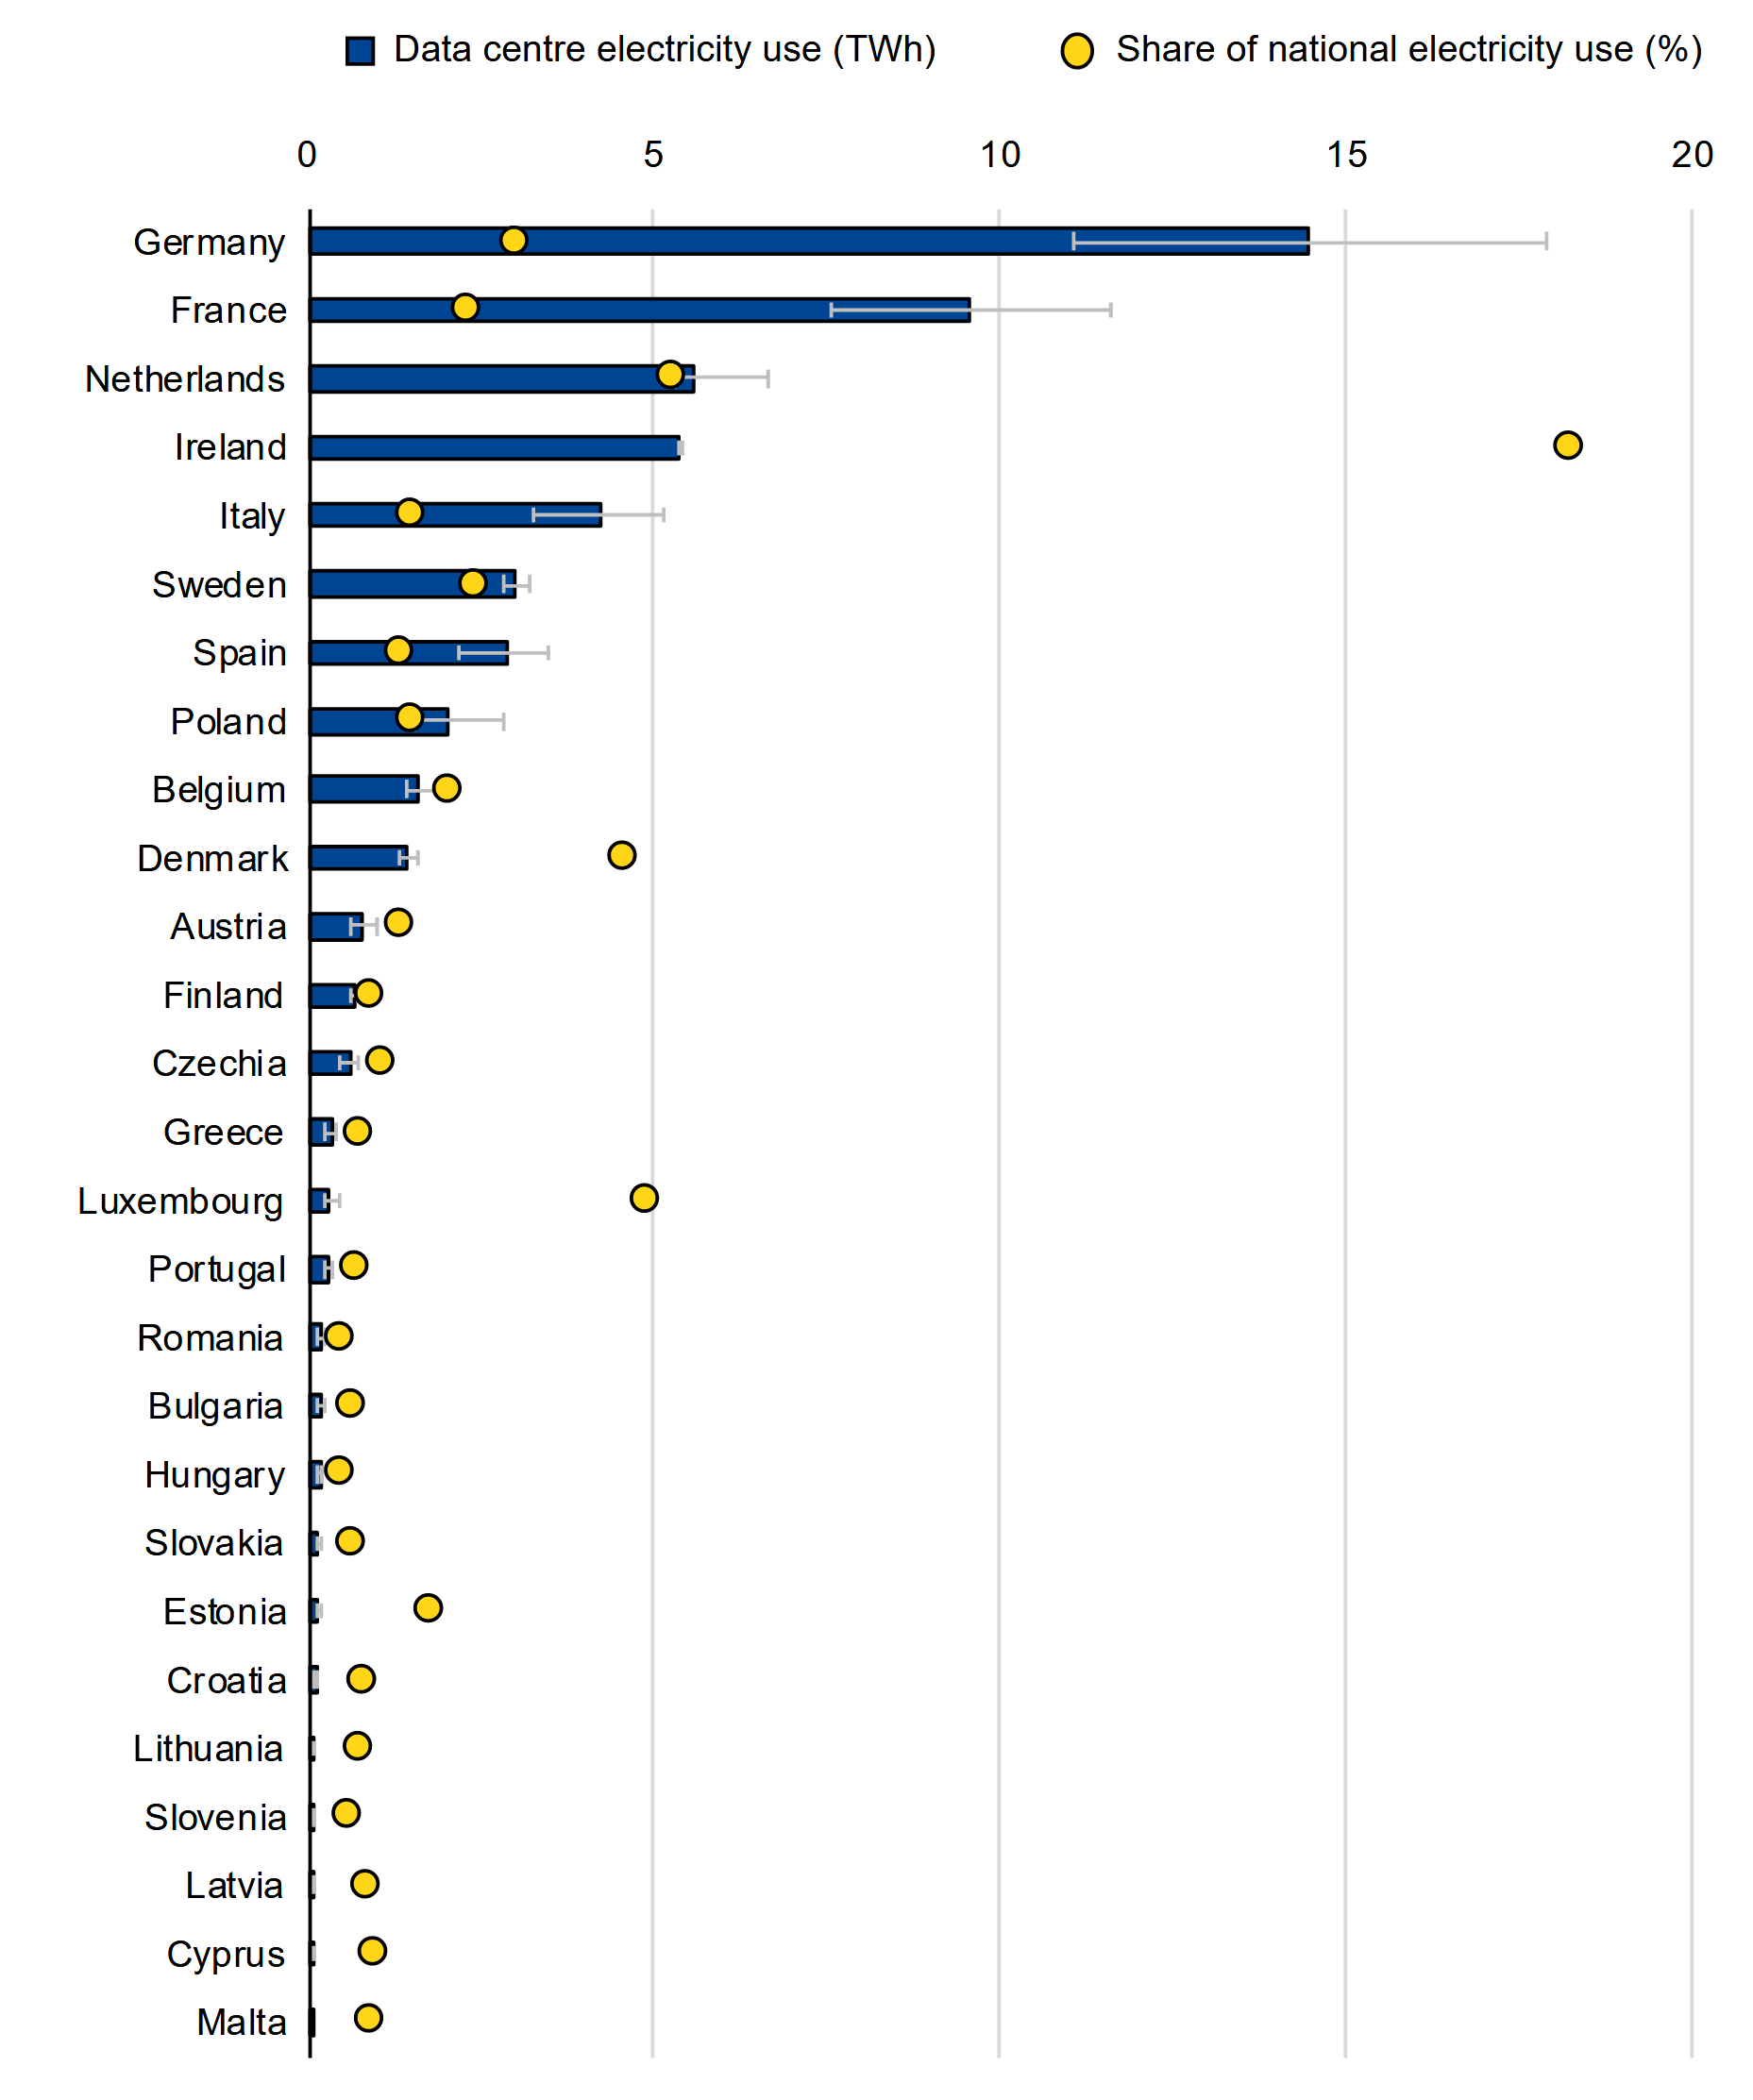
Most of the region’s data centre energy use is concentrated in the largest markets. The top four data centre markets – Germany, France, the Netherlands, and Ireland – account for nearly two-thirds of the region’s data centre energy use, despite having less than 40% of the population (Figure 2).
In Germany, data centres used an estimated 15 TWh in 2022, equivalent to around 3% of national electricity use. In France, data centres used around 10 TWh of electricity, equivalent to 2.2% of national electricity use.
Data centres represent a significant share of national electricity use in Ireland (18%), the Netherlands (5.2%), Luxembourg (4.8%), Denmark (4.5%), and Germany (3%), Sweden (2.3%), and France (2.2%). In all other countries, data centres represent less than the EU-27 average of 2.2%.

Figure 2. Estimated data centre energy use by country, 2022
Telecommunication networks in the EU-27 used an estimated 25–30 TWh of electricity in 2022, or 1–1.2% of total electricity consumption. Based on disaggregated data from a few countries, mobile networks likely accounted for about 60% of the total. These results are in-line with Lundén et al. (2022), which estimated 29 TWh in 2020 (EU-27), equivalent to 1.2% of electricity use.
Data centres in the EU-27 used an estimated 45–65 TWh of electricity in 2022, or 1.8–2.6% of total electricity consumption. Telecommunication networks used an estimated 25–30 TWh of electricity in 2022, or 1–1.2% of total electricity consumption. The relatively wide range for data centres is indicative of the considerable uncertainty in data centre energy estimates stemming from the lack of available data. Data centres and networks – digital infrastructure – together consumed an estimated 70–95 TWh in the EU27, equivalent to 2.8–3.8% of total regional electricity use. The four largest Member States by population and GDP – Germany, France, Italy, and Spain – account for about 60% of total digital infrastructure energy use in the region (Figure 4). Digital infrastructure accounts for more than 5% of national electricity use in five countries: Ireland (19%), the Netherlands (6%), Luxembourg (5.5%), and Denmark (5%).