Evaluation and projection of 4G and 5G RAN energy footprints: the case of Belgium for 2020–2025
Status:: 🟩
Links::
Metadata
Authors:: Golard, Louis; Louveaux, Jérôme; Bol, David
Title:: Evaluation and projection of 4G and 5G RAN energy footprints: the case of Belgium for 2020–2025
Publication Title:: "Annals of Telecommunications"
Date:: 2023
URL:: https://doi.org/10.1007/s12243-022-00932-9
DOI:: 10.1007/s12243-022-00932-9
Golard, L., Louveaux, J., & Bol, D. (2023). Evaluation and projection of 4G and 5G RAN energy footprints: The case of Belgium for 2020–2025. Annals of Telecommunications, 78(5–6), 313–327. https://doi.org/10.1007/s12243-022-00932-9
Energy consumption of mobile cellular communications is mainly due to base stations (BSs) that constitute radio access networks (RANs). 5G technologies are expected to improve the RAN energy efficiency while supporting the forecasted growth in data traffic. However, the evolution of the absolute RAN energy consumption with 5G deployment is not clear. Moreover, existing BS power models are mostly derived from legacy equipment. Therefore, this work presents a method to evaluate and to project the total energy consumption of broadband RANs. We use on-site up-to-date measurements to determine power models of 4G BSs, showing a linear relationship between power consumption and data traffic with a static traffic-independent power component. We then build a prospective power model of 5G BSs by scaling 4G models with respect to bandwidth, number of data streams, and expected technological improvements. We apply this method to the RANs in Belgium over the 2020–2025 period for six scenarios of 5G deployment. Results show that the static energy consumption accounts for a major part of the total RAN energy consumption, which implies that concurrently operating 4G and 5G RANs consumes more energy than using only one generation. The sleep mode feature of 5G technology can reduce its RAN static energy consumption, improving energy efficiency by 10 times compared to 4G. Finally, we estimate the absolute carbon footprint of 4G and 5G RANs by considering embodied and operating greenhouse gas emissions. They follow a clear upward trend for scenarios with extensive 5G deployment.
Notes & Annotations
Color-coded highlighting system used for annotations
📑 Annotations (imported on 2024-01-31#17:29:27)
The infrastructure supporting mobile communications can be divided into four segments: (i) the end-user devices, (ii) the radio access network (RAN), (iii) the core network, and (iv) the data centers.
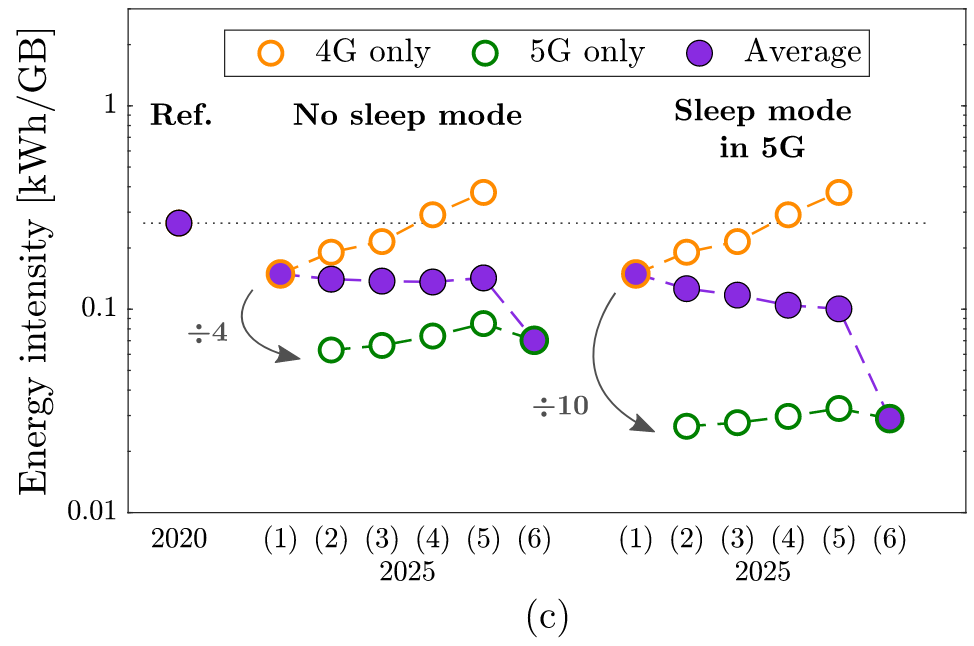
The energy intensity per GB is shown in Fig. 7c for 4G and 5G independently, and for both generations together. Clearly, the energy intensity of 5G is 3 to 5× lower compared to 4G, and up to 8 to 12× better with SM. Without 5G deployment, the energy intensity of 4G is 0.15 kWh/GB in 2025, which is 2× lower than in 2020 because the additional traffic requires few more dynamic power, and no more static power.
The carbon footprint of RANs consists of embodied and operating GHG emissions. The operating carbon footprint is estimated using the carbon intensity of electricity consumed in Belgium, i.e., 0.230 kgCO2e/kWh in 2019 [54]. Assuming a reduction rate of 3% per year as observed in historical trends [34], the power carbon intensity is projected to be 0.223 kgCO2e/kWh in 2020, and 0.192 kgCO2e/kWh in 2025.
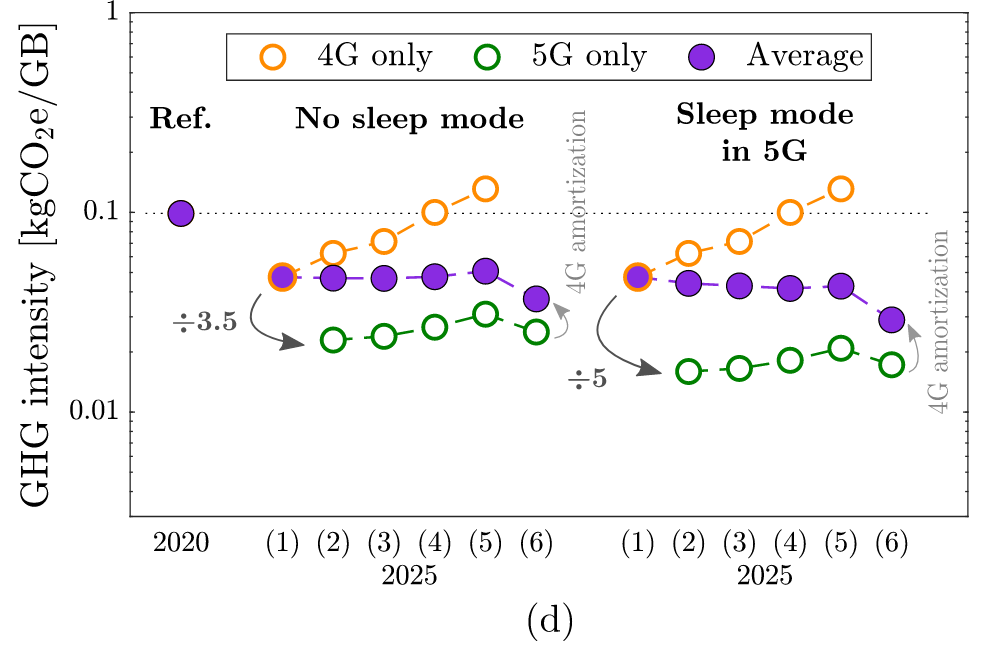
The average carbon intensity of mobile data transfers is estimated to be 0.10 kgCO2/GB in 2020 and around 0.05 kgCO2/GB in 2025 for scenarios keeping 4G active, even with SM in 5G. Again, a rebound effect appears for the carbon footprint. Per user, the average carbon intensity remains between 4 and 6 kgCO2e/user for all scenarios. The amortization of 4G BSs reduces GHG emission savings.
Results show that the RAN energy consumption is mostly independent of the data traffic because BSs are lightly loaded on average.
With full 5G deployment, we rather predict a threefold growth in mobile data traffic and an 81% increase in total energy consumption, despite the improvement in energy intensity. This illustrates a backfire rebound effect.
The sleep mode feature can reduce the static energy consumption of 5G, improving up to 10 times its energy efficiency compared to 4G.
Accurately assessing environmental impacts of 4G and 5G BSs throughout their life-cycle is difficult because there is currently a lack of data and information from manufacturers. Hence, we roughly estimate embodied and operating GHG emissions of BSs, and we observe a clear upward trend of RAN carbon footprint when 5G deployment is extensive. This is partly due to the large number of new 5G BSs that need to be produced. Depending on the scenario, embodied GHG emissions account for 40 to 70% of the total carbon footprint, which is significant and should be included in mobile network deployment strategies.