Development and evaluation of a reference measurement model for assessing the resource and energy efficiency of software products and components—green software measurement model (GSMM)
Status:: 🟩
Links:: Measure energy consumption of software
Metadata
Authors:: Guldner, Achim; Bender, Rabea; Calero, Coral; Fernando, Giovanni S.; Funke, Markus; Gröger, Jens; Hilty, Lorenz M.; Hörnschemeyer, Julian; Hoffmann, Geerd-Dietger; Junger, Dennis; Kennes, Tom; Kreten, Sandro; Lago, Patricia; Mai, Franziska; Malavolta, Ivano; Murach, Julien; Obergöker, Kira; Schmidt, Benno; Tarara, Arne; De Veaugh-Geiss, Joseph P.; Weber, Sebastian; Westing, Max; Wohlgemuth, Volker; Naumann, Stefan
Title:: Development and evaluation of a reference measurement model for assessing the resource and energy efficiency of software products and components—green software measurement model (GSMM)
Publication Title:: "Future Generation Computer Systems"
Date:: 2024
URL:: https://www.sciencedirect.com/science/article/pii/S0167739X24000384
DOI:: 10.1016/j.future.2024.01.033
Guldner, A., Bender, R., Calero, C., Fernando, G. S., Funke, M., Gröger, J., Hilty, L. M., Hörnschemeyer, J., Hoffmann, G.-D., Junger, D., Kennes, T., Kreten, S., Lago, P., Mai, F., Malavolta, I., Murach, J., Obergöker, K., Schmidt, B., Tarara, A., … Naumann, S. (2024). Development and evaluation of a reference measurement model for assessing the resource and energy efficiency of software products and components—Green software measurement model (GSMM). Future Generation Computer Systems, 155, 402–418. https://doi.org/10.1016/j.future.2024.01.033
In the past decade, research on measuring and assessing the environmental impact of software has gained significant momentum in science and industry. However, due to the large number of research groups, measurement setups, procedure models, tools, and general novelty of the research area, a comprehensive research framework has yet to be created. The literature documents several approaches from researchers and practitioners who have developed individual methods and models, along with more general ideas like the integration of software sustainability in the context of the UN Sustainable Development Goals, or science communication approaches to make the resource cost of software transparent to society. However, a reference measurement model for the energy and resource consumption of software is still missing. In this article, we jointly develop the Green Software Measurement Model (GSMM), in which we bring together the core ideas of the measurement models, setups, and methods of over 10 research groups in four countries who have done pioneering work in assessing the environmental impact of software. We briefly describe the different methods and models used by these research groups, derive the components of the GSMM from them, and then we discuss and evaluate the resulting reference model. By categorizing the existing measurement models and procedures and by providing guidelines for assimilating and tailoring existing methods, we expect this work to aid new researchers and practitioners who want to conduct measurements for their individual use cases.
Notes & Annotations
Color-coded highlighting system used for annotations
📑 Annotations (imported on 2024-03-28#18:04:32)
Chowdhury et al. [20,21] proposed a model which is based on dynamic traces of system calls and CPU utilization in order to estimate the energy consumption of software.
[20] S. Chowdhury, A. Hindle, Greenoracle: estimating software energy consumption with energy measurement corpora, in: Proceedings of the 13th International Conference on Mining Software Repositories, 2016, pp. 49–60, http://dx.doi. org/10.1145/2901739.2901763.
[21] S. Chowdhury, S. Borle, S. Romansky, A. Hindle, Greenscaler: training software energy models with automatic test generation, Empir. Softw. Eng. 24 (2019) 1573–7616, http://dx.doi.org/10.1007/s10664-018-9640-7.
Moreover, the influence of software architecture on energy consumption has been addressed by Guamán and Pérez [22] and Cabot et al. [23].
[22] D. Guamán, J. Pérez, Supporting sustainability and technical debt-driven design decisions in software architectures, in: Information Systems Development: Crossing Boundaries Between Development and Operations (DevOps) in Information Systems, AIS, 2021, p. na.
[23] J. Cabot, R. Capilla, C. Carrillo, H. Muccini, B. Penzenstadler, Measuring systems and architectures: A sustainability perspective, IEEE Softw. 36 (03) (2019) 98–100, http://dx.doi.org/10.1109/MS.2019.2897833.
Currently, there is no consensus on measurement setups, methods, or techniques for data analysis. With each researcher applying their own methods, often with little to no documentation or publicly available data (e. g., in the form of replication packages), it is difficult and sometimes outright impossible to check or compare results obtained across studies, to replicate analyses, or to re-use data. To solve this problem, we propose establishing a reference model for measurement and analysis methods to assess the resource and energy efficiency of software.
Ournani [41] and Schade [42] also provide an overview of software energy measurement tools, both software-based and hardware-based, and Jay et al. [36] compare a set of softwarebased measurement tools and investigate how measurements obtained through them correlate to those taken with an external power meter.
[36] M. Jay, V. Ostapenco, L. Lefèvre, D. Trystram, A.C. Orgerie, B. Fichel, An experimental comparison of software-based power meters: focus on CPU and GPU, in: CCGrid 2023 - 23rd IEEE/ACM International Symposium on Cluster, Cloud and Internet Computing, IEEE, Bangalore, India, 2023, pp. 1–13, URL https://inria.hal.science/hal-04030223.
[41] Z. Ournani, Software Eco-Design: Investigating and Reducing the Energy Consumption of Software (Ph.D. thesis), University of Lille, 2021, URL https://tel.archives-ouvertes.fr/tel-03429300.
[42] T. Schade, Greencoding-measuring-tools, 2023, URL http://github.com/schaDev/GreenCoding-measuring-tools. Accessed 21 November 2023.
The Green Metrics Tool (see Section 6.4) is a versatile industry energy measurement tool from Green Coding Berlin. It isolates applications in containers for precise measurement of power, network, disk, and memory consumption, and supports various metrics. The tool is architecture-agnostic, it can be used for GUI applications, and it separates benchmark runs into distinct life cycle steps. It offers a detailed dashboard and an API for data analysis, focusing on machine-dependent factors to understand energy consumption impacts.
The Cloud Energy Usage Estimation Model (see Section 6.5) devel- oped by Green Coding Berlin is a machine learning model that estimates energy usage in environments where controlled measurements are not feasible. Based on research by Rteil et al. [51], it uses the SPECPower dataset to create an XGBoost model for estimating the AC power draw of servers. The model is particularly useful in settings (e. g., cloud) where detailed CPU information is not available.
[51] N. Rteil, R. Bashroush, R. Kenny, A. Wynne, Interact: IT infrastructure energy and cost analyzer tool for data centers, Sustain. Comput.: Inform. Syst. 33 (2022) http://dx.doi.org/10.1016/j.suscom.2021.100618.
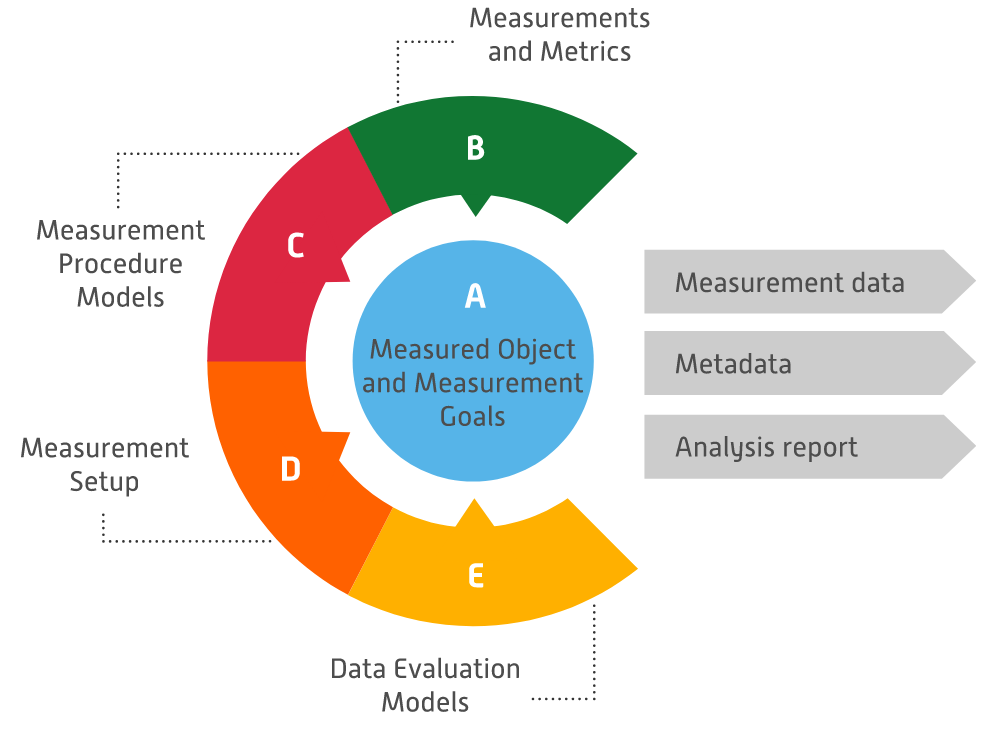
Fig. 1. Components of the GSMM.
Common measurement goals include the comparison of the software entity with itself over the development process, e. g., within a CI/CD pipeline, between releases, or when introducing new features. Furthermore, comparisons between different implementations, libraries, configurations, etc., and between different products performing similar tasks (e. g., within software product groups like browsers, media players, databases) are possible—and it is even feasible to compare individual functionalities or software features across product groups (e. g., there are many software products which provide a feature to ‘‘edit text’’).
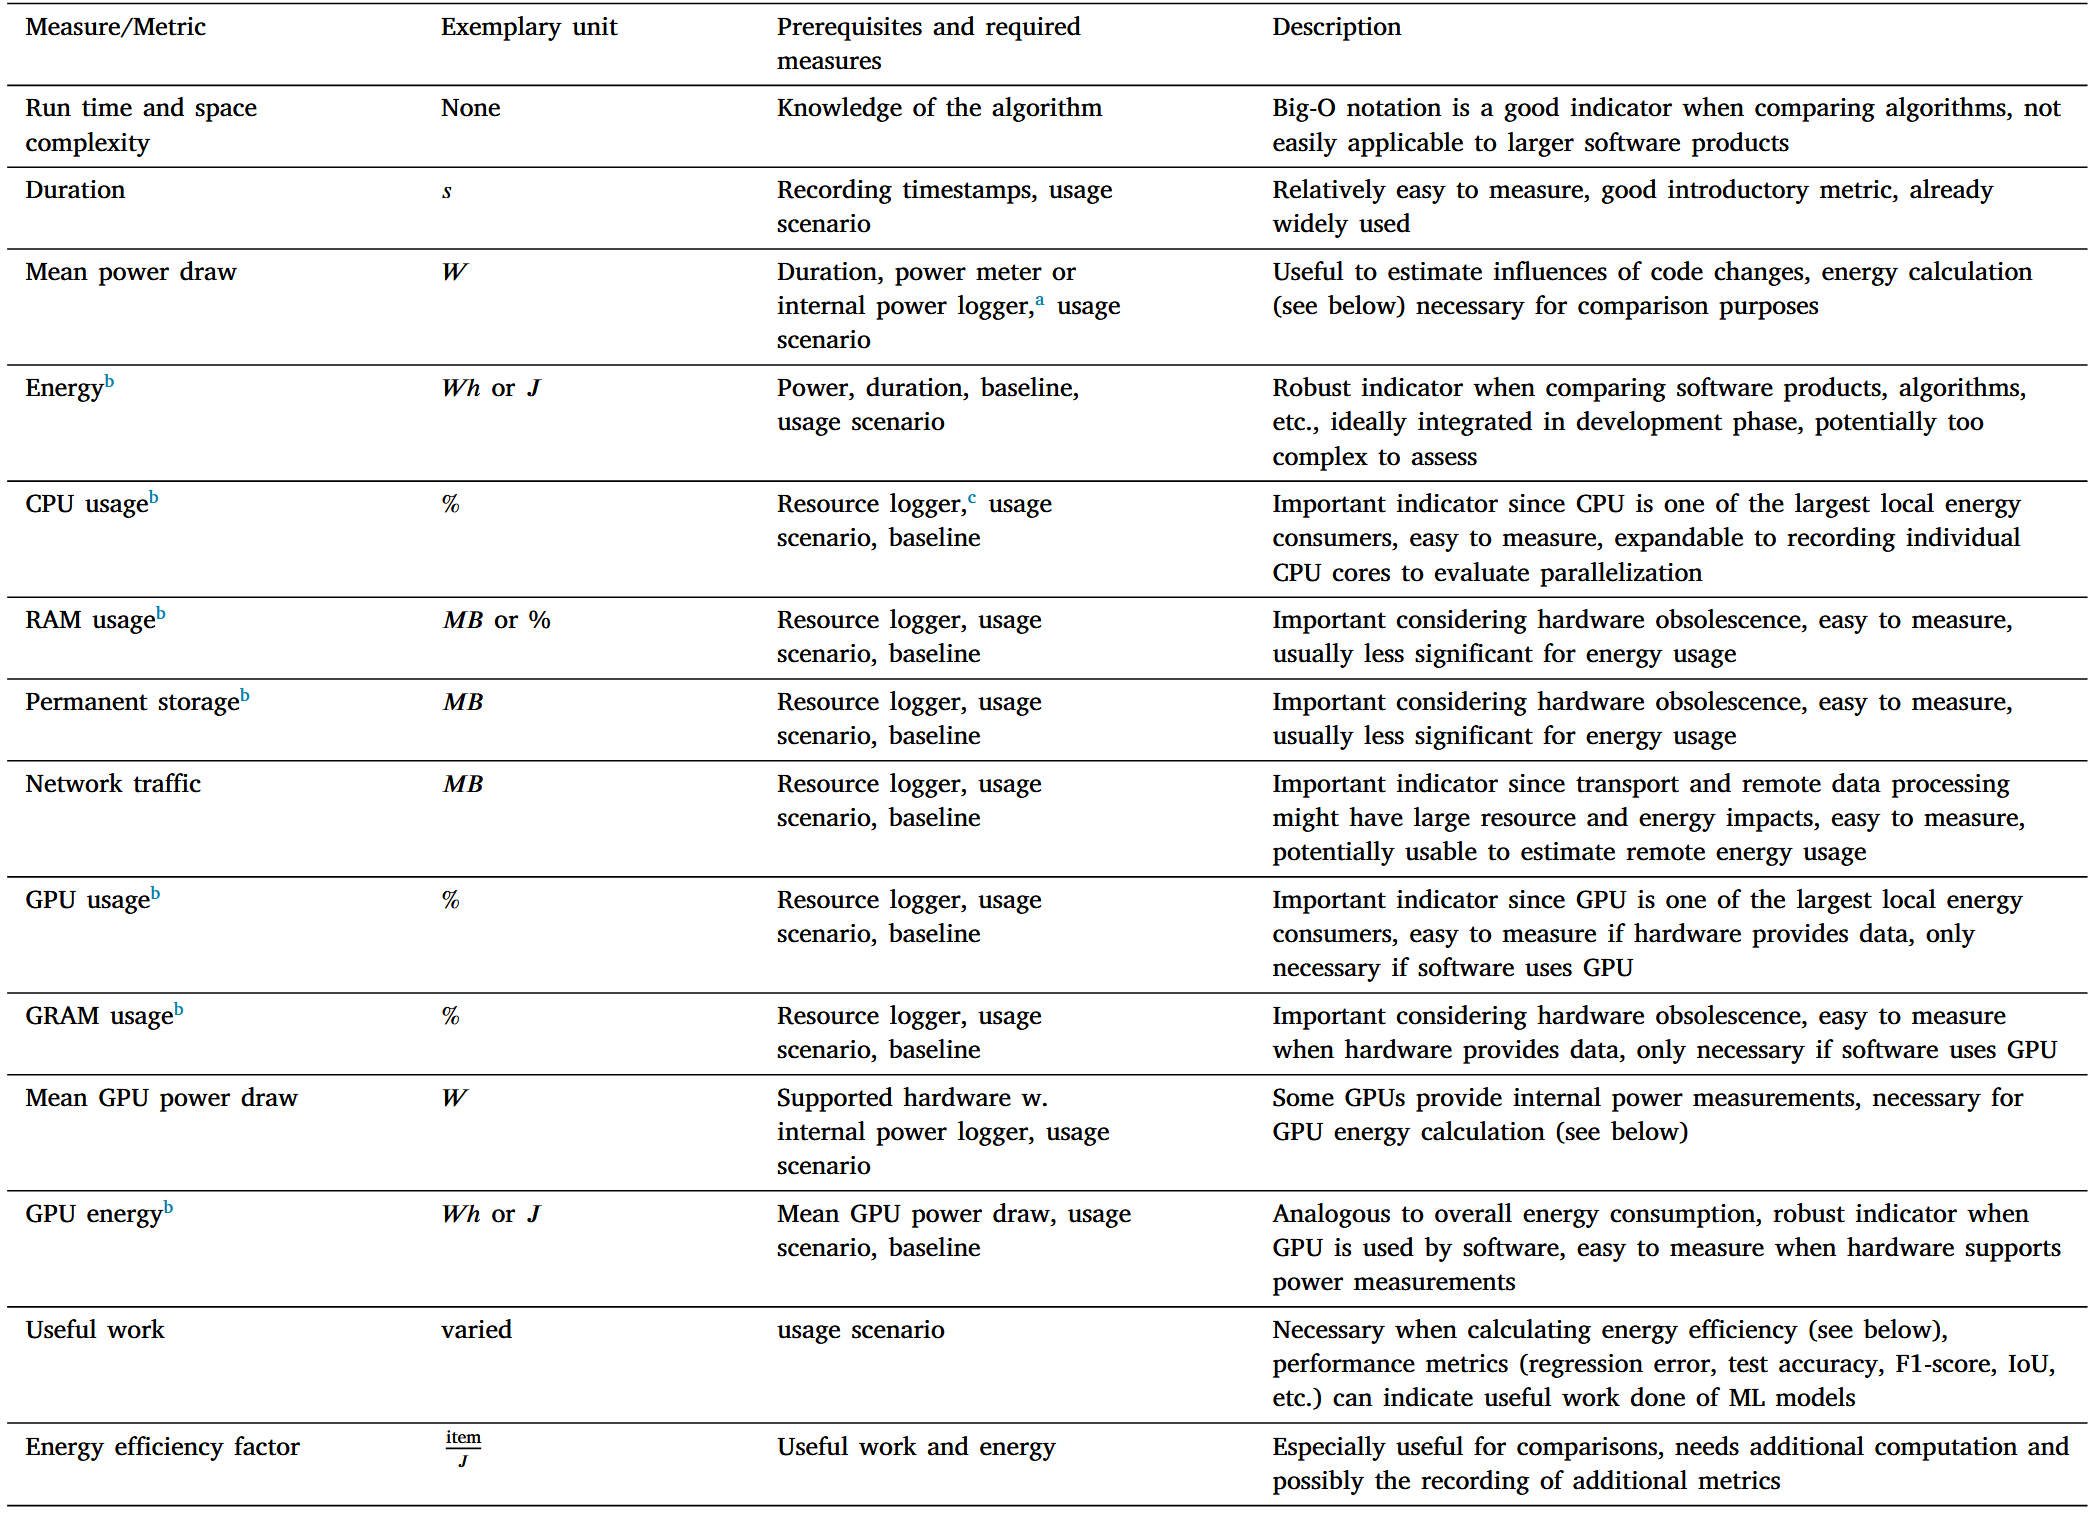
Overview of examples of relevant metrics.
a External power meters or PDUs, e. g., from Janitza https://www.janitza.com/energy-and-power-quality-measurement-products.html [2023-11-06], GUDE https://gude-systems. com/en/cat/power-distribution-units/ [2023-11-06], internal power loggers like RAPL and nvidia-smi.
b Software-induced metrics calculated by subtracting the according baseline measurements from the scenario measurements.
c Resource loggers include collectl (https://collectl.sourceforge.net/ [2023-11-06]), Windows performance monitor (https://techcommunity.microsoft.com/t5/ask-the-performance- team/windows-performance-monitor-overview/ba-p/375481 [2023-11-06]), wireshark (https://www.wireshark.org/ [2023-11-06]), and nvidia-smi.
Regarding energy efficiency metrics, it is necessary to define ‘‘useful work’’, as described, e. g., in Johann et al. [55]. This, of course, depends strongly on the software product and is not always feasible to define.
[55] T. Johann, M. Dick, S. Naumann, E. Kern, How to measure energy-efficiency of software: Metrics and measurement results, in: 2012 1st International Workshop on Green and Sustainable Software, GREENS 2012 - Proceedings, 2012, pp. 51–54, http://dx.doi.org/10.1109/GREENS.2012.6224256.
Examples from the methods are the number of created, read, changed, deleted, or transmitted data points, the number of executed operations, or benchmarks. The benefit of these metrics is that they make different implementations directly comparable. If the items cannot be easily defined, e. g., when measuring a complete software product like a word processor, a possibility to compare the efficiency of one software over the other is to make their outcomes as equal as possible (e. g., create the same PDF document with the word processors) and then perform, for instance, a t-test as described in Kern et al. [46] to test if the means of the samples are different and thus determine the more efficient software.
[46] E. Kern, L.M. Hilty, A. Guldner, Y.V. Maksimov, A. Filler, J. Gröger, S. Naumann, Sustainable software products — towards assessment criteria for resource and energy efficiency, Future Gener. Comput. Syst. 86 (2018) 199–210, http://dx. doi.org/10.1016/j.future.2018.02.044.
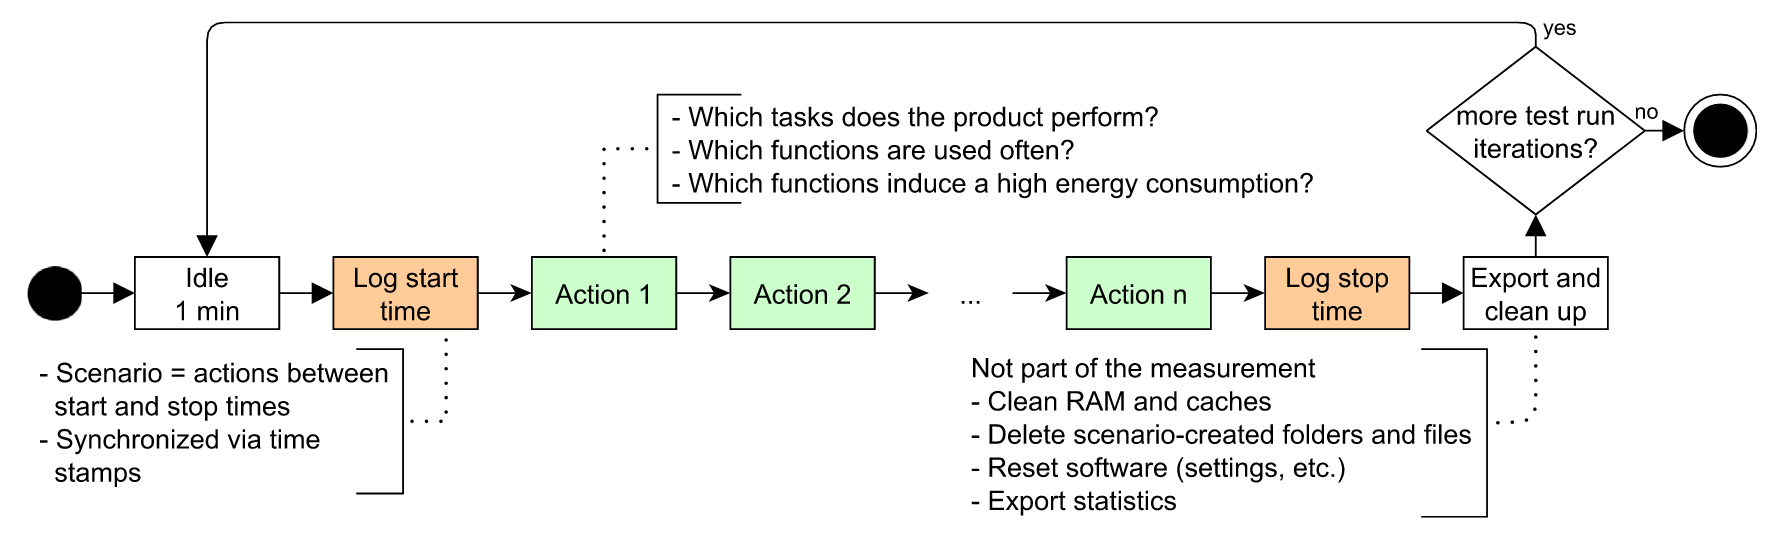
Fig. 2. Actions in usage scenario.
Typical steps from the methods that need to be addressed in component C are the definition of the measurement method, including repetitions, which tools (e. g., workload generator) to use or build, and which scenarios to devise (baseline without starting the software, idle mode of the inspected software, usage, load, long-term, etc.). When creating the scenarios from the specified measured object, there are also several aspects to take into account, including the kind (idle, load, etc.) and duration of the scenario, pre- and post-scenario operations like the handling of log files, and which actions to perform in which order. The scenario can then be constructed as in Fig. 2 or along already existing tests, such as unit, integration, UI, end-to-end tests, etc.
Many use cases from the referenced methods stipulate a scenario that is somehow automated and executed repeatedly to ensure reliable results. In statistics, a minimum sample size of 30 is recommended to ensure that the sampling distribution is close to the distribution of the population (as described in Kern et al. [46]).
The workload can be generated via software tools, like automation software or scripts, on the SuT, or directly from using the software, e. g., in continuous long-term measurements. If automation tools are used, baseline and idle measurements should be acquired with these tools active to later subtract their consumption from the results.
While white-box measurements usually require more effort to be put into the measurement procedure (e. g., setting up automated logging of individual actions, like library calls in Guldner et al. [40], or even code blocks as described in Verdecchia et al. [56]), they can also provide developers with in-depth insight into the consumption hot spots of their software.
[40] A. Guldner, S. Kreten, S. Naumann, Exploration and systematic assessment of the resource efficiency of machine learning, in: INFORMATIK 2021 - Computer Science and Sustainability, in: Lecture Notes in Informatics (LNI), 2021, pp. 287—299, http://dx.doi.org/10.18420/informatik2021-023.
[56] R. Verdecchia, R. Saez, G. Procaccianti, P. Lago, Empirical evaluation of the energy impact of refactoring code smells, in: 5th International Conference on Information and Communication Technology for Sustainability, (ICT4S), vol. 52, 2018, pp. 365–383, http://dx.doi.org/10.29007/dz83.
Black-box measurements on the other hand only require logging start and end-timestamps of the measurement and they are useful, for instance, when assessing a complete software product or tracking them over longer time periods such as over update cycles.
Another way of classifying scenarios is by their kind. Here, we differentiate between idle, standard usage, and load scenarios, as well as baselines. These scenario kinds are detailed in Kern et al. [46]. Idle scenarios can point to consumption hotspots when the software is simply being executed without (user) interactions, e. g., through repetitive background tasks, such as update services, indexing, etc. Standard usage scenarios are usually the most relevant. Here, the software is executed as if it was used as intended. If the scenario includes timestamps for individual actions (like GUI interactions, function calls, etc.), it can help to identify consumption hotspots in functionalities, startup and shutdown processes, etc. Load scenarios for distributed systems are useful for stress-testing the architectures with many (simulated) users, but can also consist of benchmarks, e. g., for databases, API calls, etc. Further usage scenarios can be defined along the life cycle of the software product and tailored to each software type. Examples from the referenced methods are installation and de-installation, the boot process, e. g., for operating systems, the training or inference phase of ML models, etc. The baseline is a special kind of scenario, and it is required by some methods. Here, only the necessary components to run the software product are active (device hardware and software stack), but the software product itself is not executed. Baselines can help when calculating software-induced consumption by subtracting the baseline measurements from, e. g., the usage scenario, resulting in only the overhead consumption induced by executing the scenario.
Using the specifications from the measurement method, metrics, and measured object, the measurement setup identifies the necessary hardware and software stack for the measurement in order to tailor them to the use case. This includes the hardware and software for the measurements themselves (SuT), the metering devices (if any, in case of software-based logging), required tools for logging, etc. The parameters that should be noted in the metadata here include the necessary hardware setup as well as methods used for data acquisition, tools, meters, etc. Furthermore, especially with power meters and measurement devices, their accuracy, sampling rate, settings, etc. should be noted to track possible errors in the evaluation.
Depending on the measurement goals and scenarios, it may be useful to calculate summary statistics such as mean values for the hardware usage and standard deviations for the scenario repetitions, or inferential statistics such as t-tests to compare the mean values of measurements, along with visualizations for the data such as tables, boxplots, or bar plots. Energy efficiency metrics and the energy consumption of the scenarios or actions should be calculated as the integral of the power draw over time, e. g., as detailed in Guldner et al. [57].
[57] A. Guldner, M. Garling, M. Morgen, S. Naumann, E. Kern, L.M. Hilty, Energy consumption and hardware utilization of standard software: Methods and measurements for software sustainability, in: From Science to Society, Springer, Cham, 2018, pp. 251–261.
The results should be logged in a meaningful way. For example, the energy consumption can be given in Joules for short measurements or when calculating the energy efficiency factor (e. g., transferred items per Joule), or in kWh for long and resource-intensive measurements like training ML-models.
The metadata should include the following information:
- the SuT, e. g., measurement device used, hardware and software setups, etc.;
- the measured object, e. g., version, software type, product group, system boundaries (especially in case of a distributed software);
- the scenario, e. g., its duration, repetitions, the pertaining life cycle phase, etc.;
- the evaluation, e. g., analysis method used, scripts or tools, etc.;
- quality issues, e. g., sampling frequency, threats to validity, mea- surement accuracy, etc.; as well as
- general data, e. g., date, time, stakeholders, etc.
One of the metadata items that is recommended to be recorded for each measurement is the threats to validity of the experiment, e. g., following the categorization in Wohlin et al. [49, p. 68] and applied in Ardito et al. [58]. Recording the threats to external, internal, construct, and conclusion validity enables reflection from an outside point of view, and allows for improvements of the method and future experiments (see also Cruz [59], who provides a guide to set up energy efficiency experiments and reduce errors).
[49] C. Wohlin, P. Runeson, M. Hst, M.C. Ohlsson, B. Regnell, A. Wessln, Experimentation in Software Engineering, Springer, 2012, p. 68, http://dx.doi.org/10.1007/978-3-642-29044-2.
An extensive list is available at https://gitlab.rlp.net/green-software-engineering/gsmm/-/blob/main/english/metadata_collection.md
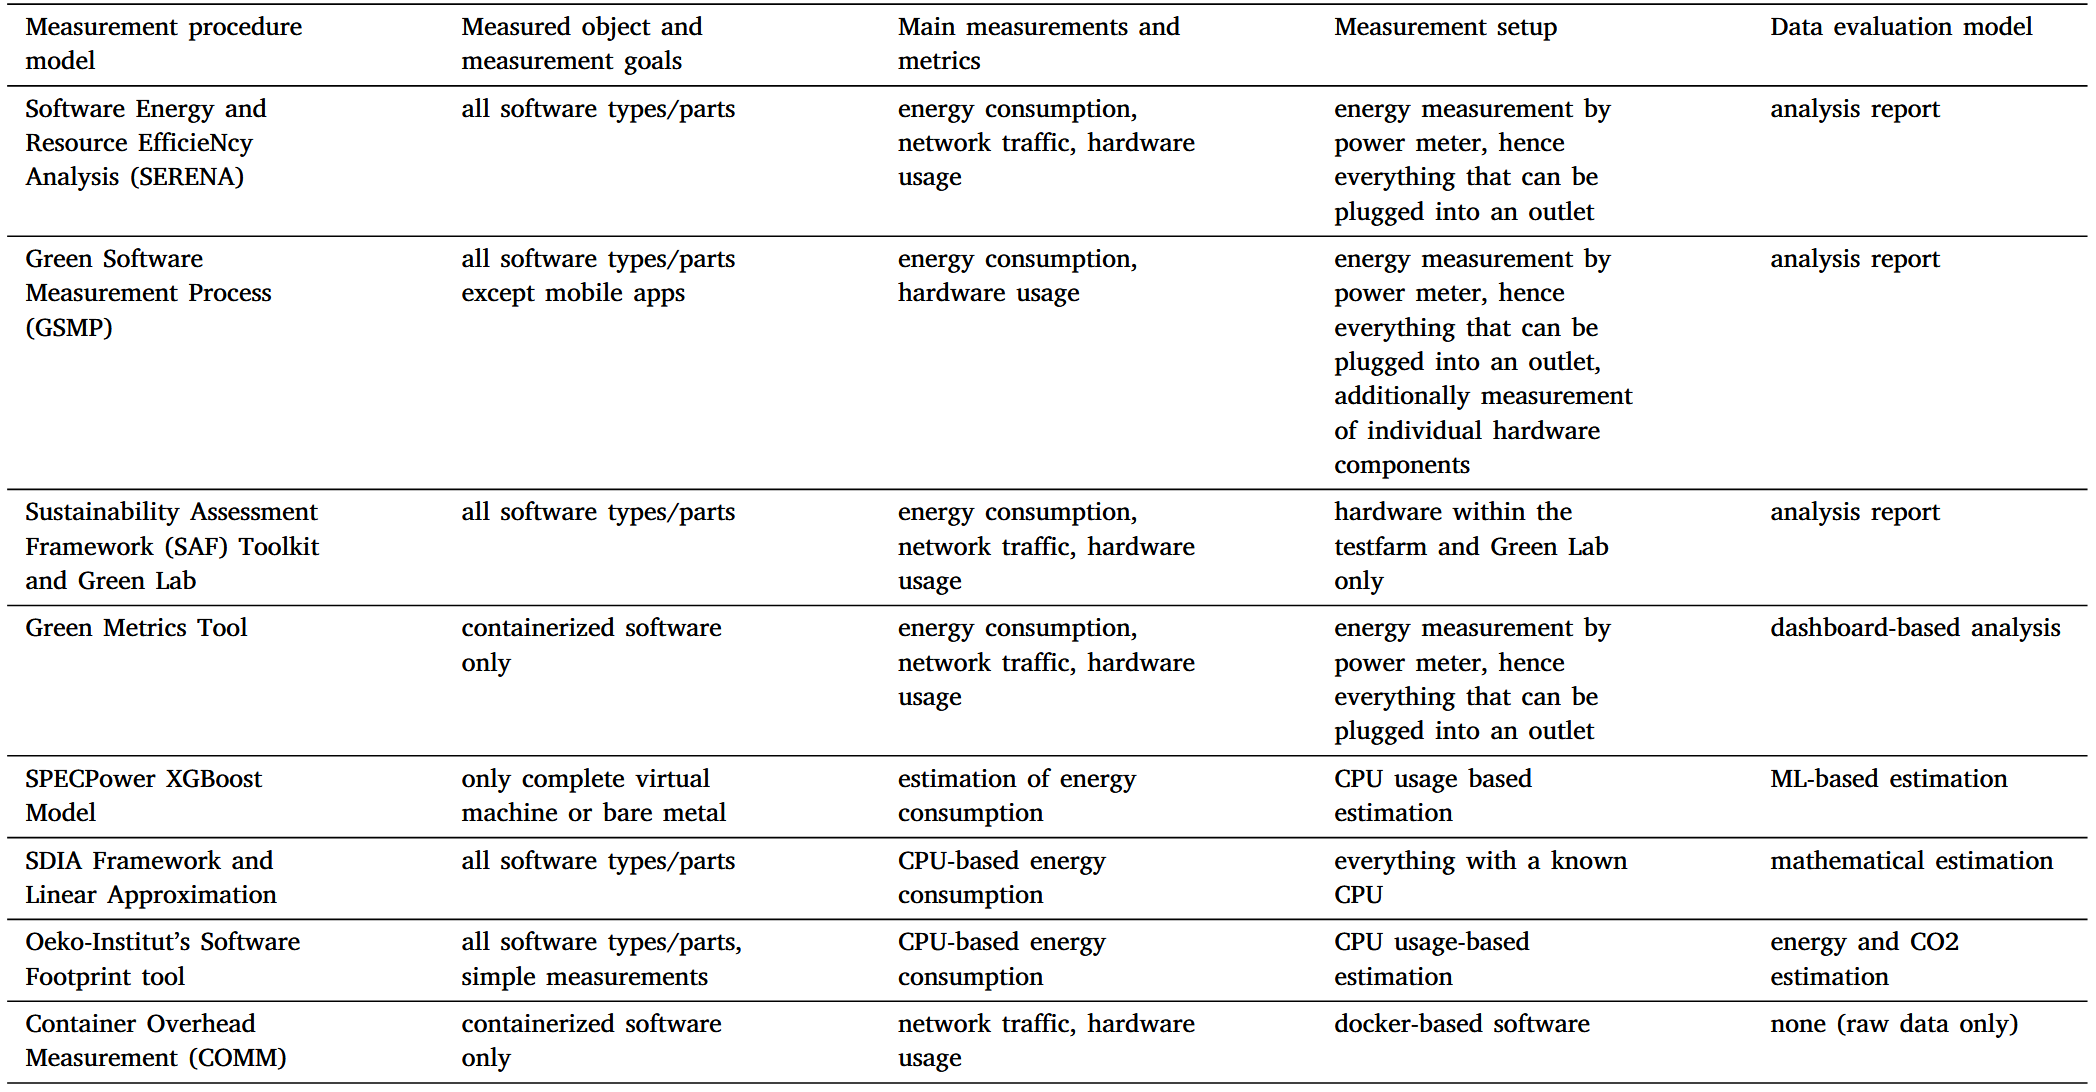
Categorization of exemplary measurement methods.
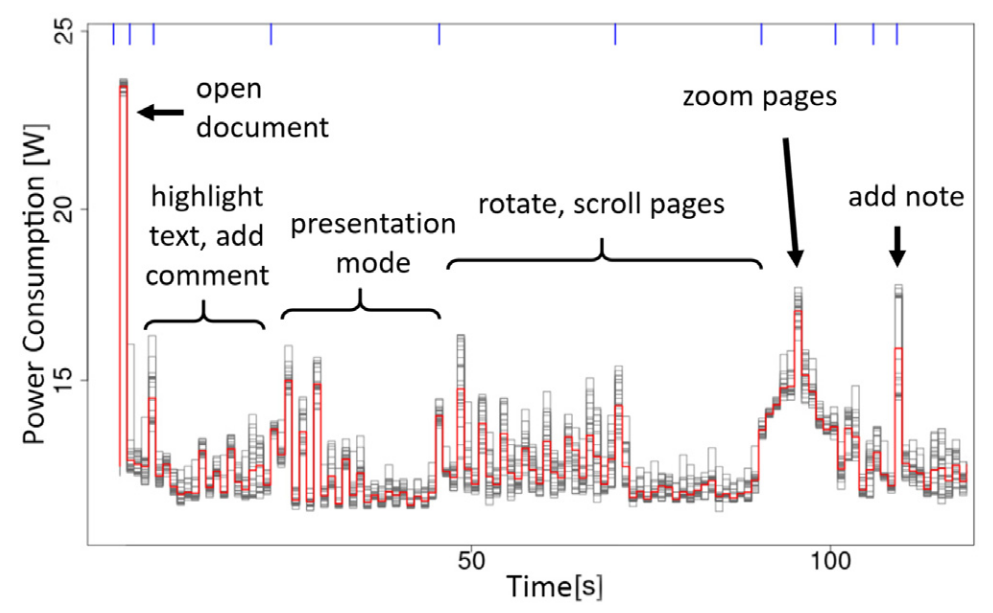
Fig. 4. Evaluation of Okular’s standard usage scenario with OSCAR (annotated with scenario actions).
The Green Metrics Tool (GMT) is a versatile energy measurement tool created by Green Coding Berlin. By isolating applications through containers in the measurement setup (D), it enables precise measurements of a multitude of factors like power, network, disk, and memory consumption.
The GMT can be run on various hardware configurations in reference to the measurement setup (D). When developing the usage scenario files or when precise measurements are not the key metric, a local environment is sufficient. For local developer setups without power-meters or RAPL access, Green Coding Berlin supplies a freeto-use measurement cluster. This has a specialized, no interruption GNU/Linux distribution installed and various hardware components for exact measurements.
As it is not always possible to run jobs in a controlled environment, Green Coding Berlin has developed a machine learning model that can estimate energy usage based on readily available input parameters. The model is based on a paper by Interact DC and the University of South London [51] and utilizes the SPECPower dataset to develop an XGBoost model for estimating the AC power draw of a server. This model accepts a variety of input parameters (e. g., from Table 1), with only CPU utilization being mandatory. Optional parameters include CPU chips, CPU threads, CPU cores, CPU frequency, CPU architecture, CPU make, release year, RAM, TDP, and vHost ratio.
The SDIA developed a set of formulas describing a general mathematical framework to derive a linear approximation through only CPU usage measurements (B), one of the most common proxies used in various tools and implementations. The measurements of the CPU usage and linear approximation thus serve as a rule-of-thumb and give an estimation methodology in even the most data-scarce scenarios, since most practical scenarios allow for measuring CPU usage. The linear approximation can be used for any type of software and SuT, as long as the Thermal Design Power (TDP) of the CPU is known (D). Given ceteris paribus, one would measure CPU before, throughout, and after running a particular program and deduce the energy consumed related to the program afterward.
It must be taken into account that software is always connected to the underlying hardware and that this can also be a distributed system. There, the software is spread over several nodes or triggers complex data exchange processes over several network types. A certain comparability of different products can be achieved via metrics such as ‘‘useful work done per Joule’’, provided that this ‘‘useful work’’ can be specified in a comparable way. It should also always be considered that used technologies such as databases, frameworks, and SDKs are error sources that can hinder exact comparisons [75]. Accordingly, the model defines guard rails as to what such measurement procedures can entail, such as keeping all other influencing factors equal and only exchanging the part that is of interest.
[75] D. Junger, V. Wohlgemuth, E. Kammer, Conception and test of a measuring station for the analysis of the resource and energy consumption of material floworiented environmental management information systems (EMIS), in: EnviroInfo 2022, Gesellschaft für Informatik e.V., Bonn, 2022, p. 211.