Chasing carbon: the elusive environmental footprint of computing
Status:: 🟩
Links:: Carbon Footprint of ICT Devices Low-Carbon Data Centers
Metadata
Authors:: Gupta, Udit; Kim, Young Geun; Lee, Sylvia; Tse, Jordan; Lee, Hsien-Hsin S.; Wei, Gu-Yeon; Brooks, David; Wu, Carole-Jean
Title:: Chasing carbon: the elusive environmental footprint of computing
Publication Title:: "IEEE Micro"
Date:: 2022
URL:: https://ieeexplore.ieee.org/document/9744492
DOI:: 10.1109/MM.2022.3163226
Gupta, U. et al. (2022) ‘Chasing carbon: the elusive environmental footprint of computing’, IEEE Micro, 42(4), pp. 37–47. Available at: https://doi.org/10.1109/MM.2022.3163226.
Related:: @Gupta.etal.2021.ChasingCarbon
Given recent algorithm, software, and hardware innovation, computing has enabled a plethora of new applications. As computing becomes increasingly ubiquitous, however, so does its environmental impact. This article brings the issue to the attention of computer-systems researchers. Our analysis, built on industry-reported characterization, quantifies the environmental effects of computing in terms of carbon emissions. Broadly, carbon emissions have two sources: operational energy consumption, and hardware manufacturing and infrastructure. Although carbon emissions from the former are decreasing, thanks to algorithmic, software, and hardware innovations that boost performance and power efficiency, the overall carbon footprint of computer systems continues to grow. This work quantifies the carbon output of computer systems to show that most emissions related to modern mobile and data-center equipment come from hardware manufacturing and infrastructure. We, therefore, outline future directions for minimizing the environmental impact of computing systems.
Notes & Annotations
Color-coded highlighting system used for annotations
📑 Annotations (imported on 2024-07-10#18:02:55)
Given the advancements in energy efficiency, this article shows computer system and architecture researchers must go beyond energy and consider the carbon footprint of platforms end-to-end.
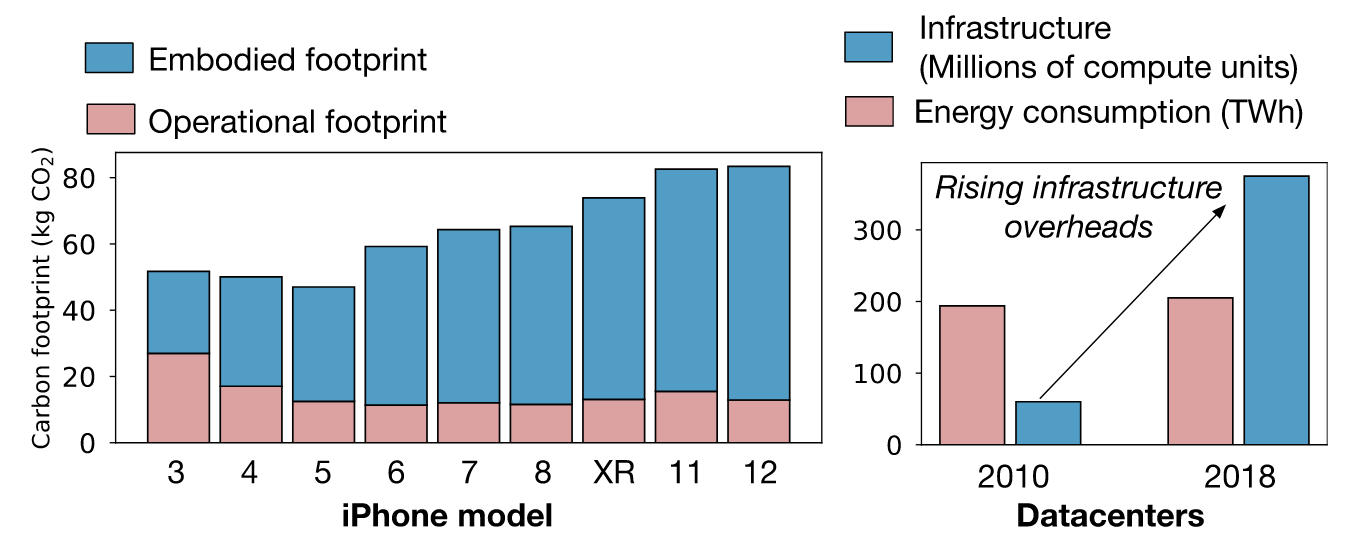
FIGURE 1. Majority of computing’s carbon footprint comes from embodied emissions not operational energy use. From iPhone 3 to iPhone 12, the operational footprint reduced by 2.09 given efficiency optimizations while the embodied emissions rose by 2.85 due to higher manufacturing overheads. Between 2010 and 2018, the operational energy consumption of data centers increased by only 6% collectively while the number of compute instances, i.e., infrastructure overheads, increased by 6.
In contrast, Figure 1 (right) shows the carbon footprint breakdown for data centers. At the data-center scale, we find operational emissions between 2010 and 2018 have increased by 6% while infrastructure capacity, which correspond to embodied hardware emissions, has increased by 6 .
Wrong. The figure doesn't show the carbon footprint breakdown of data centers. Instead it shows the energy consumption of data centers. The 6 % increase is electricity not operational emissions. The change in operational emissions is unknown based on the used source (Masanet et al. 2020).
Fabs need copious energy to manufacture chips. Energy consumption produces over 63% of the emissions from manufacturing 12-in wafers at TSMC.10 Fab energy consumption is expected to rise with more advanced process technology nodes.
The design, testing, and manufacture of individual components (e.g., CPUs, SoCs, DRAM, and HDD/ SSD storage) spreads across many technology companies. Furthermore, mobile devices comprise displays, batteries, sensors, and cases that contribute to their carbon footprint. Similarly, data centers comprise rack infrastructure, networking, and cooling systems; data center construction is yet another factor.
This article uses accredited and publicly reported LCAs from industry, including Apple, Google, and Microsoft.
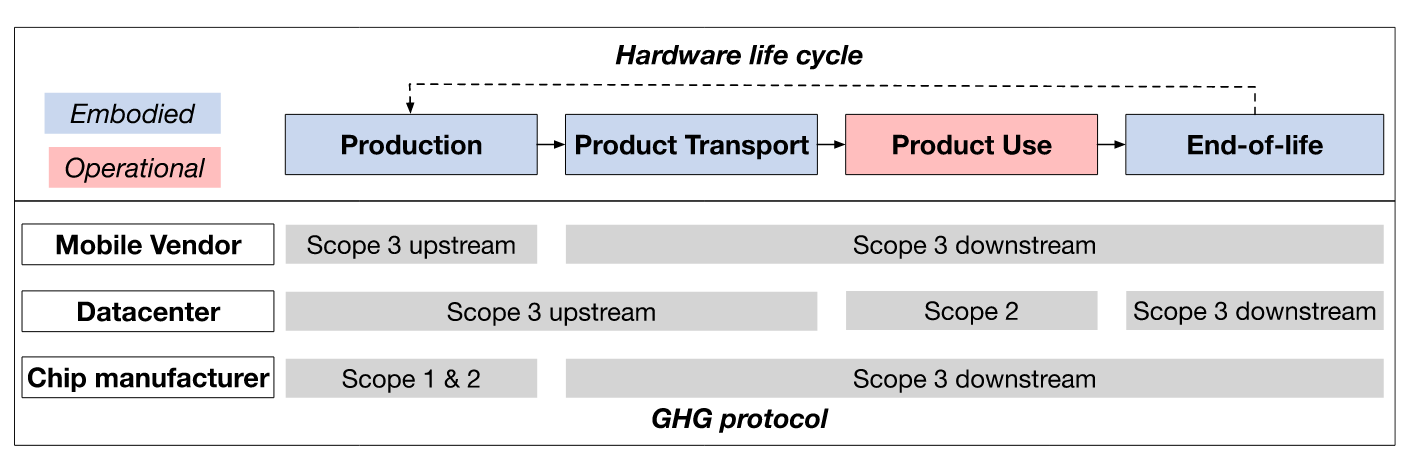
FIGURE 2. Hardware life cycle (top) includes production, transport, use, and end-of-life processing. Operational carbon emissions are based on use; embodied emissions results are from aggregating production/manufacturing, transport, and end-of-life processing. The bottom show how the GHG protocol for mobile vendors, data center operators, and chip manufacturers relates to life cycles.
Manufacturing dominates emissions for battery-powered devices, whereas operational energy consumption dominates emissions from always-connected devices.
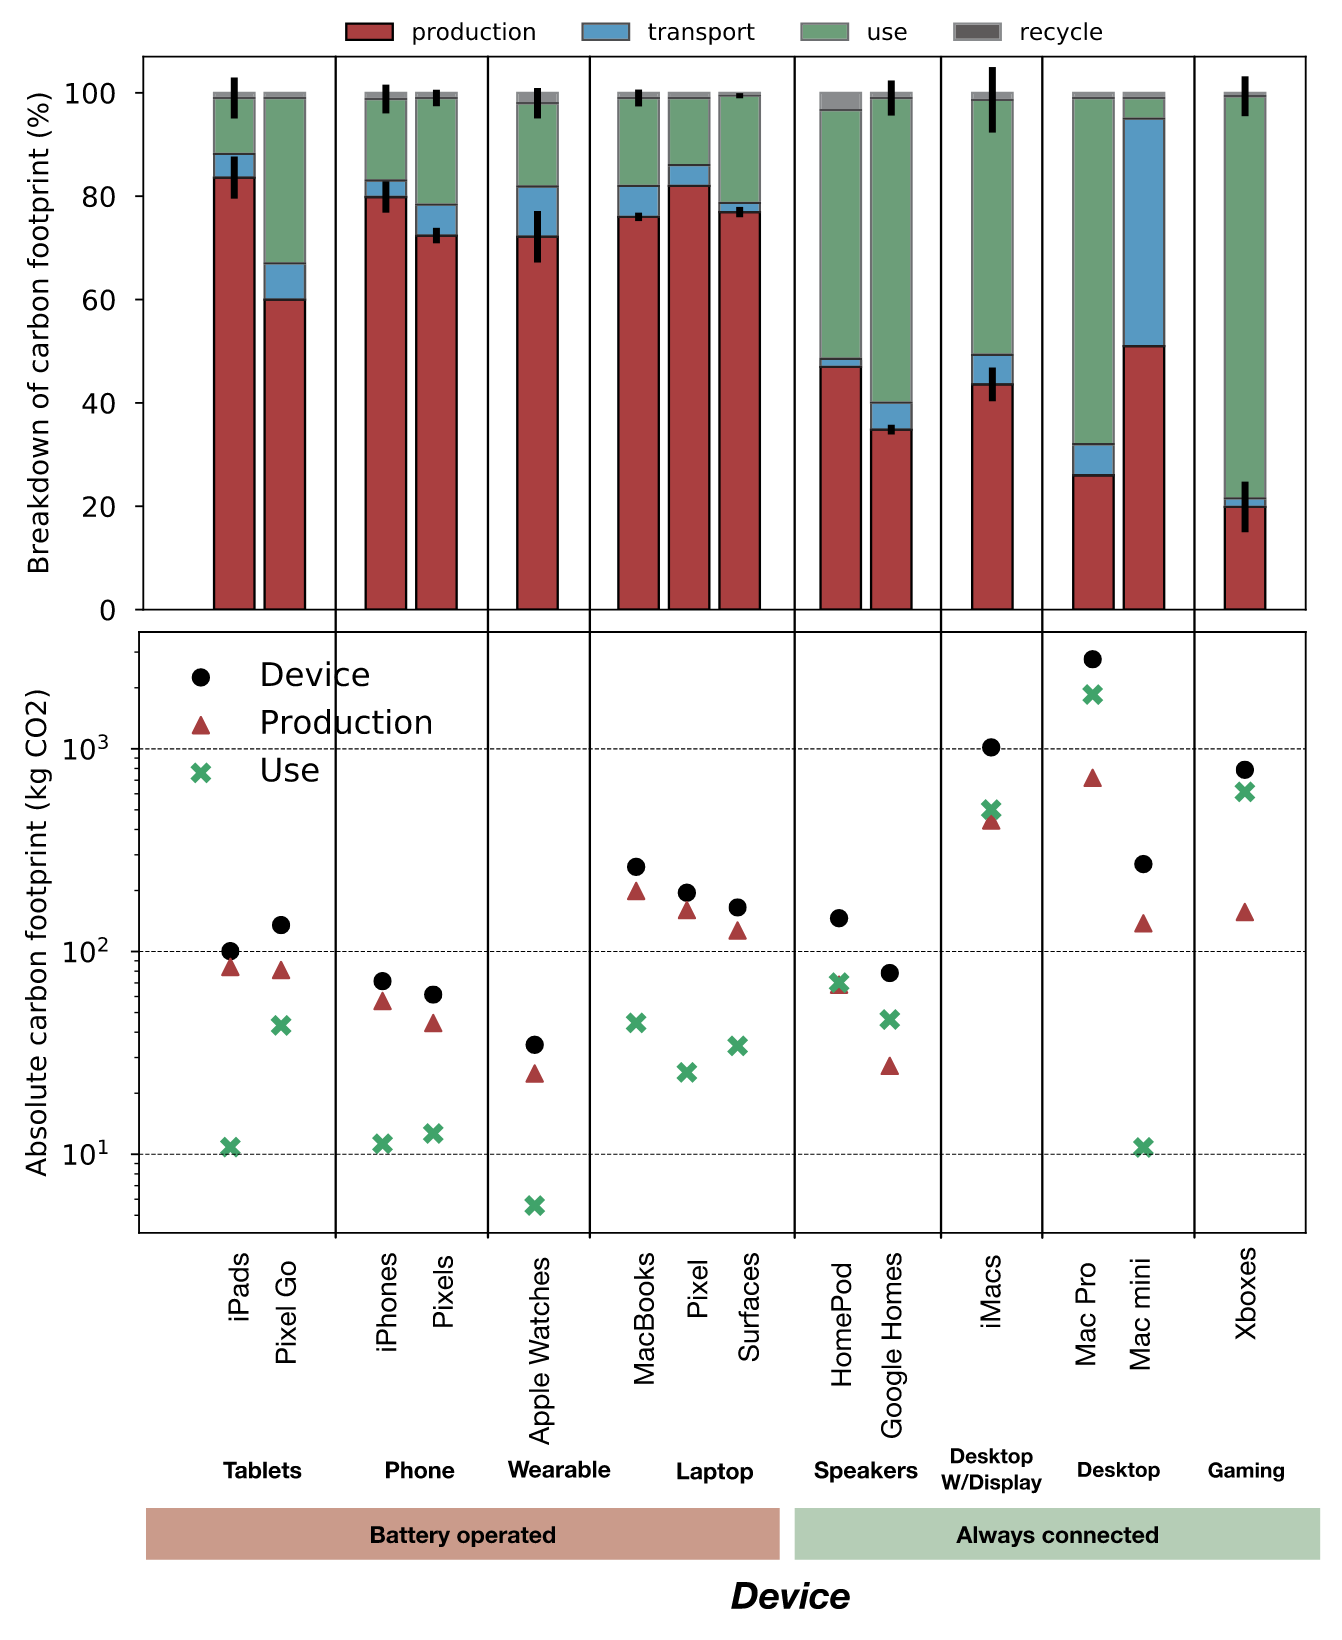
FIGURE 3. Breakdown of carbon emissions for various Apple, Google, and Microsoft personal-computing platforms. As the top chart shows, hardware manufacturing dominates the carbon output for battery-powered devices (e.g., phones, wearables, and tables); most emissions for always connected devices (e.g., laptops, desktops, and game consoles) come from product use. The bottom chart shows the absolute carbon output of battery powered and always connected devices. Overall, carbon footprint (total, manufacturing, and use) is variable and scales with the platform.
Given the energy-efficiency improvements from software and hardware innovation over the last decade, amortizing the manufacturing carbon output requires continuously operating mobile devices for three years—beyond their typical lifetime.
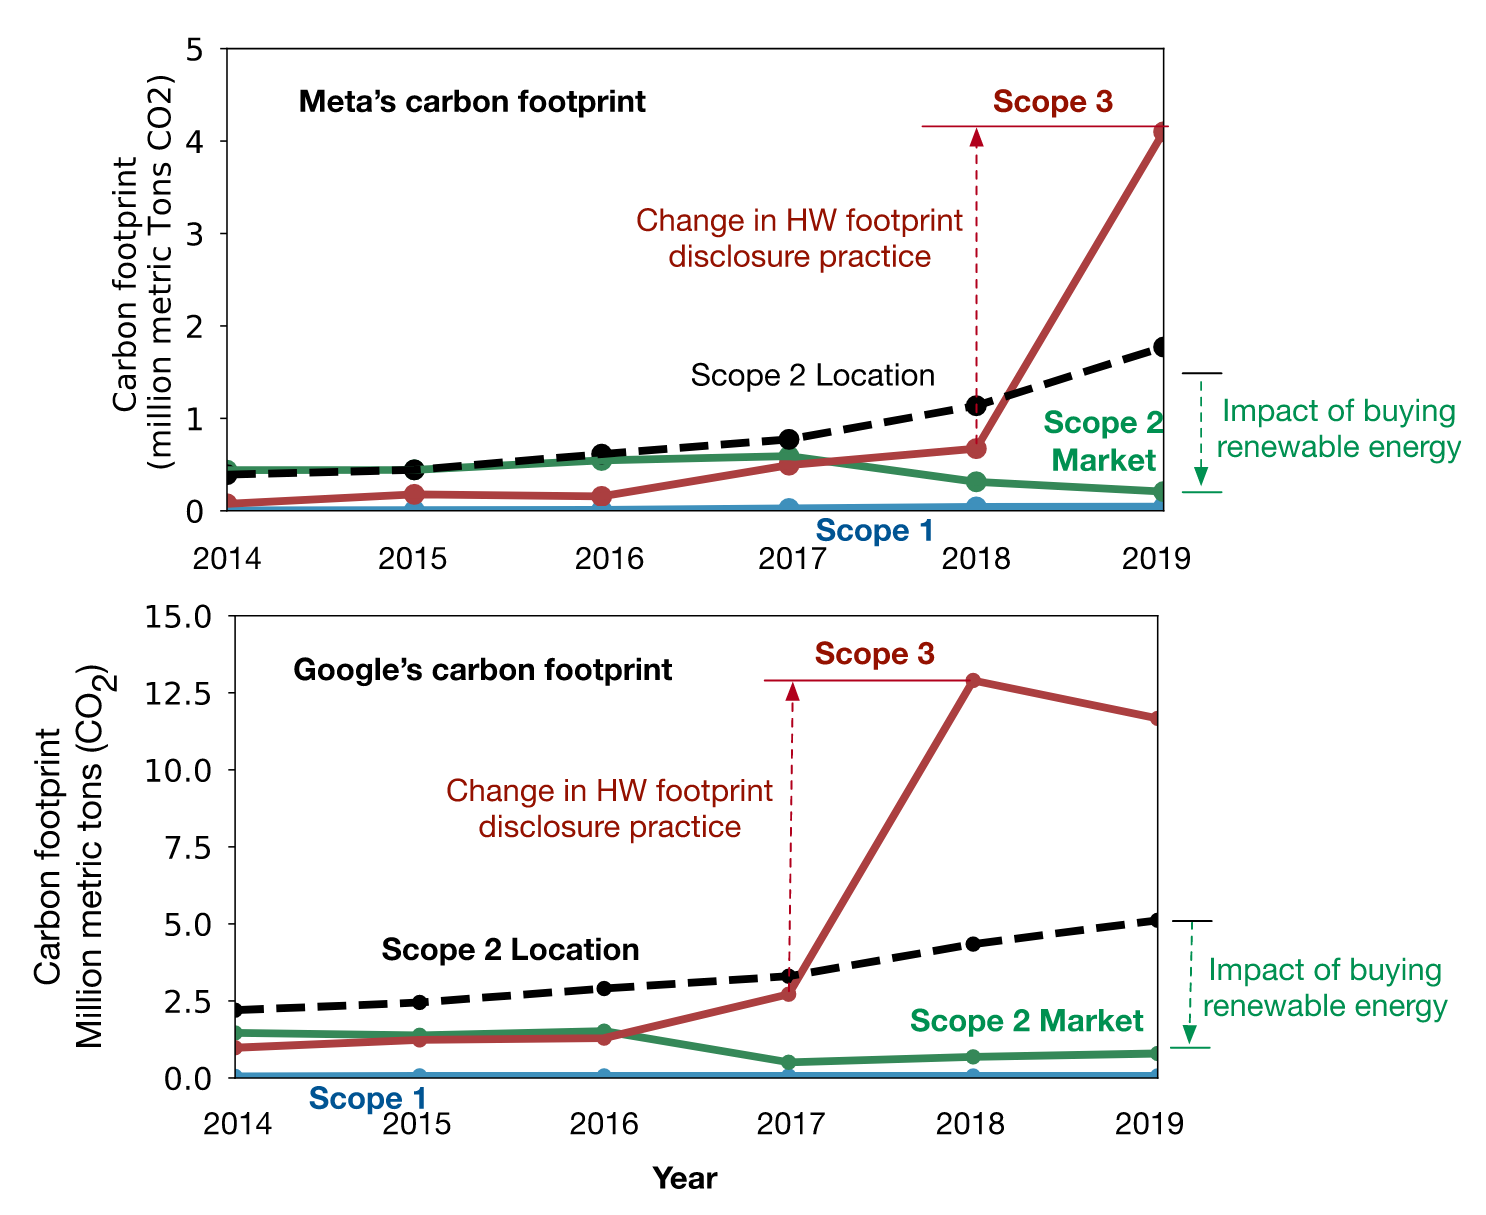
FIGURE 5. Carbon footprint of Meta and Google (two large data-center operators). As data centers increasingly rely on renewable energy, carbon emissions originate more from scope 3, or supply-chain emissions (e.g., hardware manufacturing and construction).
Analyzing the most recent data, scope 3 comprises the majority of emissions for both Google and Meta. In 2018, Google reported 21 higher scope 3 emissions than scope 2 emissions—that is, 14,000,000 metric tons of CO2 versus 684,000. In 2019, Meta reported 23 higher scope 3 emissions than scope 2 emissions—that is, 5,800,000 metric tons of CO2 versus 252,000.
A large fraction of scope 3 emissions are from data-center CapEx overhead, such as construction and hardware manufacturing. In 2019, Meta reported capital goods—a combination of construction and hardware manufacturing for servers—account for half of its scope 3 emissions.
Although overall data-center energy consumption has risen over the past five years, carbon emissions from operational energy consumption have fallen. The primary factor contributing to the growing gap between data-center energy consumption and carbon output is the use of renewable energy.
That's only the case if market-based emissions are used. If location-based emissions are considered, the emissions from operational energy consumption are rising.
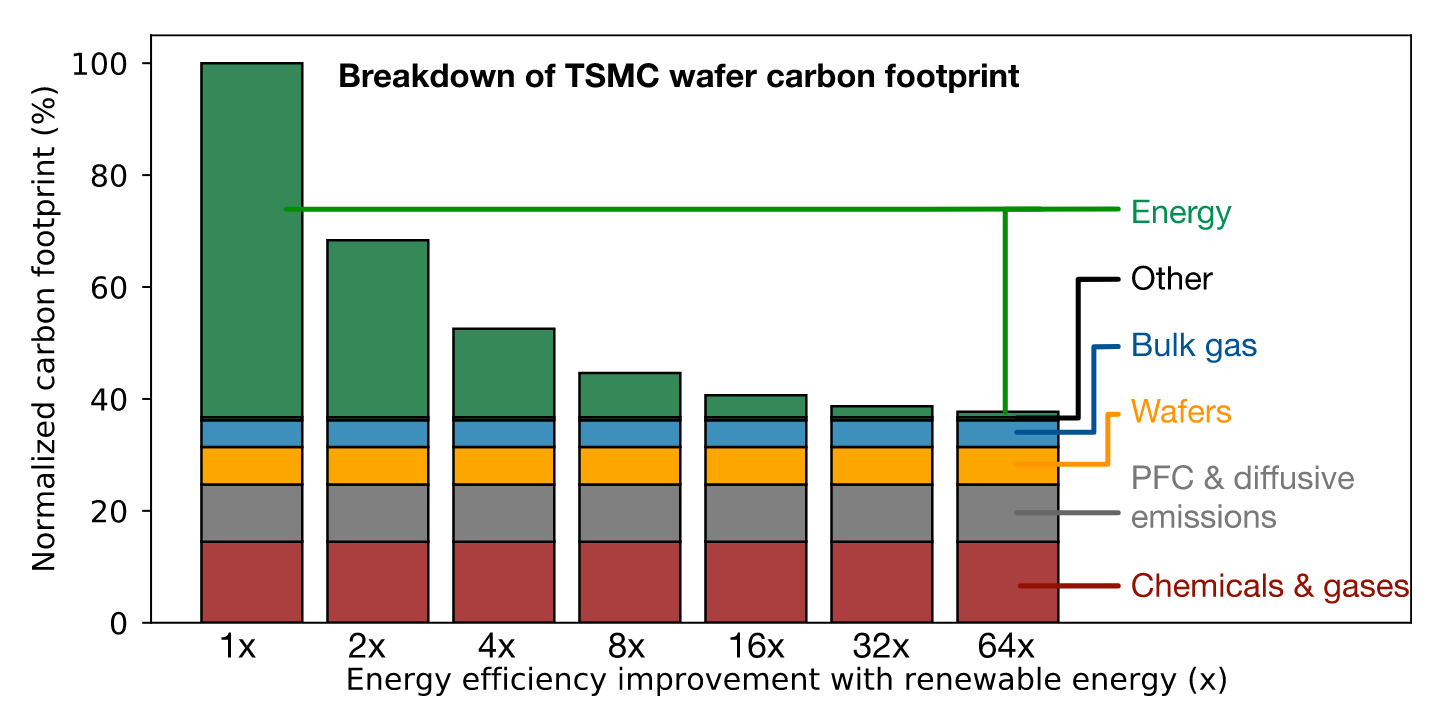
FIGURE 6. Carbon-emissions breakdown for TSMC wafer manufacturing. Renewable energy provides up to a 64 reduction in emissions from electricity, and overall emissions for wafers drops by 2.7 . Although the reduction will reduce the carbon output of manufacturing, consideration of CapEx-related emissions for mobile and data-center hardware will remain important.
As Figure 6 shows, a 64 boost in renewable energy reduces the overall carbon output by roughly 2.7 , an ambitious goal. By 2025, TSMC estimates renewable energy will produce 20% of the electricity that drives forthcoming 3-nm fabs.
Application- and algorithm-level optimizations can reduce both operational and embodied emissions. For example, at the datacenter scale, reducing application-level demands directly lowers power and infrastructure capacity devoted to services.