An experimental comparison of software-based power meters: focus on CPU and GPU
Status:: 🟩
Links:: Measure energy consumption of software RAPL Scaphandre perf Measure energy consumption at source code level#CodeCarbon PowerAPI
Metadata
Authors:: Jay, Mathilde; Ostapenco, Vladimir; Lefevre, Laurent; Trystram, Denis; Orgerie, Anne-Cécile; Fichel, Benjamin
Title:: An experimental comparison of software-based power meters: focus on CPU and GPU
Date:: 2023
URL:: https://ieeexplore.ieee.org/document/10171575
DOI:: 10.1109/CCGrid57682.2023.00020
Bibliography
Jay, M., Ostapenco, V., Lefevre, L., Trystram, D., Orgerie, A.-C., & Fichel, B. (2023). An experimental comparison of software-based power meters: Focus on CPU and GPU. 2023 IEEE/ACM 23rd International Symposium on Cluster, Cloud and Internet Computing (CCGrid), 106–118. https://doi.org/10.1109/CCGrid57682.2023.00020
Zotero
Type:: #zotero/conferencePaper
Zotero::
Keywords:: [Energy consumption, Energy Efficiency, Measurement, RAPL]
Relations
Abstract
The global energy demand for digital activities is constantly growing. Computing nodes and cloud services are at the heart of these activities. Understanding their energy consumption is an important step towards reducing it. On one hand, physical power meters are very accurate in measuring energy but they are expensive, difficult to deploy on a large scale, and are not able to provide measurements at the service level. On the other hand, power models and vendor-specific internal interfaces are already available or can be implemented on existing systems. Plenty of tools, called software-based power meters, have been developed around the concepts of power models and internal interfaces, in order to report the power consumption at levels ranging from the whole computing node to applications and services. However, we have found that it can be difficult to choose the right tool for a specific need. In this work, we qualitatively and experimentally compare several software-based power meters able to deal with CPU or GPU-based infrastructures. For this purpose, we evaluate them against high-precision physical power meters while executing various intensive workloads. We extend this empirical study to highlight the strengths and limitations of each software-based power meter.
Notes & Annotations
📑 Annotations (imported on 2023-12-01#09:04:23)
As the global available energy is limited and the demand for ICT technologies is in constant growth, the energy efficiency of data centers and cloud services is a growing concern. In such a perspective, developers, users, and data center managers need to better understand the impacts of their activities and be aware of their environmental footprint. Whether it is a data scientist trying to understand the energy consumption of her/his GPU while performing AI model training, a data center manager wanting to perceive the consumption of CPU and RAM-intensive cloud workloads, or a user wishing to understand the power consumption of her/his laptop, energy and power measurement needs are numerous.
The most mature and less intrusive way to estimate the power consumption of a computing node is through the use of physical power meters. But they require the deployment of an additional measuring infrastructure.. In addition, data must be collected and made available using specific software often imposed by the power meter supplier. Finally, a physical power meter only measures the overall consumption of the computing node. It does not detail the consumption of the various components or services launched on this computing node.
On the other hand, numerous power models and internal interfaces have been developed in order to provide consumption metrics at multiple levels. They are able to provide energy consumption data with granularities ranging from the overall consumption of the computing node to the consumption of a single operating system process. Moreover, these technologies are already available or can be implemented on already existing systems, not requiring any additional financial investment or specific hardware setup.
The software-based power meters studied in this section are based on Intel RAPL and Nvidia NVML, which only include the consumption of the CPU, DRAM, or/and GPU components. The consumption of other components, such as fans, storage, and network interfaces, is not included.
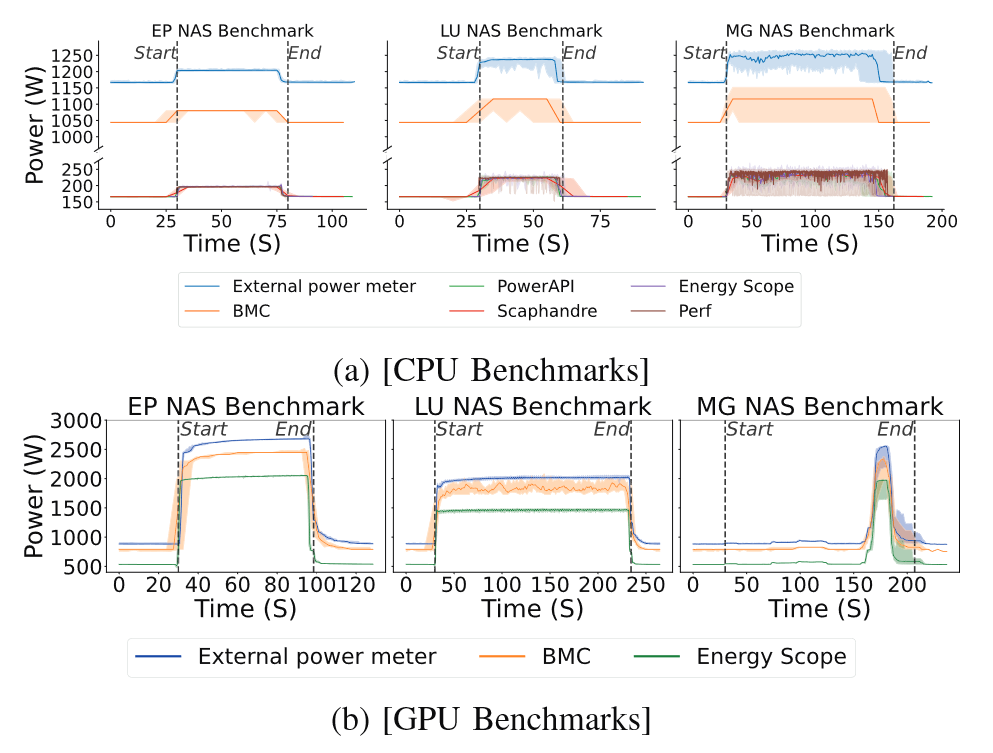
Figure description:
Power profiles provided by Energy Scope, Scaphandre, Perf, PowerAPI, BMC, and the External power meter on both the CPU and GPU benchmarks.
Both figures show that the evolutions of the benchmarks are well captured by each tool. However, each tool captures them differently. Tools with a higher acquisition frequency like Perf, Energy Scope, PowerAPI, and external power meter better capture consumption changes when running the benchmark, resulting in a more precise power profile. While tools with low acquisition frequency like Scaphandre and the BMC are not able to capture all consumption details and will therefore give a less accurate power profile.
For CPU benchmarks, almost all studied tools report similar energy consumption on every benchmark, except Code Carbon and online energy calculators (Green Algorithm, ML CO2 Impact). Code Carbon tends to report power consumption values almost twice as high as other tools based on the same interface for obtaining consumption values (Intel RAPL).
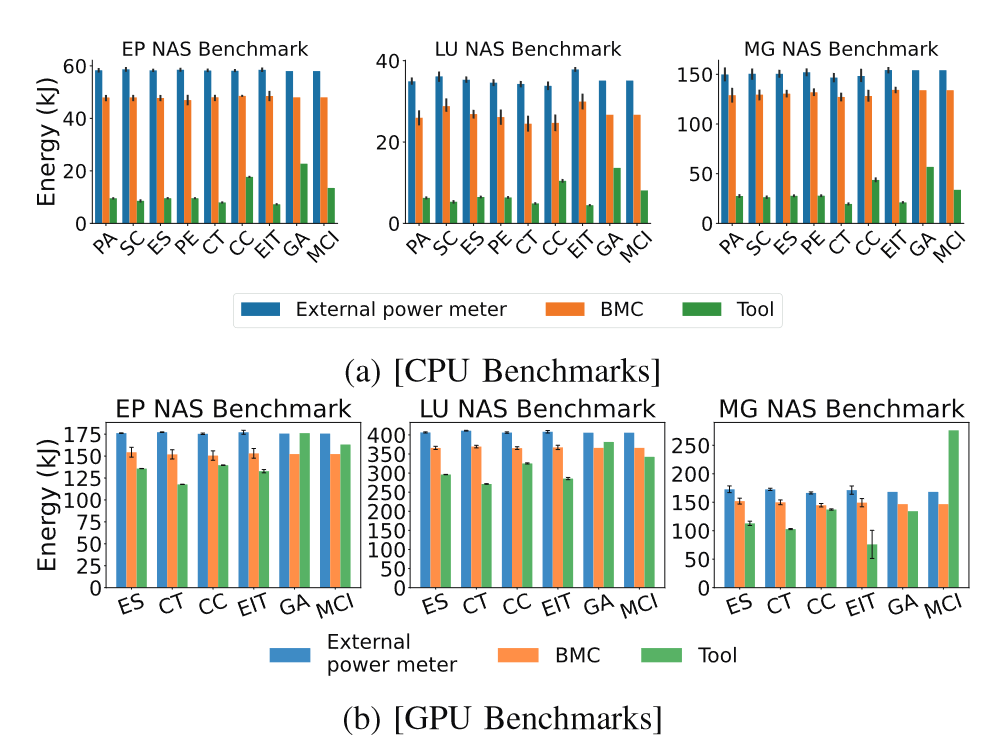
Figure description:
Total energy consumed by the benchmarks as reported by the power meters. Tools: PowerAPI (PA), Scaphandre (SC), Energy Scope (ES), Perf (PE), Carbon Tracker (CT), Code Carbon (CC), Experiment Impact Tracker (EIT), Green Algorithm (GA), ML CO2 Impact (MCI)
The energy overheads of each studied tool are mostly insignificant. We obtain an energy overhead under 1% on average with a maximum of around 2% for both CPU and GPU benchmarks. Only Scaphandre (0.85%), Carbon Tracker (0.76%), and Experiment Impact Tracker (0.68%) are, on average, slightly outside the expected range of variation.
The only tools supporting power estimation at individual process granularity are PowerAPI and Scaphandre. PowerAPI uses the performance event-based regression modeling described in Section II-A4b while Scaphandre uses the usagebased process-level modeling described in Section II-A4b.
When the objective is to reduce the amount of energy needed to execute a workload, any energy calculator, energy measurement software package, Energy Scope, or Perf can be used since they all report the energy.
If one wants to monitor power consumption in real time, PowerAPI, Scaphandre and Perf are the only available choices.
Readers could also be interested in monitoring cloud services, for which process-level estimation is required. We have seen that both PowerAPI and Scaphandre have this functionality. They mostly give similar results for process-level estimation with a slight discrepancy when estimating multiple RAM-intensive processes running in parallel. Scaphandre is able to estimate more processes running in parallel and it has a less complicated and more intuitive setup process for working in a virtualized environment.
Whether the workload to study is a long-running job or short execution is of importance. Monitoring short executions demand a high sampling frequency. Energy Scope and Perf have the highest maximum sampling frequencies. PowerAPI, Perf, and Scaphandre allow the configuration of the sampling frequency, with Perf and PowerAPI having the more extensive available ranges.
For workloads relying on GPU computations like machine learning algorithms, Carbon Tracker, Code Carbon, Energy Scope and Experiment Impact Tracker are suitable fits.
Finally, when looking for a tool easy to use and when the precision is not critical, we would recommend Green Algorithms or ML CO2 Impact as they don’t require any additional development or tool installation.