Investigating differences in response time and error rate between a monolithic and a microservice based architecture
Status:: 🟩
Links:: Microservices vs. Monolith
Metadata
Authors:: Johansson, Gustav
Title:: Investigating differences in response time and error rate between a monolithic and a microservice based architecture
Date:: 2019
URL:: https://www.diva-portal.org/smash/record.jsf?pid=diva2:1375027
DOI::
Johansson, G. (2019). Investigating differences in response time and error rate between a monolithic and a microservice based architecture (Master Thesis 2019:622, KTH, School of Electrical Engineering and Computer Science (EECS) / KTH, School of Electrical Engineering and Computer Science (EECS); p. 13). https://www.diva-portal.org/smash/record.jsf?pid=diva2:1375027
With great advancements in cloud computing, the microservice architecture has become a promising architectural style for enterprise software. It has been proposed to cope with problems of the traditional monolithic architecture which includes slow release cycles, limited scalability and low developer productivity. Therefore, this thesis aims to investigate the affordances and challenges of adopting microservices as well as the difference in performance compared to the monolithic approach at one of Sweden’s largest banks, SEB - the Scandinavian Individual Bank. The investigation consisted of a literature study of research papers and official documentation of microservices. Moreover, two applications were developed and deployed using two different system architectures - a monolithic architecture and a microservice architecture. Performance tests were executed on both systems to gather quantitative data for analysis. The two metrics investigated in this study were response time and error rate. The results indicate the microservice architecture has a significantly higher error rate but a slower response time than the monolithic approach, further strengthening the results of Ueda et. al. [47] and Villamizar et. al. [48]. The findings have then been discussed with regards to the challenges and complexity involved in implementing distributed systems. From this study, it becomes clear the complexity shifts from inside the application out towards infrastructure with a microservice architecture. Therefore, microservices should not be seen as a silver bullet. Rather, the type of architecture is highly dependent on the scope of the project and the size of the organization.
Notes & Annotations
Color-coded highlighting system used for annotations
📑 Annotations (imported on 2024-03-24#10:28:37)
If implemented correctly, a microservice architecture can unlock a plethora of benefits, such as: increase in agility, developer productivity, resilience, scalability, reliability, maintainability, separation of concerns, and ease of deployment [6] [46]. However, the benefits come with challenges. As microservices are deployed independently, services communicate over the network. This creates a need for service discovery, increased security management, communication optimization and load balancing [23] [34]. The network latency is also much greater than that of memory, meaning intercommunication within a microservice architecture is slower as compared to a monolithic architecture that makes use of in-memory calls [48][47]. Moreover, decomposing distributed systems into independent granular components brings complexity and operational overhead. Meaning a microservice architecture does not simply remove complexity, rather the complexity shifts from inside of the application out into infrastructure.
[6] Balalaie, A., Heydarnoori, A., Jamshidi, P., “Migrating to Cloud-native Architectures Using Microservices: An Experience Report,” to be published in Proc. 1st Int’l Workshop Cloud Adoption and Migration.
[46] Thones, J., "Microservices," IEEE Software, vol. 32, no. 1, pp. 116-116, 2015.
[23] Lewis, J. and Fowler, M., “Microservices”, 2014. [Online]. Available: https://martinfowler.com/articles/microservices.html (visited on 03/02/2019).
[24] MacKenzie, C., Laskey, K., McCabe, F., Brown, P.F., Metz, R., and Booz Allen Hamilton. Reference model for service oriented architecture 1.0. OASIS Standard, 12, 2006.
[47] Ueda, T., Nakaike, T., Ohara, M., “Workload characterization for microservices,” in 2016 IEEE International Symposium on Workload Characterization (IISWC), Sept 2016, pp. 1–10.
[48] Villamizar, M., Garces, O., Castro, H., Verano, M., Salamanca, L., Casallas, R., Gil, S., Evaluating the monolithic and the microservice architecture pattern to deploy web applications in the cloud. In Computing Colombian Conference (10CCC), 2015 10th, pages 583–590. IEEE, 2015.
To evaluate the differences between a microservice architecture and a monolithic architecture, two separate systems, S1 and S2, were developed and deployed. The two systems provide the same functionality but are built using two different system designs. S1 is a monolithic system whereas S2 is a microservice architecture. A set of performance tests were executed on both systems using Apache JMeter [4] to gather quantitative data for analysis. The performance tests measured response time as well as error rate under different workloads. To create realistic performance tests, the workloads were determined by use cases.
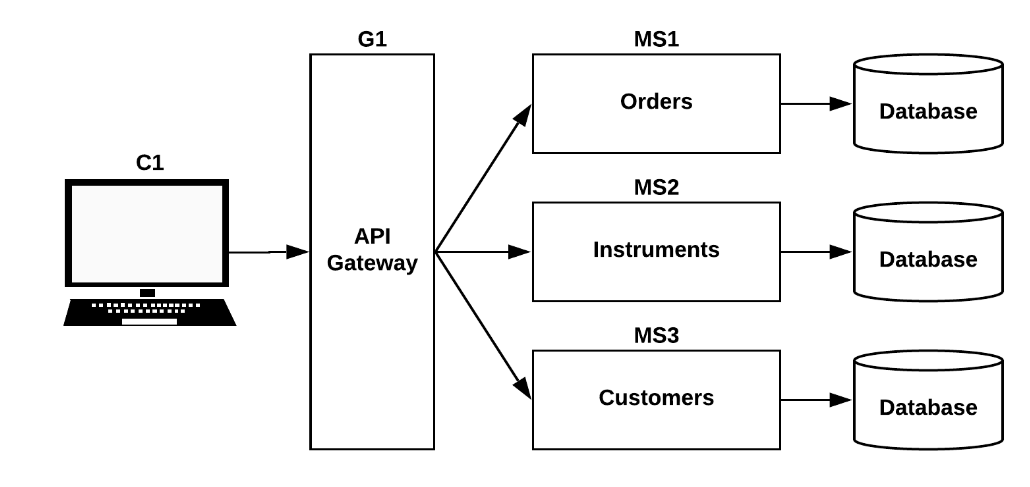
Figure 4: The flow of communication between client and the server in the microservice architecture.
As each container running on a node consumes computing resources, OpenShift allows to set minimum and maximum values for how much CPU and RAM a container can consume. The minimum amount of resources that can be allocated a container is referred to as “request” in OpenShift and the maximum is referred to as “limit”. Meaning, when a container is being deployed, it will be instantiated with the requested amount of CPU and RAM. With an increase in traffic to the container, OpenShift will allocate more resources to it, up until it reaches the limit. If a container attempts to exceed the specified limit for CPU, the system will throttle the container. If the container exceeds the specified memory limit, it will be terminated and restarted.
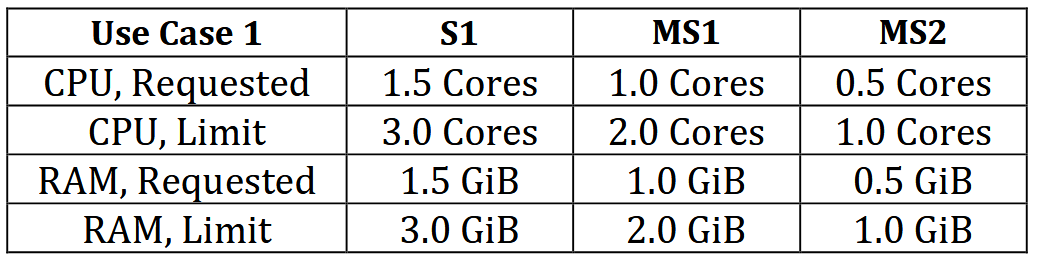
Table 2. The resources, CPU and memory (RAM), allocated for both systems, S1 and S2, for Use Case 1. Displaying both the requested amount of resources and the limits for each container.
To simplify the comparisons and analysis of the data gathered from the performance tests, auto-scaling was disabled. Therefore, each application was deployed as a single container, configured with the amount of CPU and memory presented in Table 2 and 3.
To measure response time, test plans were created to execute a constant workload of 1100 requests per minute during 5 minutes on each system, resulting in a total of 5500 requests. This created a steady workload on the systems without purposely making them crash.
The tests performed for Use Case 1 resulted in an average response time of 82 ms for the monolith architecture, S1, and 224 ms for the microservice architecture, S2. Meaning the monolith architecture had an average response time which were 64% faster than the microservice architecture. When inspecting the 90% line, meaning the response time of which 90% of the requests fall, the response time for the monolith architecture, S1, was 171 ms and for the microservice architecture, S2, it was 313 ms. Meaning 90% of the requests to the monolith architecture, S1, will have a 45% faster response time than the requests to the microservice architecture, S2. The results are presented in Table 4.
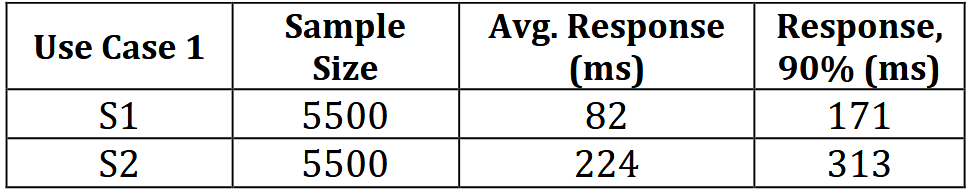
Table 4. Displays the data gathered from the performance test which measured response time for Use Case 1. The data displayed is sample size, the average response time and the 90% line response time.
To measure error rate, test plans were created to execute a constant workload of 4440 requests per minute during 5 minutes on each system, resulting in a total of 22200 requests. This created a heavy workload on the systems to purposely make the containers crash in order to see how the two different architectures behave when errors occur.
The results show that the response time for the microservice architecture is significantly slower when compared to the response time of the monolithic application. When evaluating error rate, the systems were exposed to a higher workload and the results show that the error rate is significantly lower in a microservice architecture than a monolithic architecture.
Moreover, the results also confirm and further strengthen the work of Ueda et. al. [47] and Villamizar et. al. [48], which reported that the performance of a microservice model is lower than that in a monolithic model.
Therefore, the complexity of the system was fairly low with a total of only three microservices. Each microservice was also fairly independent, meaning the need for intercommunication between microservices was close to non-existent. This opens up to debate if the system can be considered a distributed system at all. Because of the low level of complexity, circuit breakers and an event-driven architecture for data consistency, both considered key components in a successful microservice architecture, were not implemented.