Evaluating GraphQL and REST API Services Performance in a Massive and Intensive Accessible Information System
Status:: 🟩
Links:: Green Architectural Tactics
Metadata
Authors:: Lawi, Armin; Panggabean, Benny L. E.; Yoshida, Takaichi
Title:: Evaluating GraphQL and REST API Services Performance in a Massive and Intensive Accessible Information System
Publication Title:: "Computers"
Date:: 2021
URL:: https://www.mdpi.com/2073-431X/10/11/138
DOI:: 10.3390/computers10110138
Lawi, A., Panggabean, B.L.E. and Yoshida, T. (2021) ‘Evaluating GraphQL and REST API Services Performance in a Massive and Intensive Accessible Information System’, Computers, 10(11), p. 138. Available at: https://doi.org/10.3390/computers10110138.
Currently, most middleware application developers have two choices when designing or implementing Application Programming Interface (API) services; i.e., they can either stick with Representational State Transfer (REST) or explore the emerging GraphQL technology. Although REST is widely regarded as the standard method for API development, GraphQL is believed to be revolutionary in overcoming the main drawbacks of REST, especially data-fetching issues. Nevertheless, doubts still remain, as there are no investigations with convincing results in evaluating the performance of the two services. This paper proposes a new research methodology to evaluate the performance of REST and GraphQL API services with two main ideas as novelties. The first novel method is the evaluation of the two services is performed on the real ongoing operation of the management information system, where massive and intensive query transactions take place on a complex database with many relationships. The second is the fair and independent performance evaluation results obtained by distributing client requests and synchronizing the service responses on the two virtually separated parallel execution paths for each API service, respectively. The performance evaluation was investigated using basic measures of QoS (Quality of Services), i.e., response time, throughput, CPU load, and memory usage. We use the term efficiency in comparing the evaluation results to capture differences in their performance measures. The statistical hypothesis parameters test using the two-tails paired t-test, and boxplot visualization was also given to confirm the significance of the comparison results. The results showed REST is still faster up to 50.50% in response time and 37.16% for throughput, while GraphQL is very efficient in resource utilization, i.e., 37.26% for CPU load and 39.74% for memory utilization. Therefore, GraphQL is the right choice when data requirements change frequently, and resource utilization is the most important consideration. REST is used when some data are frequently accessed and called by multiple requests.
Notes & Annotations
Color-coded highlighting system used for annotations
📑 Annotations (imported on 2024-11-26#17:51:43)
This paper proposes a new research methodology to evaluate the performance of REST and GraphQL API services with two main ideas as novelties.. The first novel method is the evaluation of the two services is performed on the real ongoing operation of the management information system, where massive and intensive query transactions take place on a complex database with many relationships. The data source for this investigation is primary data from transaction queries on a Management Information System of the Hasanuddin University Research and Community Service Institute, called SIM-LP2M [10]. Therefore, the results of the performance evaluations, derived from real client transaction activities that cannot be repeated, are not simulations, and must be carefully and accurately conducted in such a way as to not interfere with the operation of the running system. The second novel method is the fair and independent performance evaluation results obtained for both API services. In this method, the request synchronization node plays an important role in distributing client requests and synchronizing service responses to two parallel execution paths for each API service. The execution path resides in a separate virtual machine connected to a single-database engine hosting two identical and isolated schemas.
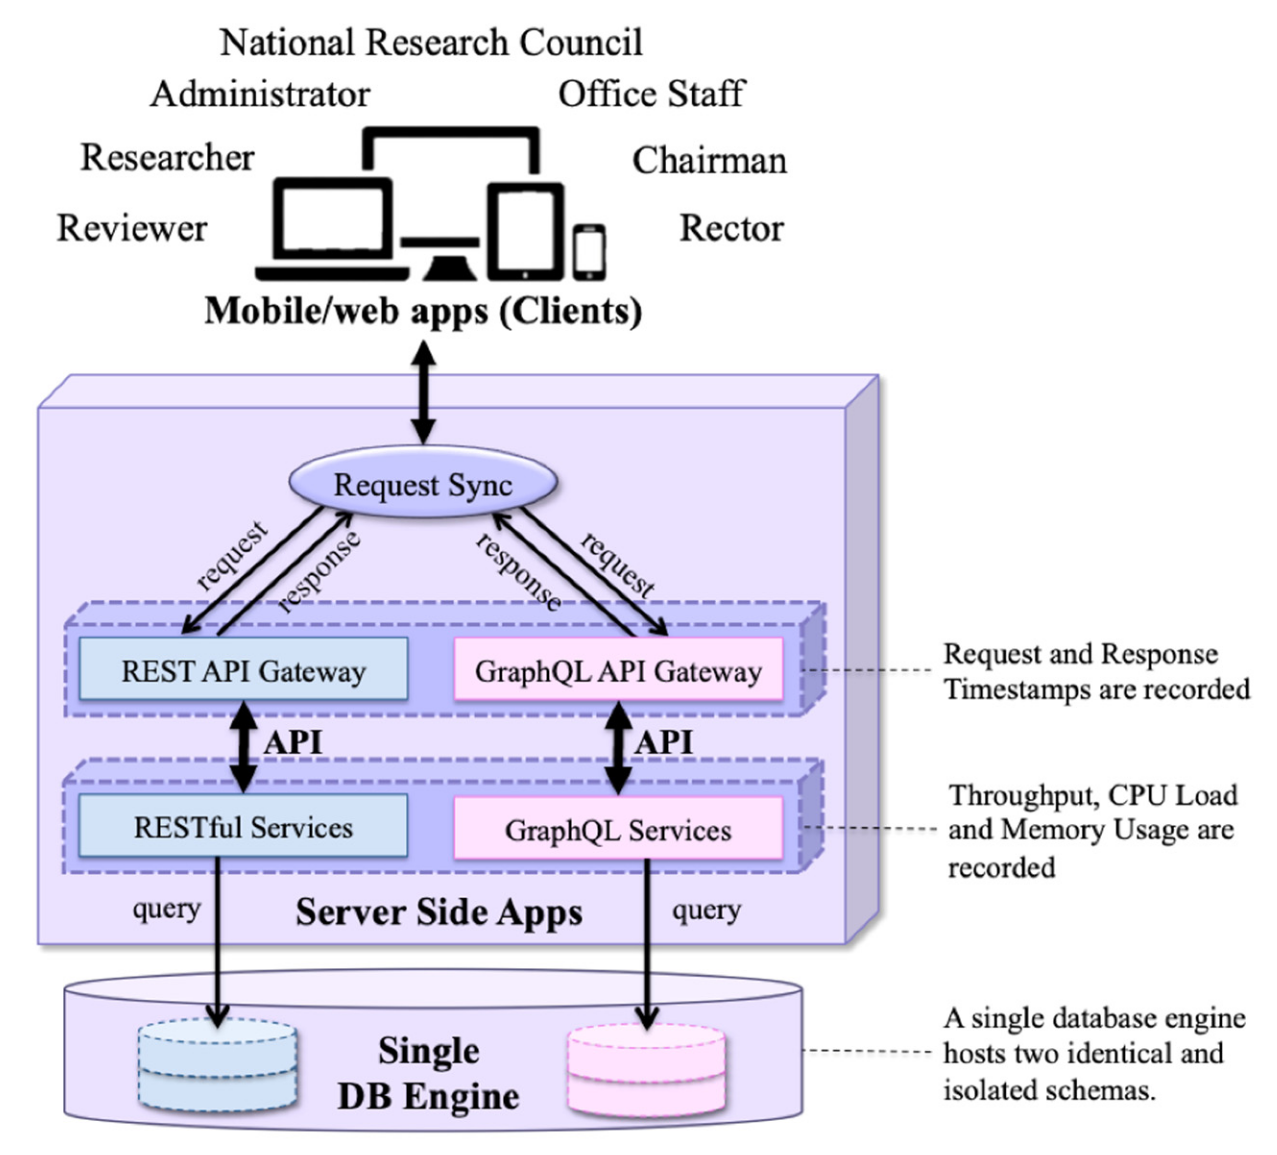
Figure 1. Illustration of the evaluated system architecture of the SIM‐LP2M.
When there are a series of actions or transactions to the database such as CREATE, READ, UPDATE, and DELETE (CRUD), they are first synchronized and then distributed in parallel to the REST and GraphQL API gateways, respectively. Therefore, data related to response time are counted by the differences between request and response timestamps recorded in the API gateway. Meanwhile, other data related to throughput, CPU load, and memory utilization are measured on API service activities.
The main difference between REST and GraphQL APIs technology is the availability of the number of endpoints when they are handling requests. GraphQL tries to collect every request to one place, whereas the REST is built such that each resource is handled by some specific endpoints. The REST configuration creates a complicated situation whenever there is a change on the back-end, and it causes an adjustment to the front-end to query the exact endpoint for the desired resource. On the other hand, GraphQL takes some time when the request is handled at a single endpoint to find the right resource [1,3,12,13,16,22].
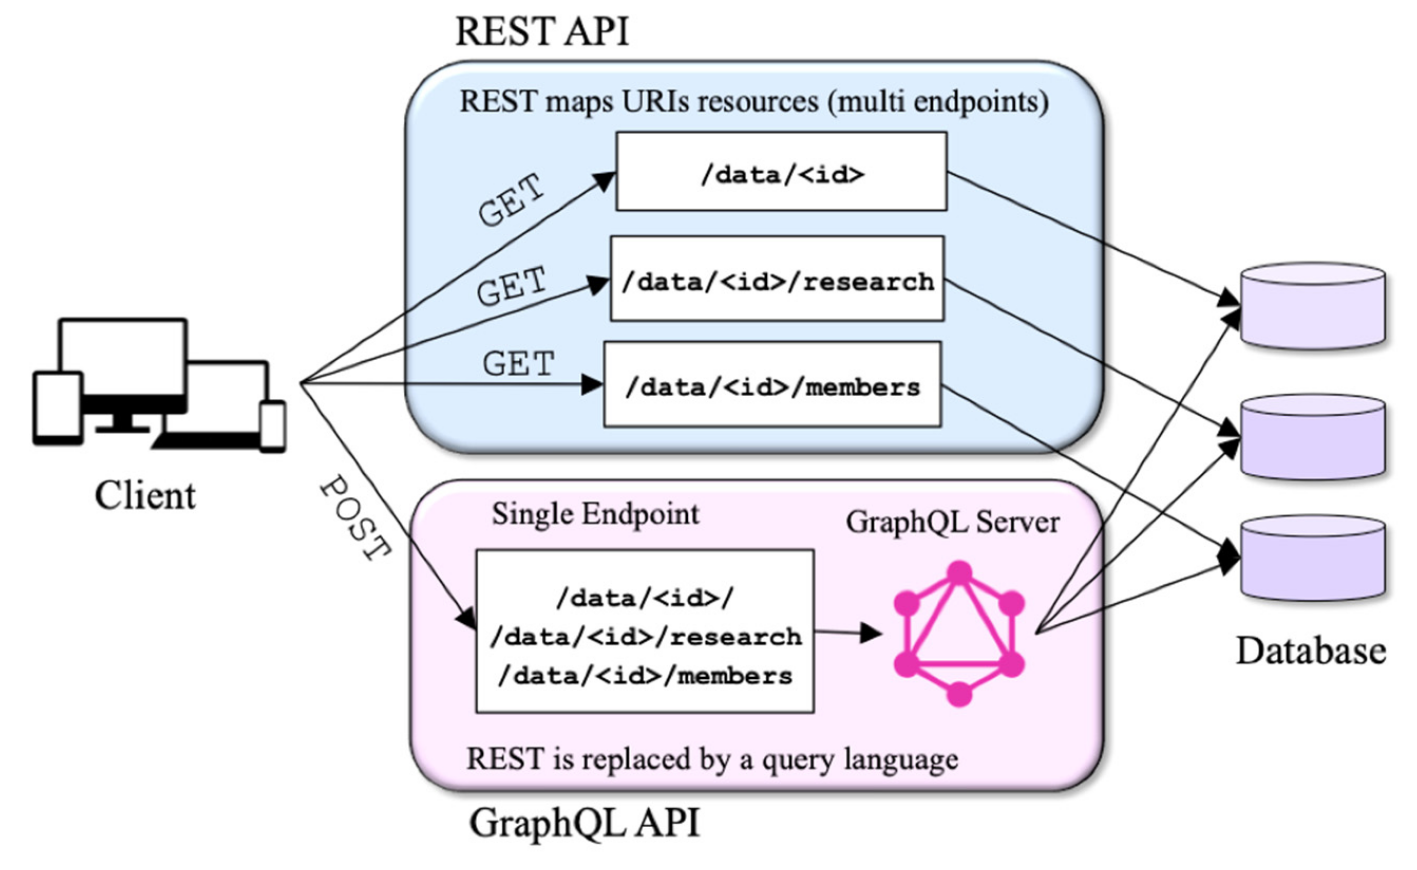
Figure 2. Illustration of the difference between REST and GraphQL architectures
The resulted response time showed GraphQL has an average 1864.50 ms in the range of 1810–2130 ms with standard deviation 75.78 ms. The REST has a faster average 922.85 ms in the time range of 890–1000 ms, and standard deviation is 32.99 ms. Figure 6 shows the graph of the REST and GraphQL differences of the average response time triggered by 100 requests from 20 trials. It can be seen that the REST was faster in every test run with a stable response time.
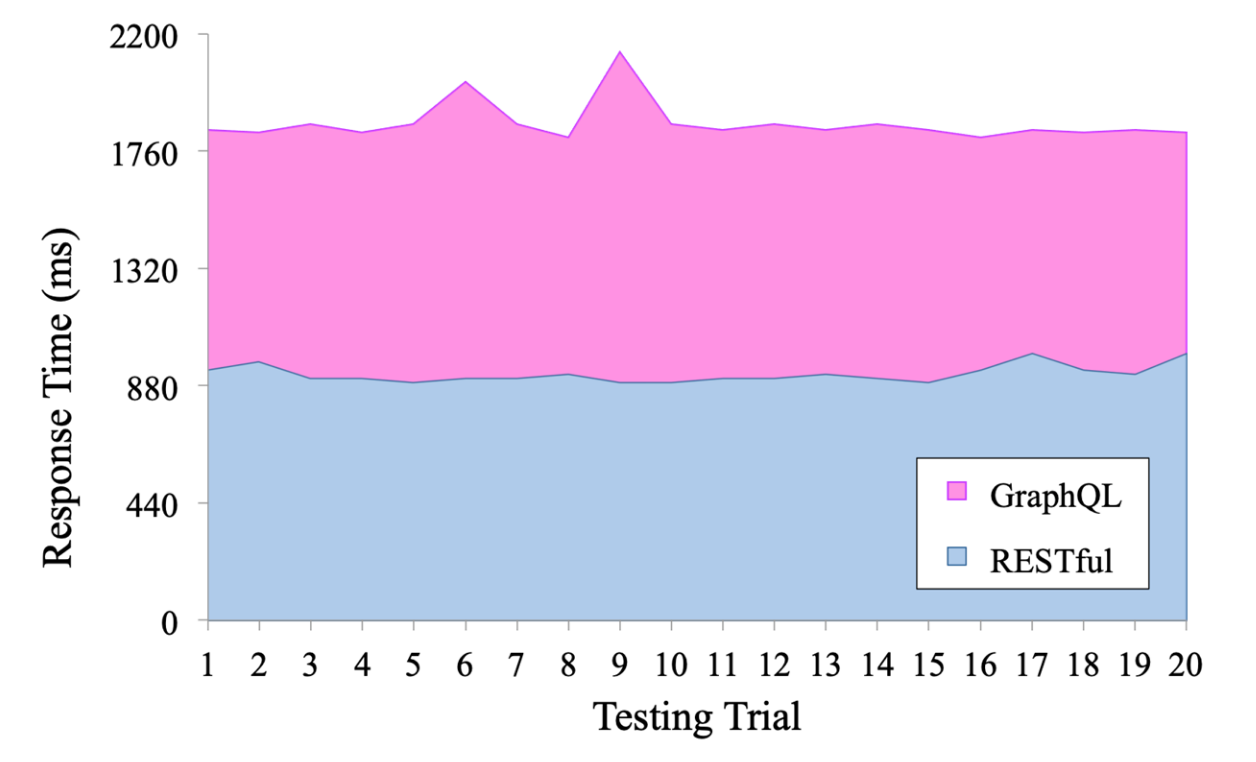
Figure 6. Response time average with 100 requests in each testing trial
We evaluated the throughput as the cumulative number of requests in REST and GraphQL transactions with data-fetching performance in every interval time of 10 milliseconds, respectively
The throughput resulted for web services using GraphQL can handle an average of 2856.95 requests/ms with a range of 2666–3117 requests/ms and standard deviation 103.01 requests/ms, whereas the REST can handle an average of 4546.45 requests/ms in the range of 4200–5175 requests/ms and standard deviation 201.18 requests/ms. In the first 10 ms, both services can handle many requests, and then they tend to have a steady number of requests after 100 ms as depicted in Figure 7.
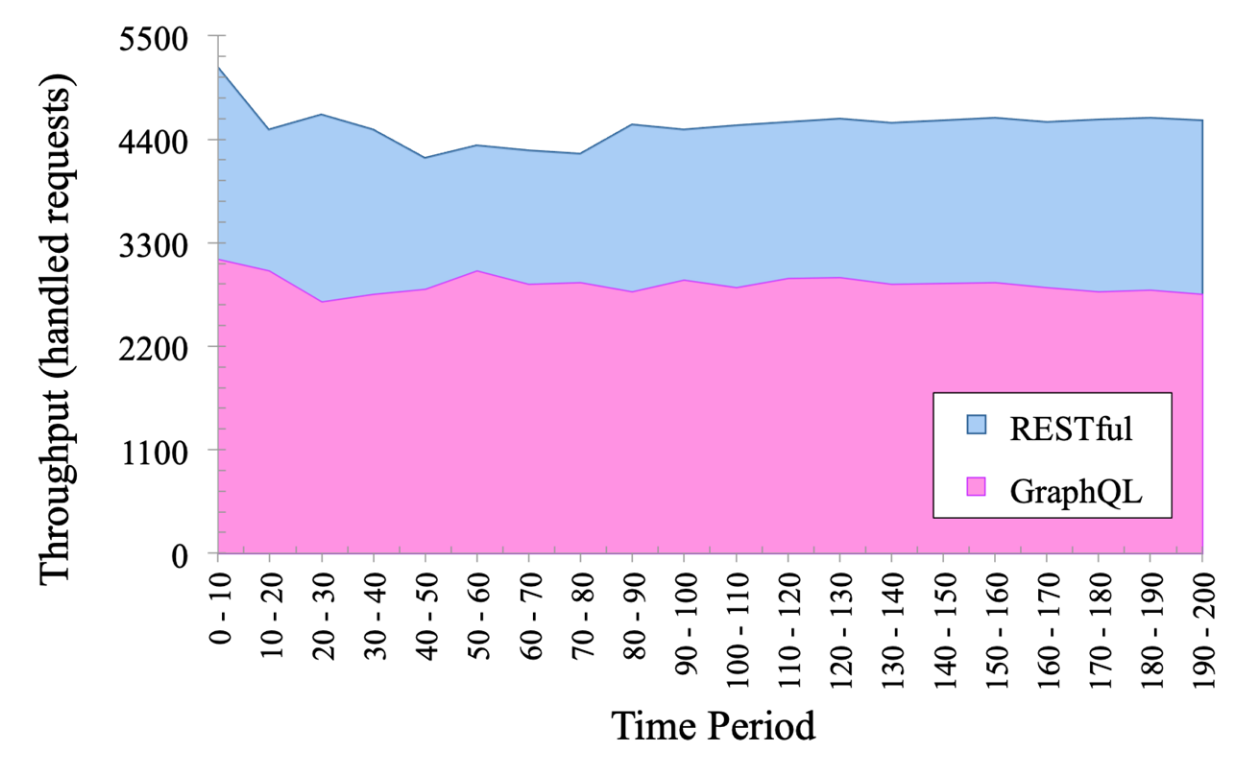
Figure 7. Experimental results of throughput (the number of handled requests)
We evaluated CPU load without any other loads, services, and processes in the same setup machine in each API service server separately. The evaluation is conducted at the same time when evaluating the performance of the throughput. CPU loads of the services were recorded every 10 ms
In the first 10 ms of our experiment, it resulted that the REST used 82.5% CPU as peak usage and remained slightly fluctuating in heavy usage and has an average 75.50% within the range 70–82.45%. Meanwhile, GraphQL is consistently steady with average 47.37% within the range 44.43–50% and standard deviation 1.27%. CPU usage graph is depicted in Figure 8.
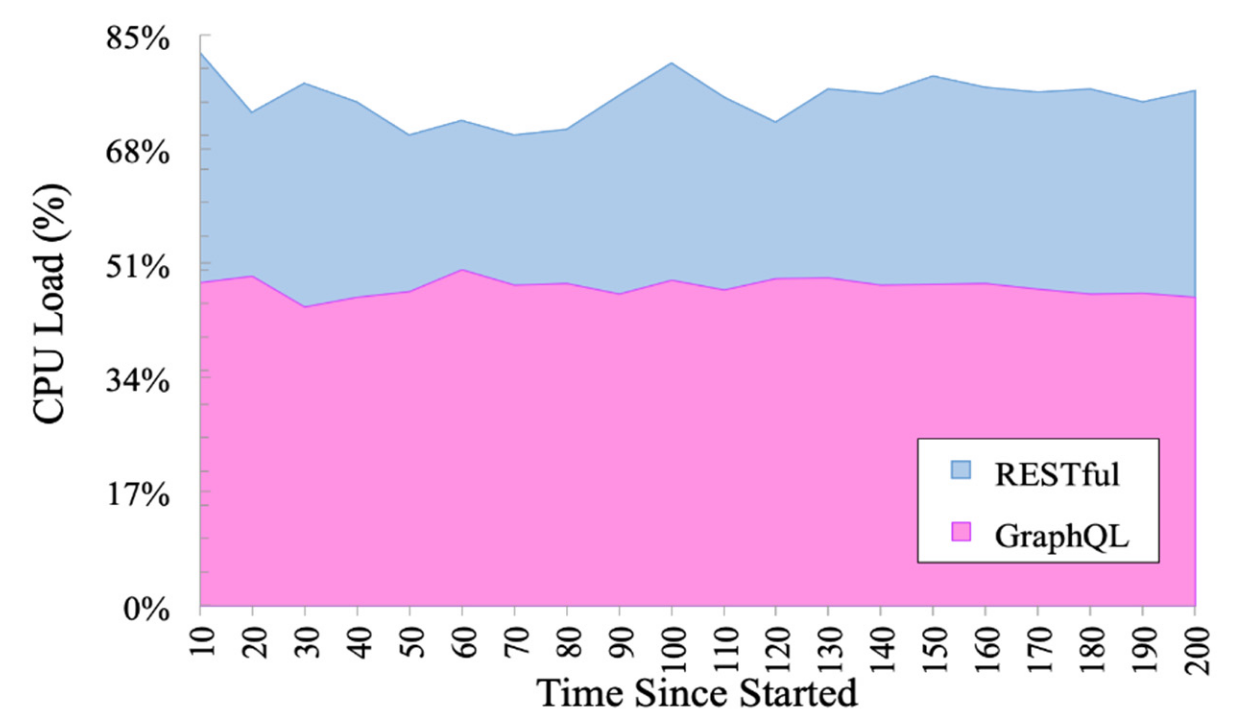
Figure 8. Percentage result of CPU load
The experiment showed that the average memory consumption of REST is 68.75 MB in the range of 57.50–79.47 MB with standard deviation 6.06 MB, whereas in GraphQL is 41.43 MB in the range of 38.6–45.20 MB with standard deviation 1.50 MB. Even though the initial request memory usage is at its peak, especially in the first 10 ms, GraphQL is very stable and low in memory consumption as depicted in Figure 9. On the other hand, memory usage at REST tends to fluctuate periodically with alternating peaks and valleys but still under heavy usage in the range of 55–80 MB.

Table 5. Recapitulation two-tails paired t-test of the performance results
Recapitulation of the average values in Table 5 showed that REST is superior to GraphQL in performance with respect to speed. The response time performance at REST is 50.50% more efficient with a response variation of 32.99 ms. Furthermore, REST throughput performance is also 37.16% more efficient; however, GraphQL is more stable in handling requests with a very small variation of 103.01 requests in each 10 ms.
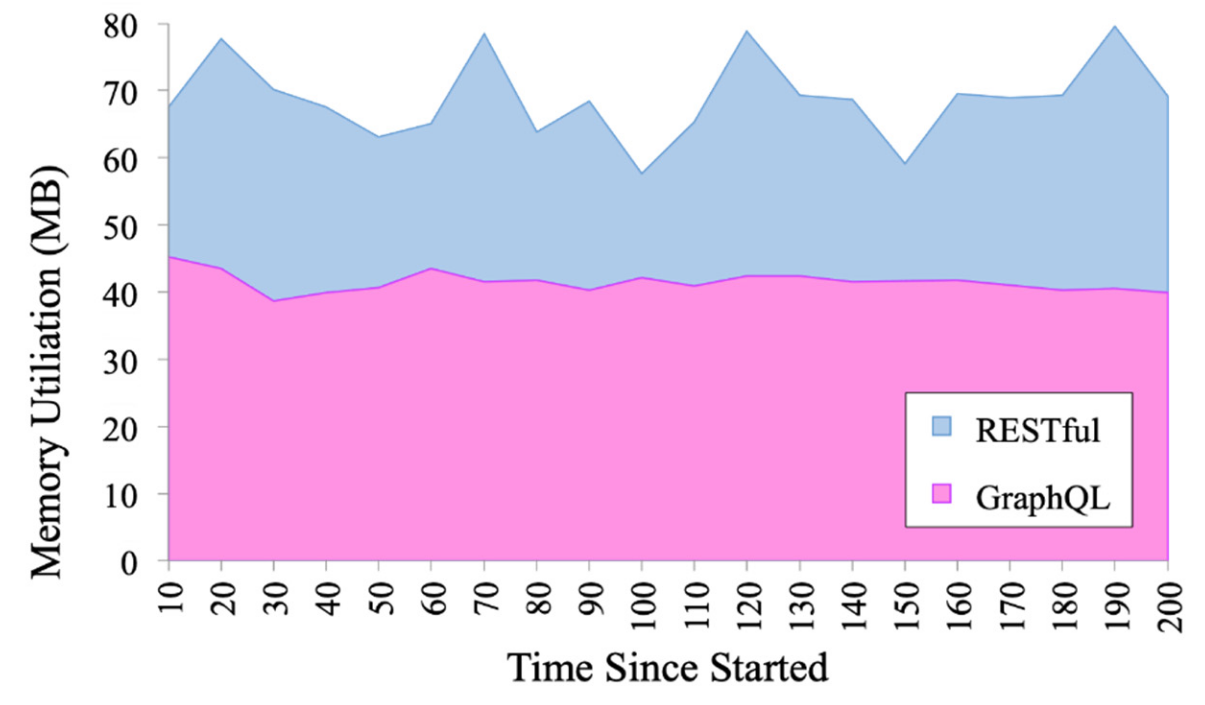
Figure 9. Experimental results for memory utilization
GraphQL is superior to REST in terms of performance regarding resource consumption and utilization. For CPU load performance, GraphQL is 37.26% more efficient and stable in utilizing processing resources with a variation of only 1.27%. Furthermore, GraphQL memory consumption is also superior with an efficiency of 39.74% and is very stable with a variation of only 1.03 MB. The stability of GraphQL in consuming memory and utilizing CPU usage occurs because the query has selected data fields or properties for specific requests (or contains complete data requirements). This results in a much smaller and more efficient utilization of computing resources with certain fixed data. In addition, the request is only made once at a single endpoint, and the client can specify flexible response formats to avoid very large data transfers (overfetching) or sparse data response (underfetching), as can happen with the REST API service.
We can conclude that the use of REST and GraphQL services depends on the requirements of the system and the particular application. GraphQL is a good choice when data requirements change frequently and resource usage is a concern, while REST is used when some data are frequently retrieved on demand and is therefore very suitable for monolithic information systems.
📑 Annotations (imported on 2024-11-26#21:36:03)
CPU load and memory utilization should be assessed in regards of the throughput! Throughput of REST is 37 % higher, but CPU load is also 37 % higher than GraphQL. So in the end it is equal!?