Quantifying Data Center Scope 3 GHG Emissions to Prioritize Reduction Efforts
Status:: 🟩
Links:: Carbon Footprint of ICT Devices Energy Consumption & Carbon Emissions of Data Centers
Metadata
Authors:: Lin, Paul; Bunger, Robert; Avelar, Victor
Title:: Quantifying Data Center Scope 3 GHG Emissions to Prioritize Reduction Efforts
Date:: 2023
URL:: https://www.se.com/ww/en/download/document/SPD_WP99_EN/
DOI::
Lin, P., Bunger, R. and Avelar, V. (2023) Quantifying Data Center Scope 3 GHG Emissions to Prioritize Reduction Efforts. White Paper 99. Schneider Electric. Available at: https://www.se.com/ww/en/download/document/SPD_WP99_EN/ (Accessed: 18 December 2024).
More data centers are transitioning to renewable energy sources. As this happens, Scope 3 becomes a data center’s largest contributor to greenhouse gas (GHG) emissions. This category of emissions is also the least reported and understood. Quantifying Scope 3 emissions is one of the most important issues the industry is facing. In this paper, we use a single hypothetical data center to demonstrate how to quantify Scope 3 emissions and identify the largest emission sources. We provide a calculator that estimates a data center’s lifecycle carbon footprint and other assessment tools. Finally, we describe best practices for reducing emissions. This paper and the “Data Center Lifecycle CO2e Calculator” TradeOff Tool mark the first comprehensive attempt to quantify the details driving Scope 3 in an enterprise data center.
Notes & Annotations
Color-coded highlighting system used for annotations
📑 Annotations (imported on 2025-01-27#11:18:04)

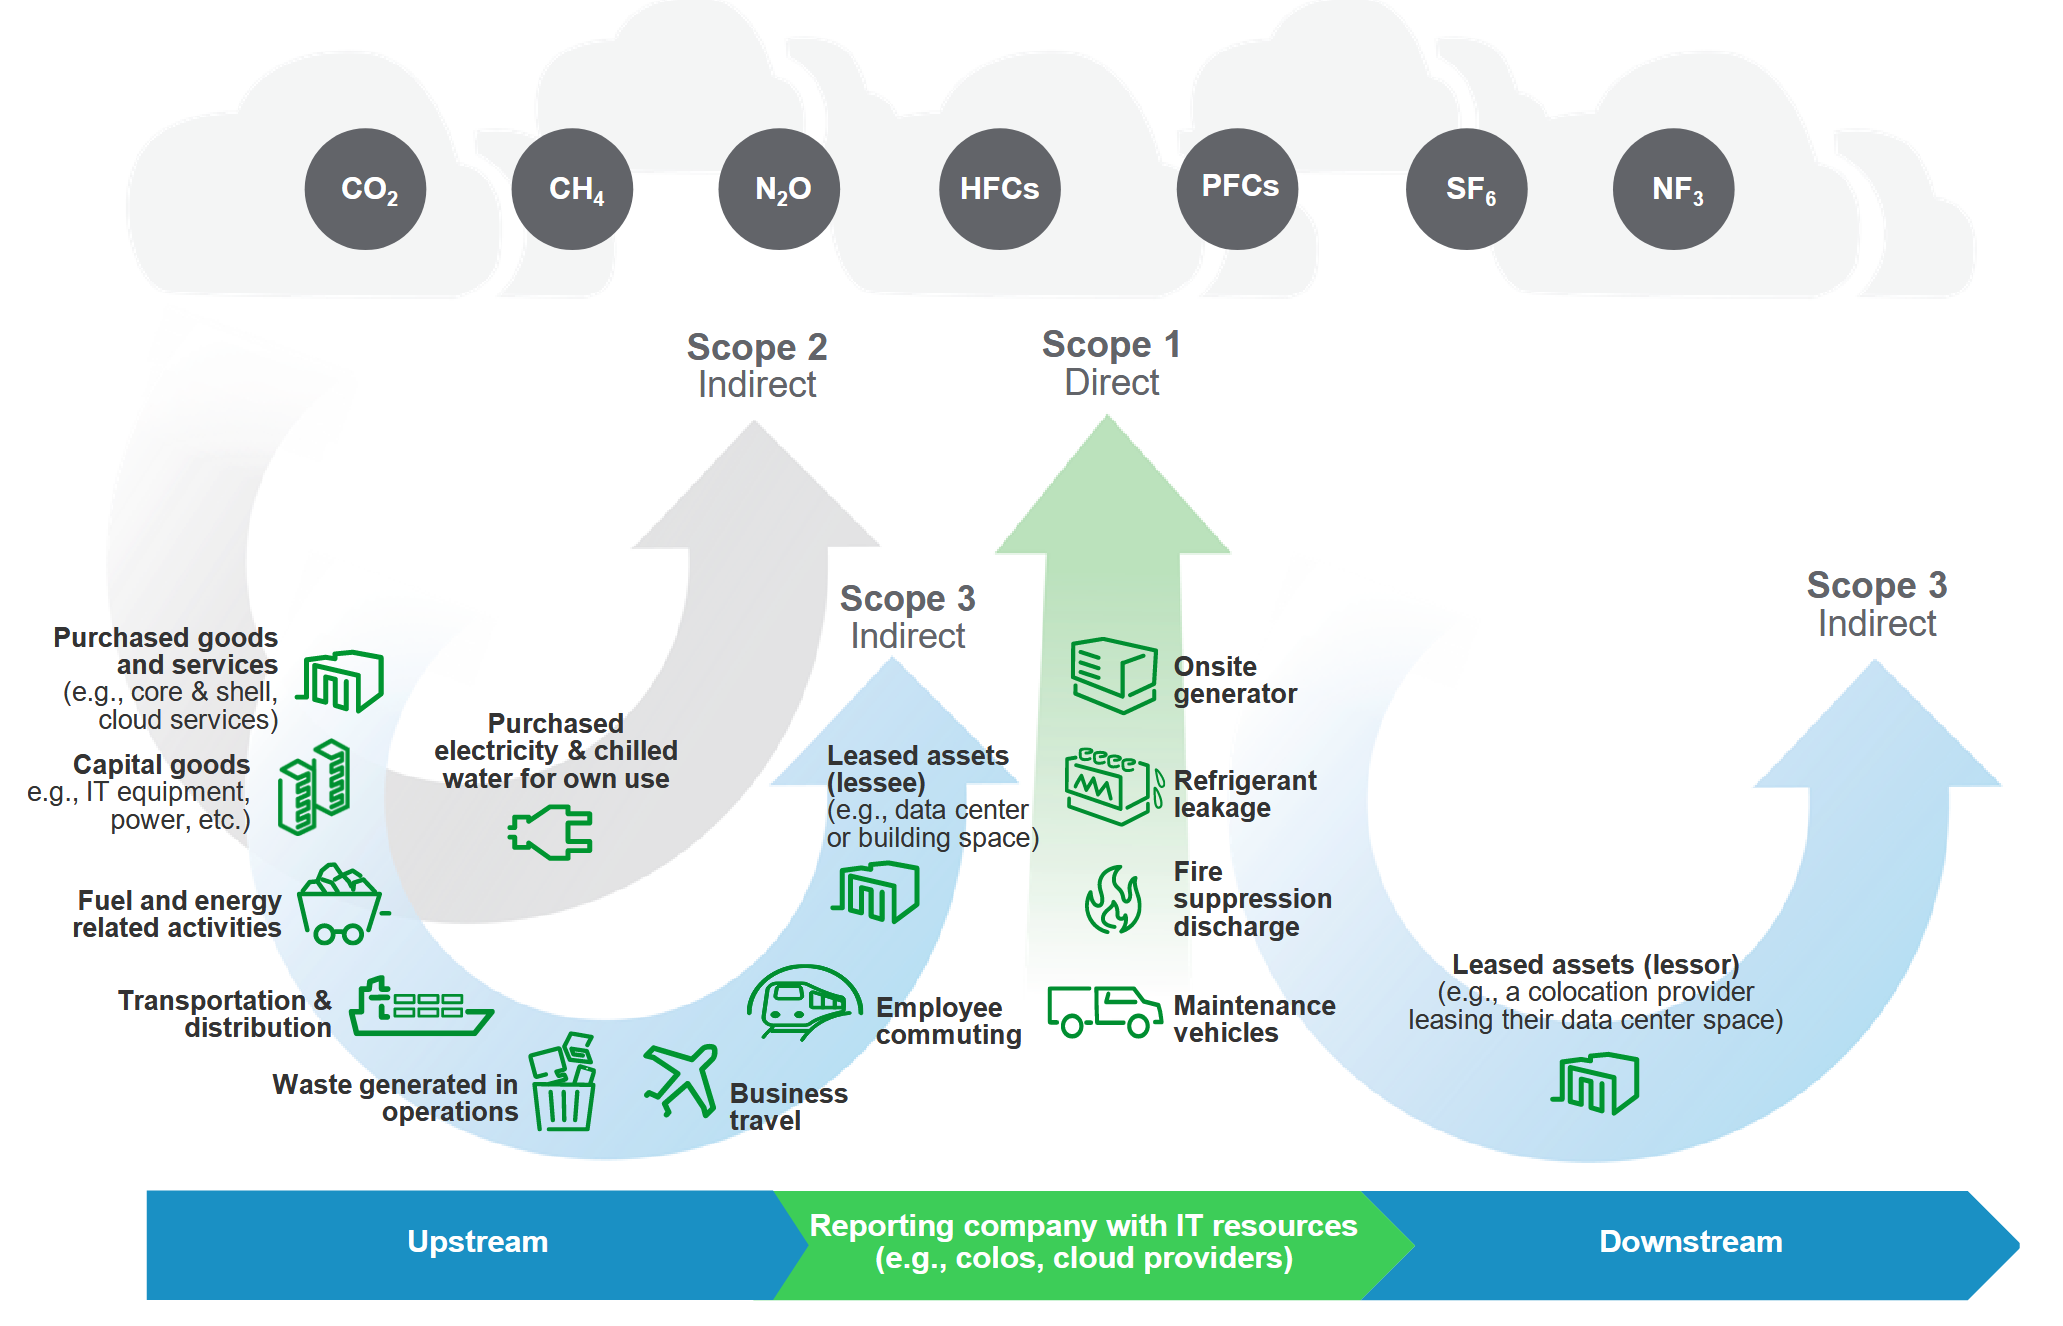
GHG Protocol scopes and emissions across the data center value chain Source: Adapted from Corporate Value Chain (Scope 3) Accounting and Reporting Standard (https://ghgprotocol.org/standards/scope-3-standard)
Main assumptions & methodology
- 1MW data center capacity, Tier 3, 50% loaded, based on a reference design.
- 6kW/rack average power density
- 1.34 average annual PUE (N+1 power and chilled water cooling)
- 0.511 t CO2e/MWh average electricity emission factor for U.S.
- IT servers and networking gear are 50% physically populated
- Allocation of IT power to IT equipment
- Servers integrated with storage - 94%
- Networking gear - 6%
- Carbon intensity for servers6 is 5 t CO2e per kW of IT capacity. Networking gear is the same as the servers.
The cumulative carbon footprint of the data center was calculated at year 1, 5, 10, 15, and 20 to assess emissions trends and composition between Scope 1, 2, and 3, and other perspectives. Although data centers report their emissions on an annual basis (not cumulative), presenting the cumulative carbon footprint at various years helps with trending and benchmarking.

Cumulative total carbon footprint profile over time

Cumulative total carbon footprint comparisons between the United States vs. France vs. Singapore at year 15

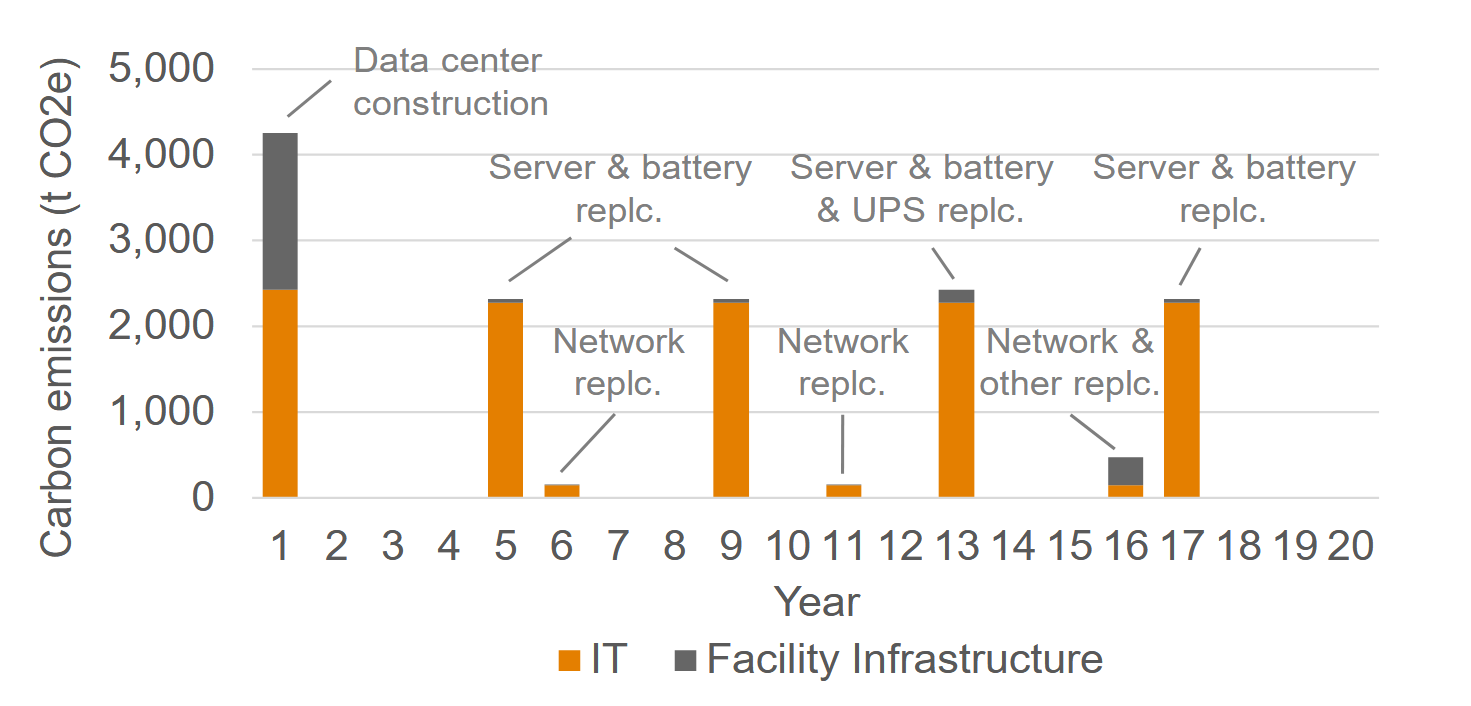
Yearly embodied carbon profile for IT vs. facility infrastructure over time

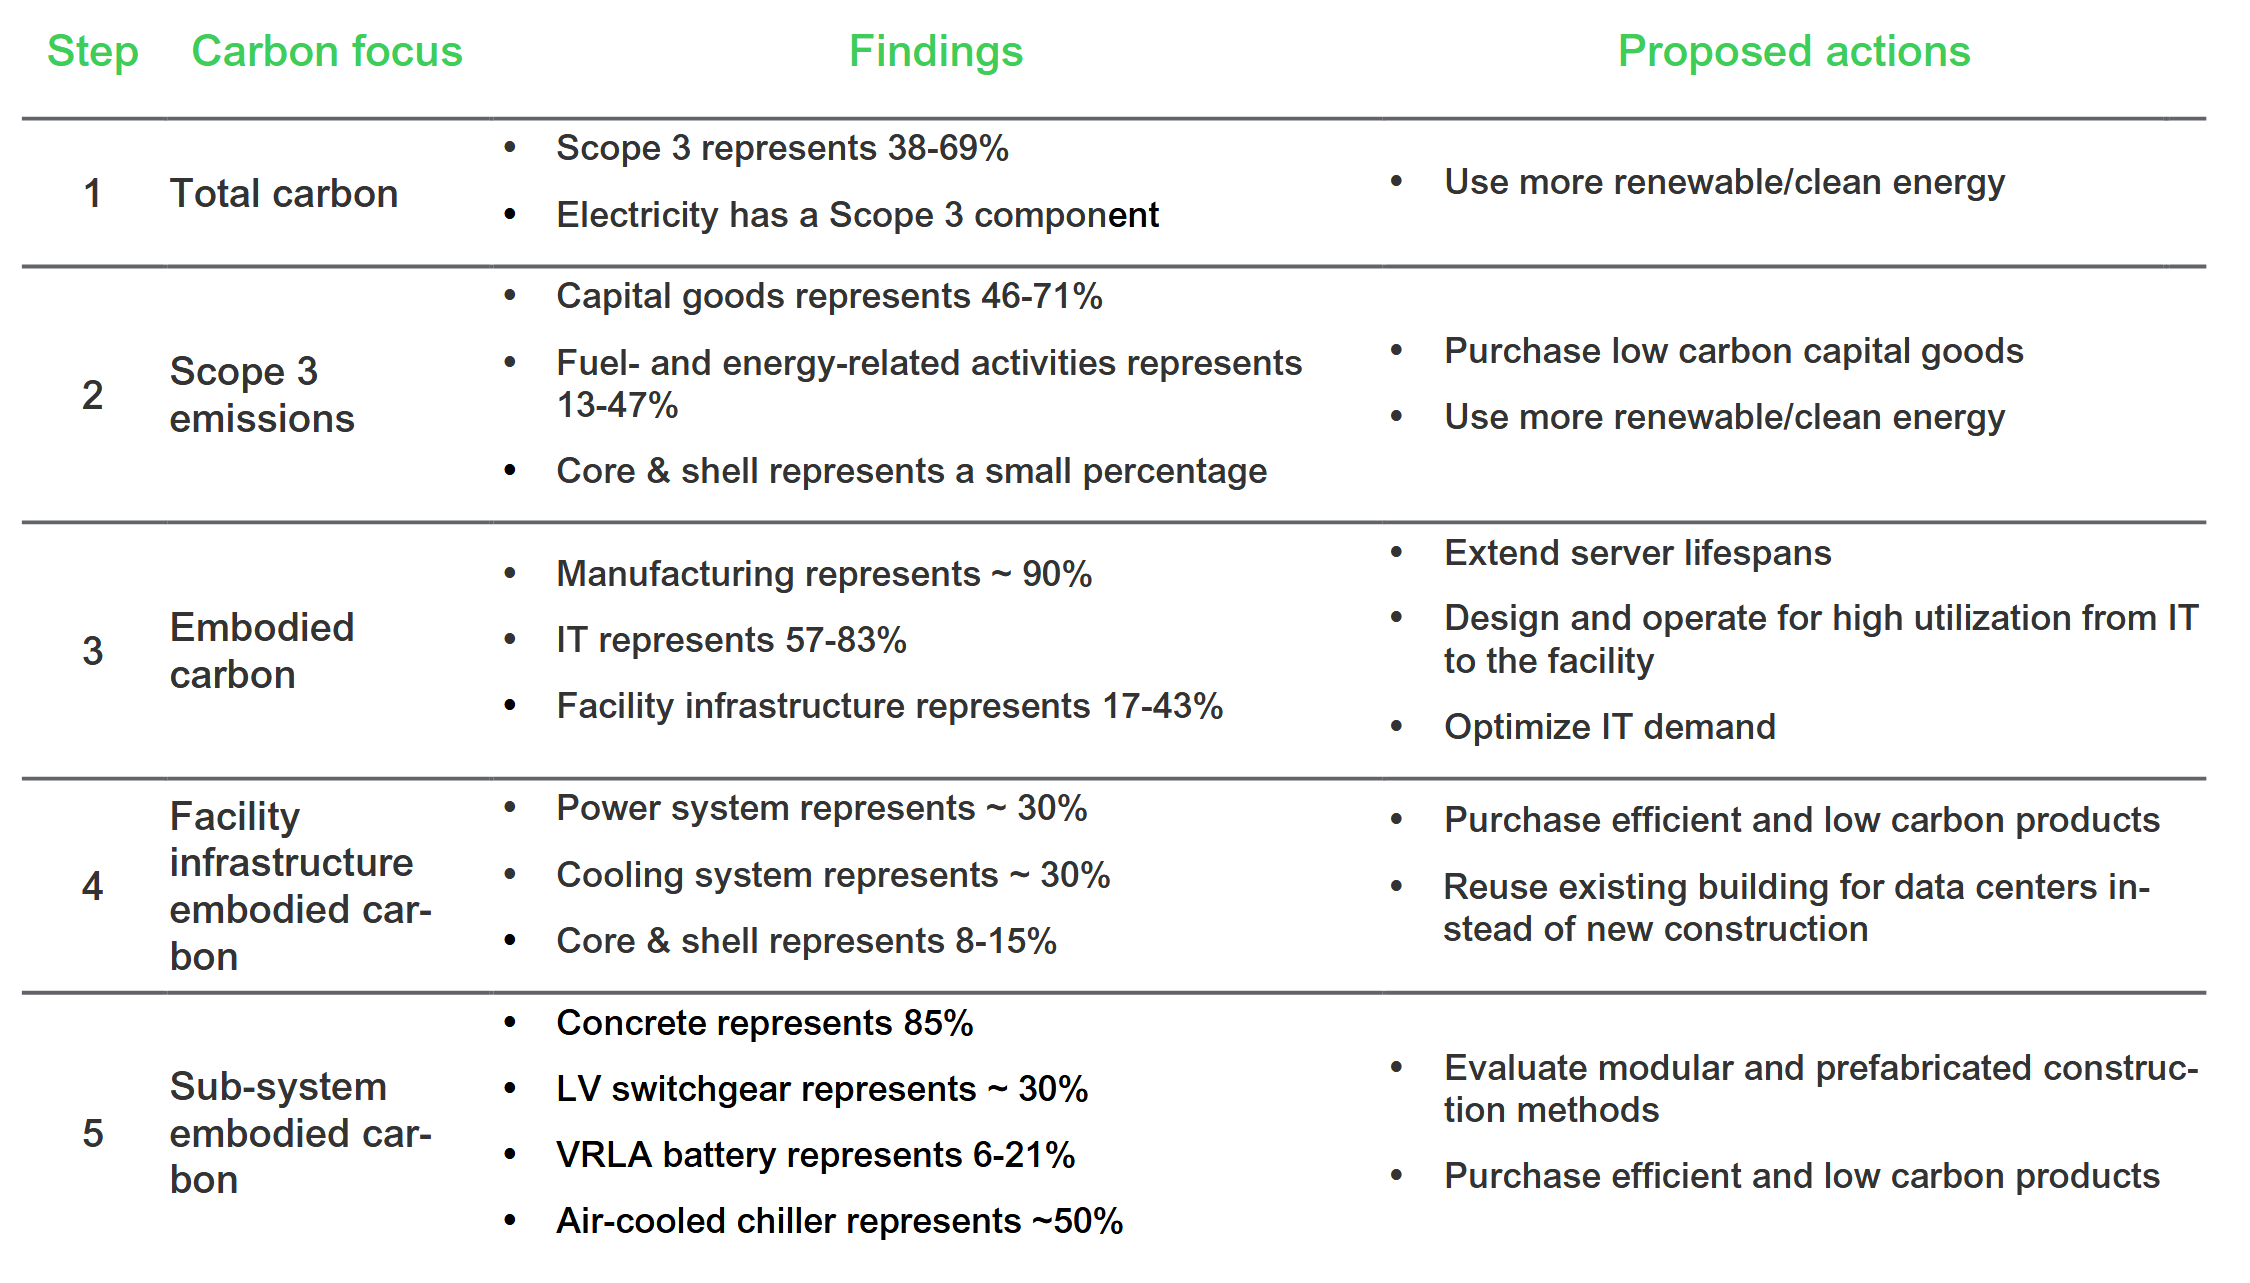
Summary of findings with proposed actions from this study
The lowest carbon data center is the one you don’t have to build. In other words, optimizing IT demand to avoid over-building also plays an important role in data center carbon reduction.
If we extend the server’s lifespan an extra year, we reduce the cumulative data center embodied carbon by about 16%.