Bridging the sustainability gap in serverless through observability and carbon-aware pricing
Status:: 🟩
Links:: Serverless Energy Efficiency of Different Software Architecture Styles
Metadata
Authors:: Lin, Changyuan; Shahrad, Mohammad
Title:: Bridging the sustainability gap in serverless through observability and carbon-aware pricing
Date:: 2024
URL:: https://hotcarbon.org/assets/2024/pdf/hotcarbon24-final164.pdf
DOI::
Lin, C. and Shahrad, M. (2024) ‘Bridging the sustainability gap in serverless through observability and carbon-aware pricing’, in. HotCarbon. Available at: https://hotcarbon.org/assets/2024/pdf/hotcarbon24-final164.pdf (Accessed: 1 August 2024).
Serverless computing has become a mainstream cloud computing paradigm due to its high scalability, ease of server management, and cost-effectiveness. With cloud data centers’ carbon footprint rising sharply, understanding and minimizing the carbon impact of serverless functions becomes crucial. The unique characteristics of serverless functions, such as event-driven invocation, pay-as-you-go billing model, short execution duration, ephemeral runtime, and opaque underlying infrastructure, pose challenges in effective carbon metering. In this paper, we argue that the current carbon estimation methodologies should be expanded for more accurate carbon accounting in serverless settings, and propose a usage and allocation-based carbon model that aligns with the context of serverless computing. We also articulate how current serverless systems and billing models do not make it financially attractive to prioritize sustainability for a broad class of users and developers. To solve this, we propose a new carbon-aware pricing model and evaluate its ability to incentivize sustainable practices for developers through better alignment of billing and carbon efficiency.
Notes & Annotations
Color-coded highlighting system used for annotations
📑 Annotations (imported on 2024-08-01#17:12:24)
Serverless applications can have a significant carbon footprint depending on configurations and underlying infrastructure [41, 64, 65]. Also, the increasing popularity of artificial intelligence and serverless model serving will generally increase the carbon footprint of serverless further [22, 44, 52].
Currently, serverless developers do not have access to meaningful carbon metrics due to the absence of fine-grained observability frameworks. Tools available on public cloud platforms, such as Customer Carbon Footprint Tool [8] and Emissions Impact Dashboard [7], only provide coarse-grained carbon metrics (e.g., per-region and per-service) with limited observability. While recent studies and open-source projects have proposed several models and tools to capture the carbon footprint of software systems [18, 36, 46], they are not effective in capturing and modeling the carbon emissions of serverless functions due to not considering unique serverless characteristics such as event-driven invocation, pay-as-you-go billing model, short execution duration, ephemeral runtime sandbox, and opaque underlying infrastructure. Such a gap hinders fine-grained carbon emission analysis on perfunction and per-request levels.
[18] hubblo-org/scaphandre: Energy consumption metrology agent. let "scaph" dive and bring back the metrics that will help you make your systems and applications more sustainable ! https://github.com/ hubblo-org/scaphandre, 2024. [Online; accessed May-5-2024].
[36] Marcelo Amaral, Huamin Chen, Tatsuhiro Chiba, Rina Nakazawa, Sunyanan Choochotkaew, Eun Kyung Lee, and Tamar Eilam. Kepler: A framework to calculate the energy consumption of containerized applications. In 2023 IEEE 16th International Conference on Cloud Computing (CLOUD), pages 69–71. IEEE, 2023.
[46] Guillaume Fieni, Romain Rouvoy, and Lionel Seinturier. Smartwatts: Self-calibrating software-defined power meter for containers. In 2020 20th IEEE/ACM International Symposium on Cluster, Cloud and Internet Computing (CCGRID), pages 479–488. IEEE, 2020.
The power monitoring solutions mentioned above [36, 40, 46] and many existing power models [50, 51, 66] typically leverage a model to calculate the share of power that a monitored application A should bear based on its resource usage, denoted as P A.
[40] Aurélien Bourdon, Adel Noureddine, Romain Rouvoy, and Lionel Seinturier. Powerapi: A software library to monitor the energy consumed at the process-level. ERCIM News, 92:43–44, 2013.
[50] Hongyu Hè, Michal Friedman, and Theodoros Rekatsinas. Energat: Fine-grained energy attribution for multi-tenancy. In Proceedings of the 2nd Workshop on Sustainable Computer Systems, pages 1–8, 2023.
[51] Franz Christian Heinrich, Tom Cornebize, Augustin Degomme, Arnaud Legrand, Alexandra Carpen-Amarie, Sascha Hunold, Anne-Cécile Orgerie, and Martin Quinson. Predicting the energy-consumption of MPI applications at scale using only a single node. In 2017 IEEE international conference on cluster computing (CLUSTER), pages 92–102. IEEE, 2017.
[66] Norbert Schmitt, Lukas Iffländer, André Bauer, and Samuel Kounev. Online power consumption estimation for functions in cloud applications. In 2019 IEEE International Conference on Autonomic Computing (ICAC), pages 63–72. IEEE, 2019.
While pay-as-you-go billing enables cost-effectiveness, the current serverless billing model fails to reflect a function’s environmental impact in its cost. For instance, consider a CPU-bound function and another with a long, nonbusy wait for remote database transactions to complete. If both functions request identical resources (i.e., memory sizes and #vCPUs) and happen to have similar durations, they would cost the same. When it comes to carbon, however, the latter would have lower emissions. This simple example highlights a gap in the serverless billing model, which fails to align the cost with the carbon emissions of functions.
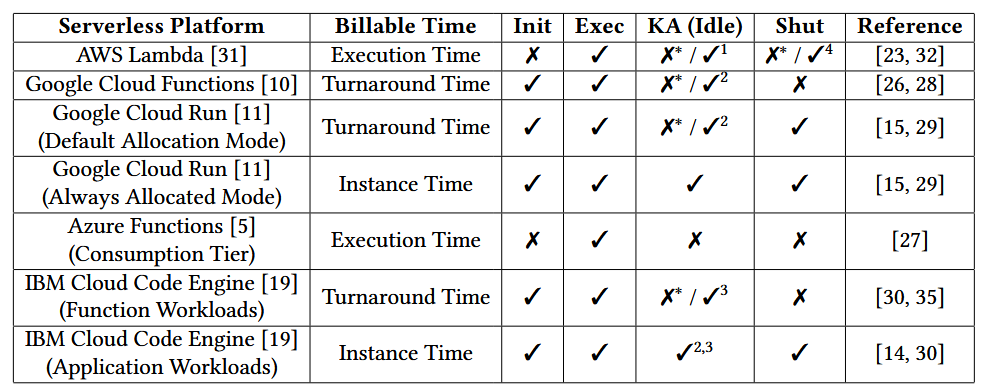
Table 1: The notion of billable time varies across different serverless platforms.
∗Not billed under the default configuration. Users may customize the keep-alive (KA) policy by configuring provisioned concurrency (1), minimum instances (2), or scale-down delay (3) and pay for idle resources. (4) Billed for functions with AWS Lambda Extensions.
Overview of the mentioned unsustainable practices in serverless:
- P1: Resource wastage due to inflexible allocation (e.g. CPU allocation in proportion to the memory size)
- P2: Ignored memory access patterns (carbon impact of cache-misses is not proportional to the performance impact)
- P3: Minimum billing cutoff and coarse-grained rounding (e.g. Azure: 100 ms)
- P4: Default configuration combined with lack of carbon observability
- P5: Large code base (cold start latency may not be billed and can be mitigated by keep-alive and pre-warming policies)
- P6: Suboptimal lifetime management policy (e.g. fixed keep-alive policies)
The carbon footprint of serverless functions consists of operational and embodied carbon. Operational carbon primarily arises from power consumption and is influenced by the data center power usage effectiveness (PUE) and the carbon intensity (CI) of the used energy. It is crucial that the carbon model for serverless functions is meaningfully defined on a per-request basis. A per-request carbon model aligns with serverless’s pay-as-you-go billing and event-driven nature, and effectively captures the variable emissions of inputsensitive functions.
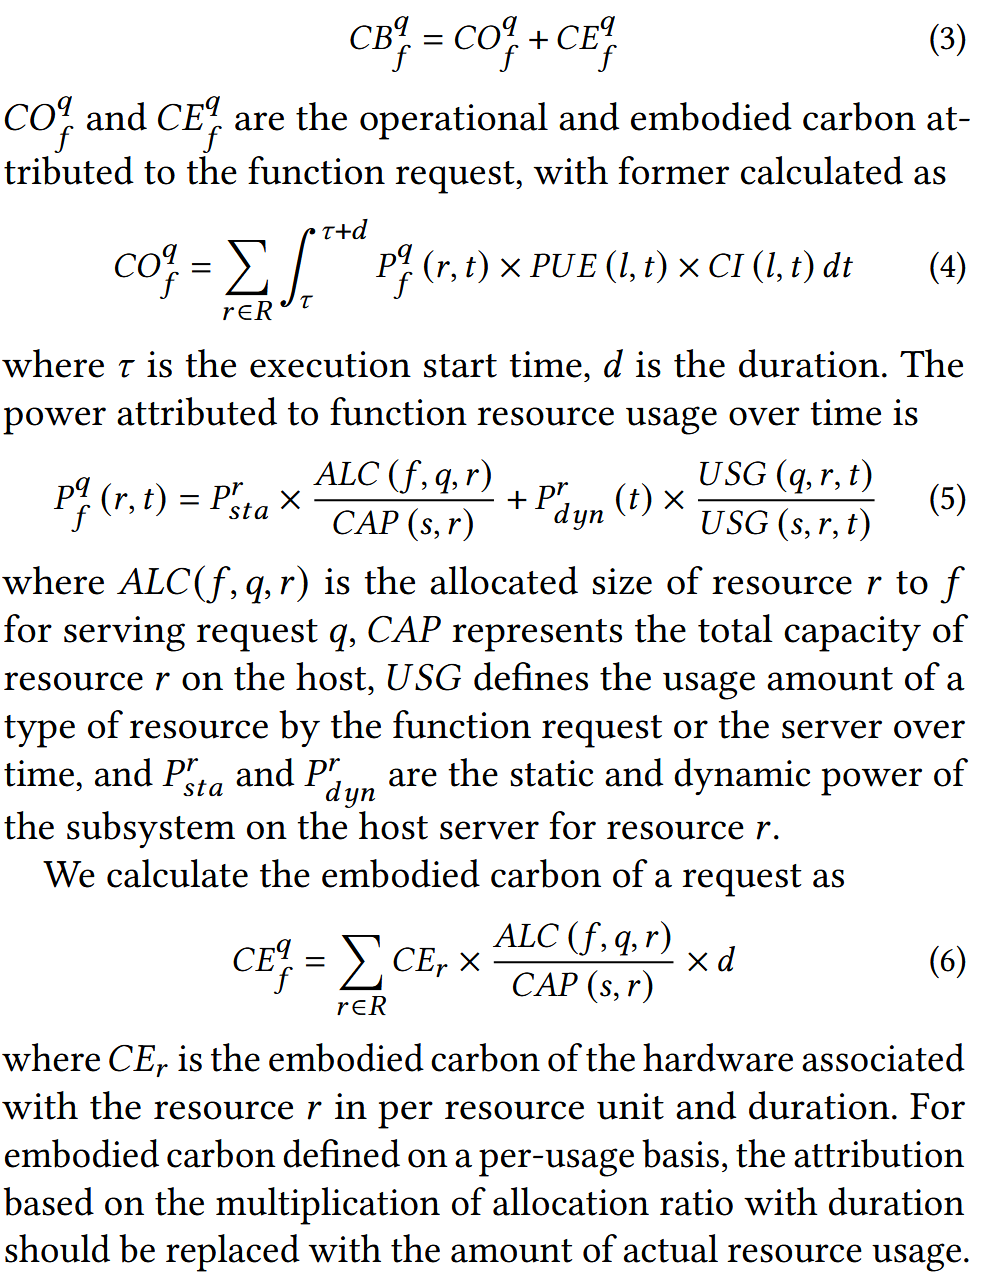
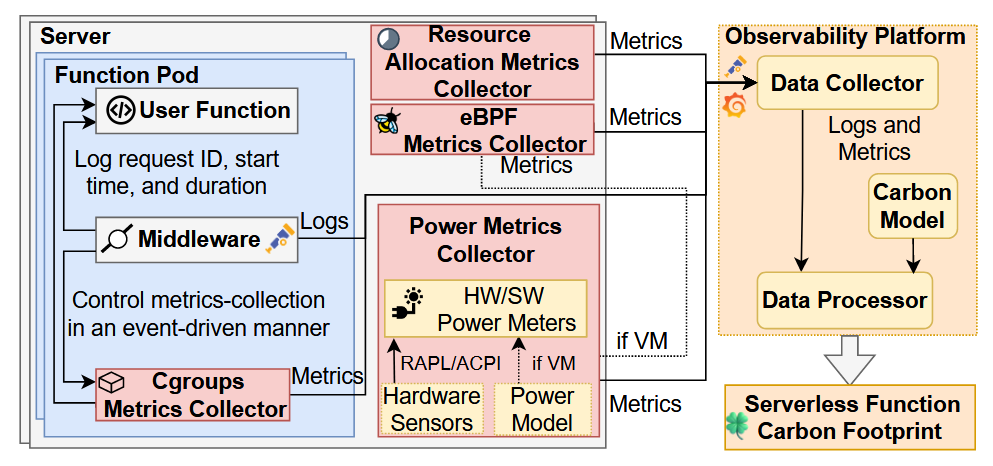
Figure 2: The architecture of the proposed metrics collection system and carbon observability framework.
An efficient system to collect carbon-related metrics is essential to assess the carbon footprint of serverless functions accurately. Figure 2 demonstrates the proposed system architecture. The required components in the metrics collection and observability framework are primarily based on opensource projects and cloud-native tools, such as eBPF [16], OpenTelemetry [24], and Grafana, ensuring system feasibility. For accurate per-request carbon footprints, the architecture targets serverless platforms with non-interleaving concurrency models. This is similar to the non-interleaving concurrency models used in AWS Lambda [34] and the default configuration of GCF [12]. This setup allows for differentiating carbon emission sources for each request and simplifies event-driven metrics collection.
Besides metrics, prior work has shown that request traces are essential for providing carbon footprints for applications at a fine-grained request level [37]. We leverage the function middleware and distributed tracing techniques (e.g., OpenTelemetry) to keep a log of function execution, such as function invocation request ID, execution start time, and execution duration. With function execution logs, the usage-based and allocation-based metrics obtained by various collectors with different sampling rates can be linked to each individual function request, thereby enabling carbon modeling on a per-request basis. The metrics and logs are pushed to the observability platform (e.g., Grafana) and used to calculate the carbon emission of individual function requests with the carbon model discussed in §4.2.
[37] Vaastav Anand, Zhiqiang Xie, Matheus Stolet, Roberta De Viti, Thomas Davidson, Reyhaneh Karimipour, Safya Alzayat, and Jonathan Mace. The odd one out: Energy is not like other metrics. ACM SIGENERGY Energy Informatics Review, 3(3):71–77, 2023.
Besides, we adopted an average server CPU utilization of 45% [43], an average last-level cache miss rate of 5 per 1,000 cycles [53], and an average cycle per instruction of 1.58 [55].
[43] Li Deng, Yu-Lin Ren, Fei Xu, Heng He, and Chao Li. Resource utilization analysis of Alibaba cloud. In Intelligent Computing Theories and Application: 14th International Conference, ICIC 2018, Wuhan, China, August 15-18, 2018, Proceedings, Part I 14, pages 183–194. Springer, 2018.
@Deng.etal.2018.ResourceUtilizationAnalysis
[53] Aamer Jaleel, Eric Borch, Malini Bhandaru, Simon C Steely Jr, and Joel Emer. Achieving non-inclusive cache performance with inclusive caches: Temporal locality aware (TLA) cache management policies. In 2010 43rd Annual IEEE/ACM International Symposium on Microarchitecture, pages 151–162. IEEE, 2010.
[55] Congfeng Jiang, Yitao Qiu, Weisong Shi, Zhefeng Ge, Jiwei Wang, Shenglei Chen, Christophe Cérin, Zujie Ren, Guoyao Xu, and Jiangbin Lin. Characterizing co-located workloads in Alibaba cloud datacenters. IEEE Transactions on Cloud Computing, 10(4):2381–2397, 2020.