Electricity consumption and operational carbon emissions of european telecom network operators
Status:: 🟩
Links:: Energy consumption of network communication Energy consumption per transferred data is a bad metric
Metadata
Authors:: Lundén, Dag; Malmodin, Jens; Bergmark, Pernilla; Lövehagen, Nina
Title:: Electricity consumption and operational carbon emissions of european telecom network operators
Publication Title:: "Sustainability"
Date:: 2022
URL:: https://www.mdpi.com/2071-1050/14/5/2637
DOI:: 10.3390/su14052637
Lundén, D., Malmodin, J., Bergmark, P., & Lövehagen, N. (2022). Electricity consumption and operational carbon emissions of european telecom network operators. Sustainability, 14(5), Article 5. https://doi.org/10.3390/su14052637
This study presents operational electricity consumption and greenhouse gas emissions for named European telecom network operators during 2015–2018. These results are also compared to data for 2010–2015. The study provides an extensive primary data set, collected from European Telecommunication Network Operators (ETNO) members, covering operations in Europe and beyond, providing data with higher granularity than publicly available sources. The collected data set corresponds to roughly 36 percent of European subscriptions and 8 percent of global subscriptions. This data set was used to calculate the aggregated annual electricity consumption for the assessed operators, as well as associated subscription intensities, in total, for Europe and per network type. Moreover, aggregated electricity-related carbon emissions and emissions from other sources were calculated. finally, estimates were made for the overall network operation in Europe for 2018 and 2020. The study concludes that the electricity consumption and number of subscriptions for the reporting telecom network operators remained nearly constant (+1 percent and −3 percent, respectively) between 2015 and 2018, while data traffic increased by a factor of three. For the extended period of 2010–2018, the electricity consumption per subscription remained quite stable, slightly below 30 kWh/subscription despite substantial data traffic growth (by a factor of 12).
Notes & Annotations
Color-coded highlighting system used for annotations
📑 Annotations (imported on 2024-04-29#16:50:48)
From the life cycle perspective, this study focuses on the use stage, i.e., the emissions of other life cycle stages of the telecom networks, such as electricity consumption and carbon emissions related to the manufacturing and disposal of hardware, are not included. Based on Reference [4] (Table IV.1), emissions related to other phases of the life cycle roughly represent an additional 16% if a world average energy mix is assumed.
[4] ITU. Recommendation L.1470 (01/20), L.1470: Greenhouse Gas Emissions Trajectories for the Information and Communication Technology Sector Compatible with the UNFCCC Paris Agreement, (Appendix IV); International Telecommunication Union: Geneva, Switzerland, 2020.
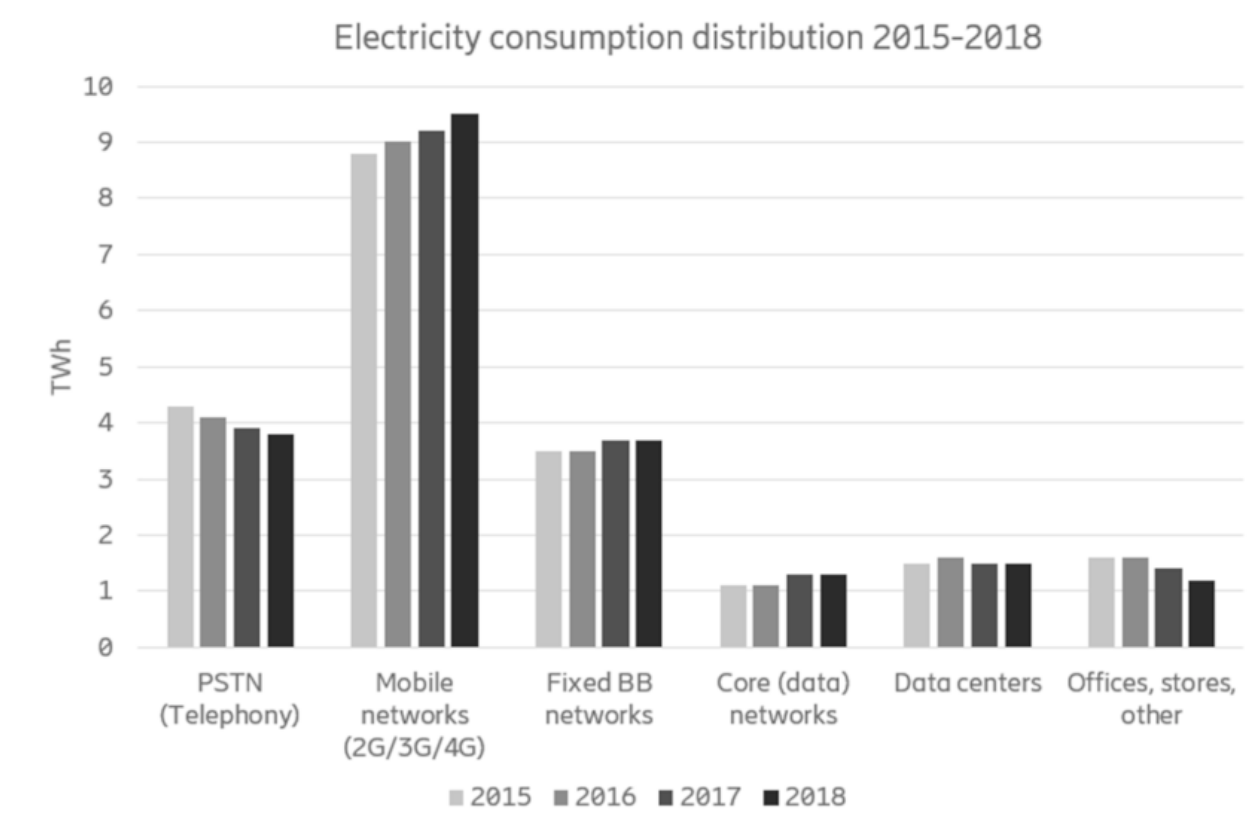
Figure 6. ETNO Operators’ total aggregated electricity consumption and trends per network type and overhead activity for the reporting ETNO operators of 2015–2018. These numbers exclude the electricity supply chain and distribution losses.
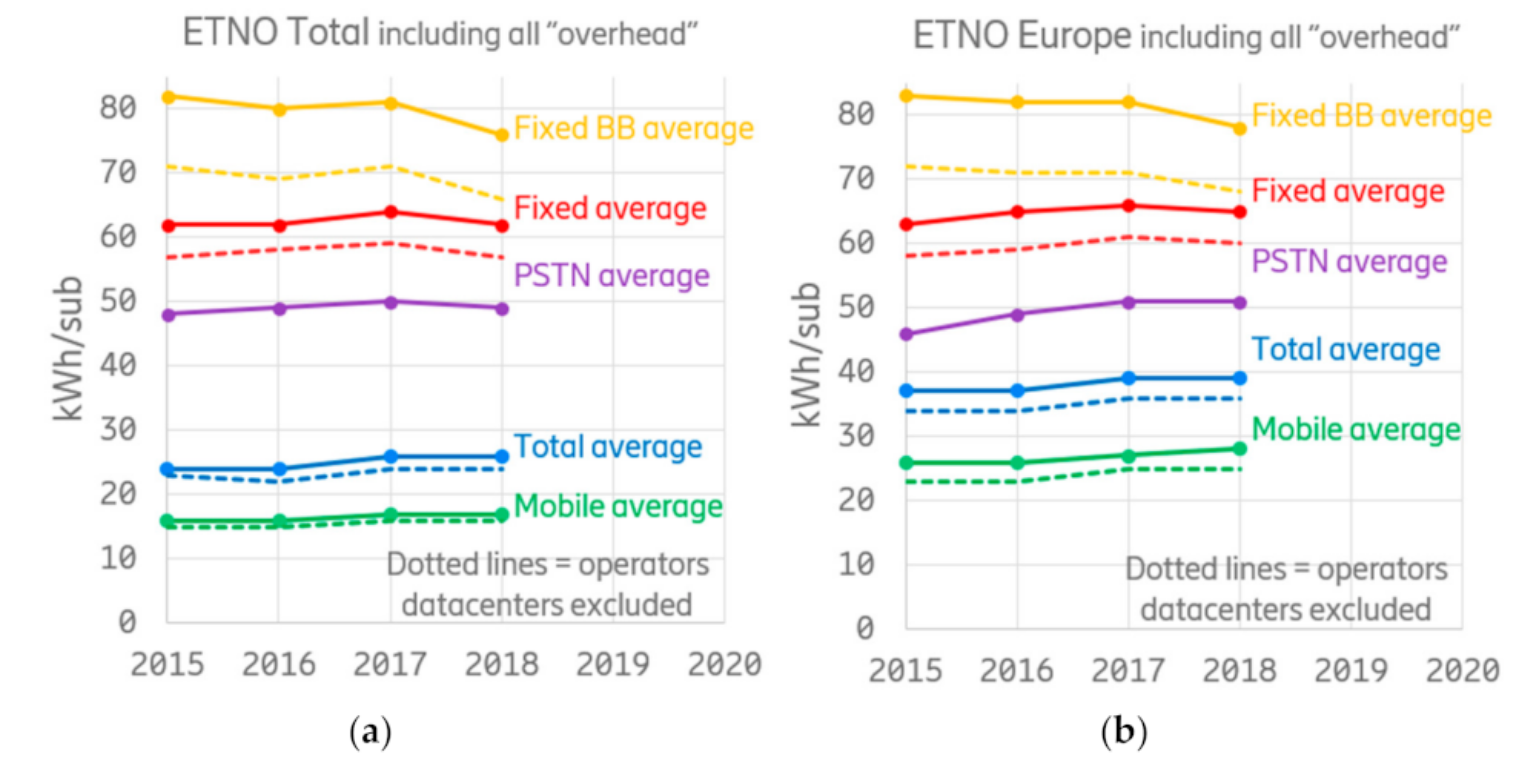
Figure 7. Electricity consumption per subscription for fixed, mobile, and combined subscriptions of the reporting ETNO Operators for (a) their overall reported operations and (b) those within Europe. The solid lines include all overhead, whereas the dotted lines exclude the operators’ data centers. Electricity supply chain and losses are not included.
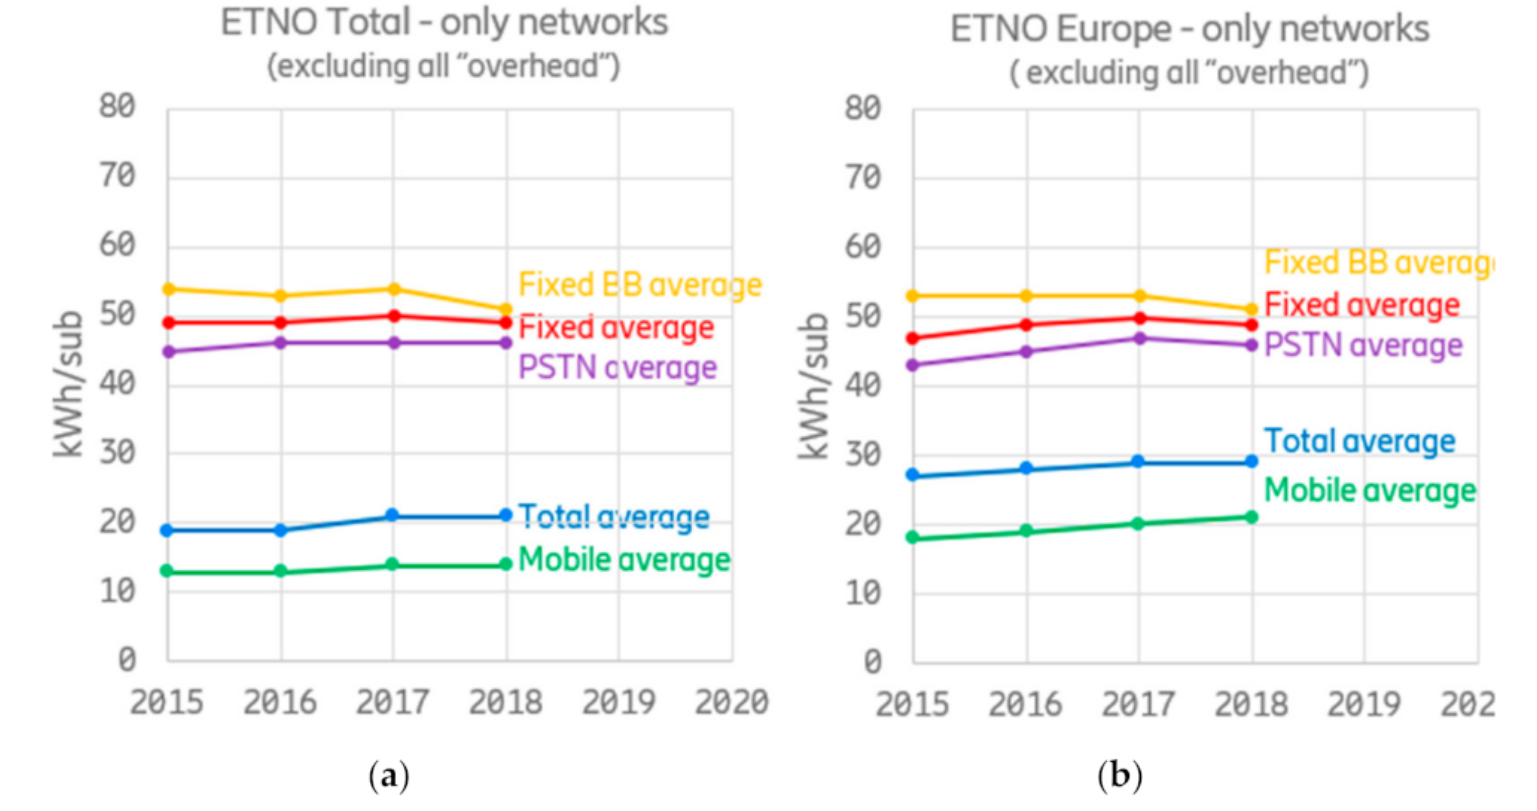
Figure 8. Electricity consumption for the network per subscription for fixed broadband, PSTN, and averages for the fixed, mobile, and total based on the (a) ETNO Total and (b) ETNO Europe data from all reporting network operators during 2015–2018.
Figure 12 shows the reporting network operator’s electricity consumption (indexed) compared to the indexed data traffic for the ETNO Operators of 2015–2018 (ETNO Total data set). In addition, the reported data set for the period 2010–2015 [10] has been included to derive the trend over a longer time interval. Data traffic was reported to a more limited extent for the period 2010–2015 and only for a few years and by a limited number of operators; thus, only data points for 2010 and 2015 have been included in the figure. The electricity consumption shown in figure 12 represents the overall electricity consumption for the reporting ETNO operators, hence including the operators’ overhead, network, and data center operations (details for each part were outlined in figure 6).
[10] Malmodin, J.; Lundén, D. The Electricity Consumption and Operational Carbon Emissions of ICT Network Operators 2010–2015; KTH: Stockholm, Sweden, 2018; p. 13.
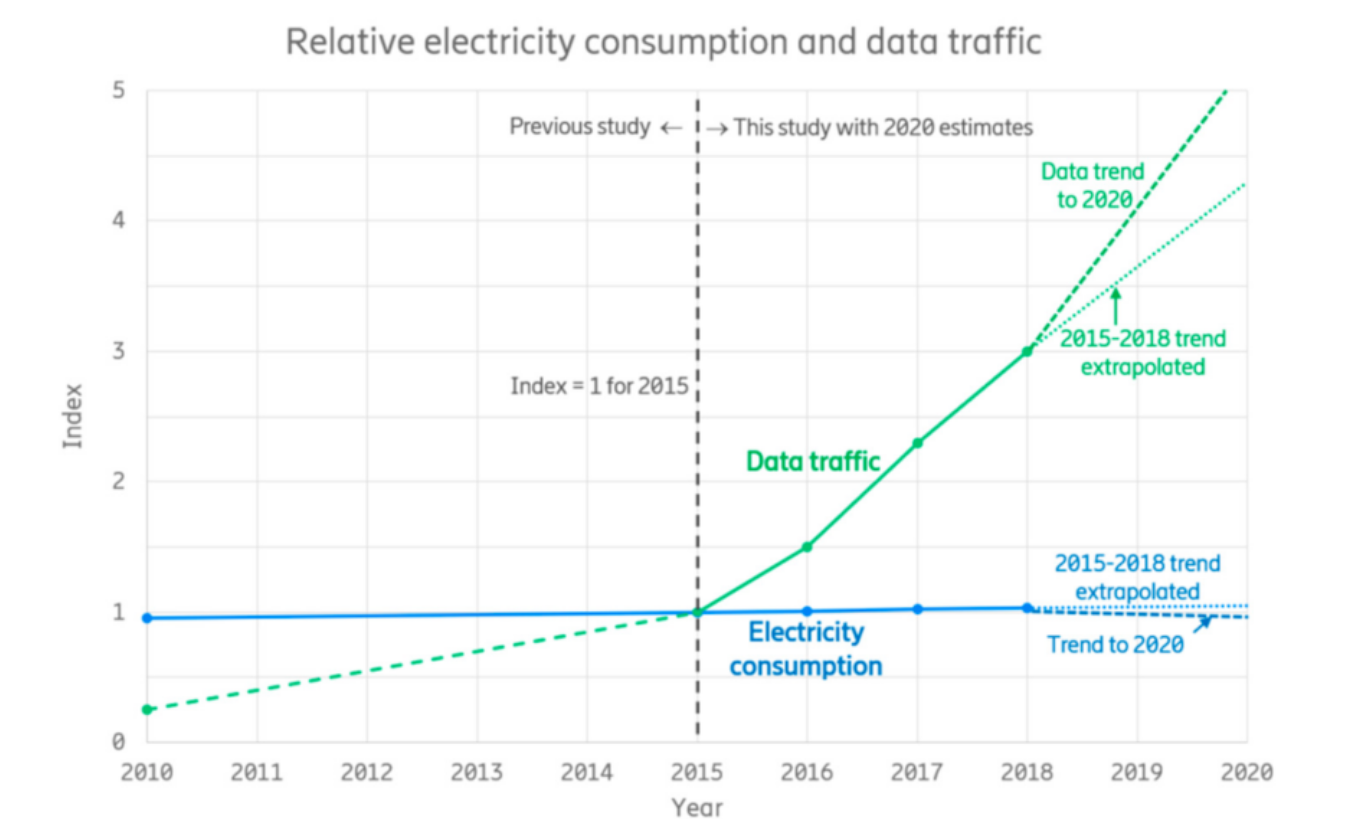
Figure 12. Electricity consumption and data traffic for the reporting ETNO operators of 2015–2018 (ETNO Total data set), also including less granular data reported for a more limited number of operators for the period of 2010–2015, as reported in Reference [10]. The electricity consumption and the data traffic for the full period have been indexed in relation to the 2015 level.
As illustrated in figure 12, there is a substantial growth in processed and transported data and, hence, increased capacity over time. However, this has not been followed by a corresponding increase in electricity consumption.
The data set for 2010–2015 showed an electricity growth of 5% during the period. Together with the 2015–2018 increase of 3%, the increase between 2010–2018 amounted to 9% (rounded values). In comparison, the data traffic grew by +300% (four times) in 2010–2015 and by +200% (three times) in 2015–2018, leading to +1100% (12×) between 2010 and 2018.
During the period of 2015–2018, the assessed ETNO Operators’ overall electricity consumption remained almost flat (just below 1% growth) and so did their total volume of ICT subscriptions (fixed and mobile), as shown in figure 3. During the same period, the data traffic increased about three times on average based on the data traffic reported by the ETNO Operators (see Section 3.7). This confirms the alignment between electricity consumption and number of subscriptions and the decoupling between electricity consumption and data traffic observed in the authors’ previous study of network operators [10]. This indicates that the electricity consumption of networks cannot be derived based on data intensities only. Instead, electricity consumption per subscription seems to be a reasonable basis for extrapolation when estimating the electricity consumption of networks.
This study shows that electricity consumption per subscription has been quite stable over the years for ETNO Europe and overseas operations. Hence, assuming this condition prevails, forecasts of electricity consumption and related carbon emissions can be based on subscription volumes. At the same time, this data set clearly shows the lack of a direct link between the growth in data traffic and electricity consumption.
This study focuses on operational emissions, but from a life cycle perspective, there are additional upstream embodied emissions covering the raw material acquisition, production, and transportation prior to the use, as well as downstream emissions related to end of life. For a complete picture of the total carbon emissions of networks, the embodied emissions need to be studied as well (These are expected to be in line with an additional 16% for world average electricity, as outlined in Section 2).
For 2018, the operational carbon intensity of the operators equaled 6.6-kg CO2 eq per subscription (excluding embodied emissions).
The intensities were quite constant for 2015–2018. For 2018, the electricity inten- sity per subscription (including overhead) was 62 kWh/subscription for fixed networks and 17 kWh/subscription for mobile networks, leading to a total average of 26 kWh/subscription.
For Europe, the intensity for the reporting telecom network operators (ETNO Europe) was 39 kWh/subscription for 2018, representing a slight increase over the period.
The overall electricity usage and operational carbon emissions of telecom operators are estimated as 38 TWh and 14 Mton CO2 eq for the EU (then including the UK) for 2018, and for 2020, the electricity consumption is estimated as 29 TWh for EU-27 (excluding the UK).