ICT Sector Electricity Consumption and Greenhouse Gas Emissions – 2020 Outcome
Status:: 🟩
Links:: Global energy consumption & carbon emissions of the whole ICT sector
Metadata
Authors:: Malmodin, Jens; Lövehagen, Nina; Bergmark, Pernilla; Lundén, Dag
Title:: ICT Sector Electricity Consumption and Greenhouse Gas Emissions – 2020 Outcome
Date:: 2023
URL:: https://papers.ssrn.com/abstract=4424264
DOI:: 10.2139/ssrn.4424264
Bibliography
Malmodin, J., Lövehagen, N., Bergmark, P., & Lundén, D. (2023). ICT Sector Electricity Consumption and Greenhouse Gas Emissions – 2020 Outcome. https://doi.org/10.2139/ssrn.4424264
Zotero
Type:: #zotero/journalArticle
Keywords:: [💎, ICT, carbon footprint, electricity consumption, embodied emissions, greenhouse gas emissions, Information and Communication Technologies]
Relations
Abstract
The Information and Communication Technology (ICT) sector has gained much attention in the discussions on climate change, as it could impact global emissions both positive and negative. The objective of the present study is to present estimates for the 2020 use stage electricity consumption and ICT sector’s greenhouse gas (GHG) emissions divided in three main parts user devices, networks and data centers. The study builds on a high number of data sources including measured and reported data from 150 companies that cover about 80% of network subscriptions, an estimated about 55% of datacenter electricity, and about 35% of upstream GHG emissions. To understand the development, the results are put into the perspective of earlier studies. In conclusion, the ICT sector used about 4% of the global electricity in the use stage and represented about 1.4% of the global GHG emissions in 2020. The user devices including internet-of-things accounted for over half of all GHG emissions, with equal parts relating to use stage and other lifecycle stages. For networks and data centers, the use stage GHG emissions are dominating. The electricity consumption in use stage and the total GHG emissions have increased since 2015, but the impact per subscriber has decreased. The electricity consumption and GHG emissions are also estimated for the closely related areas Entertainment and Media (E&M) including e.g., TVs and paper media, and the new area of cryptocurrencies.
Notes & Annotations
🟨 Note (last modified: 2023-08-22#16:15:05) (
Paper notes by David Mytton:
https://davidmytton.blog/ict-sector-electricity/
📑 Annotations (imported on 2023-08-01#15:58:14)
A recent comprehensive meta study by Bieser et al [18] could identify only six studies of the ICT sector carbon footprint, including both forecasts and estimations of the current situation. In particular, Bieser et al notes that all studies except [15] that focused on data for 2010-2015, are prospective studies. Of these, several made forecasts for 2020.
Data of electricity usage and GHG emissions has been collected from company reporting covering both electronic equipment companies, user device manufacturers, network manufacturers, operators and data center provides.
The embodied emissions for electronics, are estimated using the total embodied GHG emissions for the entire electronics industry [21]. The electronics included in all sectors was allocated to key user devices, but also other ICT devices, networks and data centers as well as other sectors [21]. It is based on data from company reporting in various parts of the electronics sector and an additional material and mechanics part was added for the ICT sector based on [23]. For key use devices the results were compared to published life cycle assessments and product carbon footprints scaled up by the sold number of devices for 2020 [21].
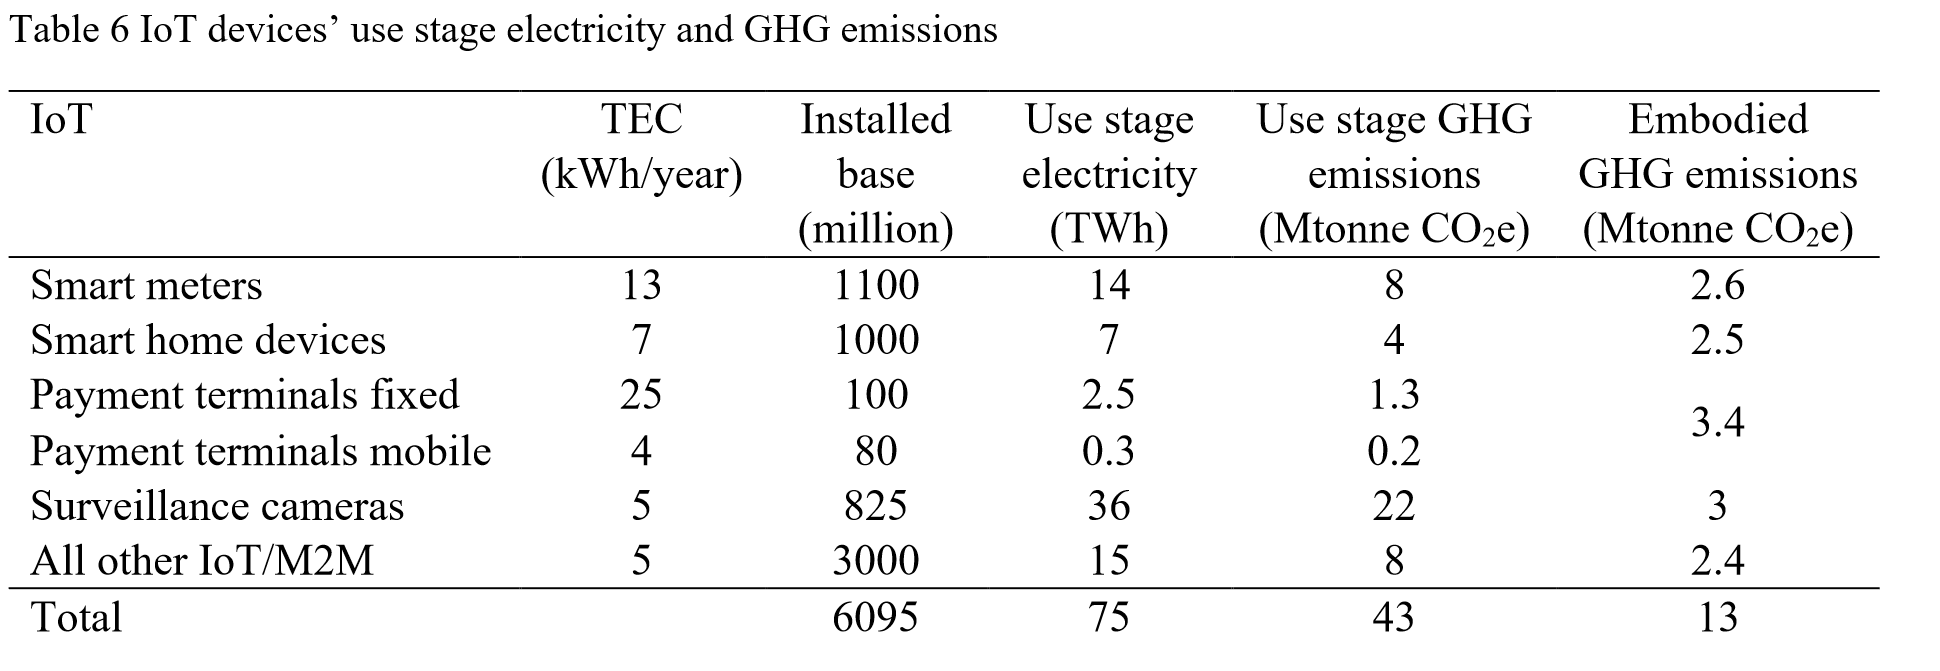
Use stage electricity and GHG emissions are collected in different ways for the four parts. For user devices, the typical total electricity consumption per device category is combined with the installed base to calculate the annual electricity consumption. A similar approach is applied for IoT devices.
When calculating the full emissions related to networks operations an emission factor of 0.03 kg CO2e/kWh is applied to the reported renewable electricity to also cover for the full supply chain, based on an LCA from Vattenfall [27].
The world average emissions factor of 0.538 kg CO2e/kWh includes the full life cycle emissions and effects relates to electricity production.
The use stage electricity consumption of all data centers globally was estimated to 205 TWh in 2018 (up from 194 TWh in 2010) using a model based on leading market statistics from Cisco and IDC, together with bottom-up modelling of servers, storage, and networks, and estimates of infrastructure overhead like cooling and power supply/back-up [24]. For 2020, Masanet et al made a forecast of 196 TWh [24].
The embodied carbon footprint of datacenter equipment is in total estimated to 30 Mtonne CO2e. Is consists of 23 Mtonne CO2e related to the electronics manufacturing industry (6% of 387 Mtonne CO2e) [37] and in addition, the embodied carbon footprint related to datacenter buildings and other non-electronic infrastructure is estimated to about 7 Mtonne CO2e based on numbers of new servers, estimate of emissions per server and a benchmark against various sources.
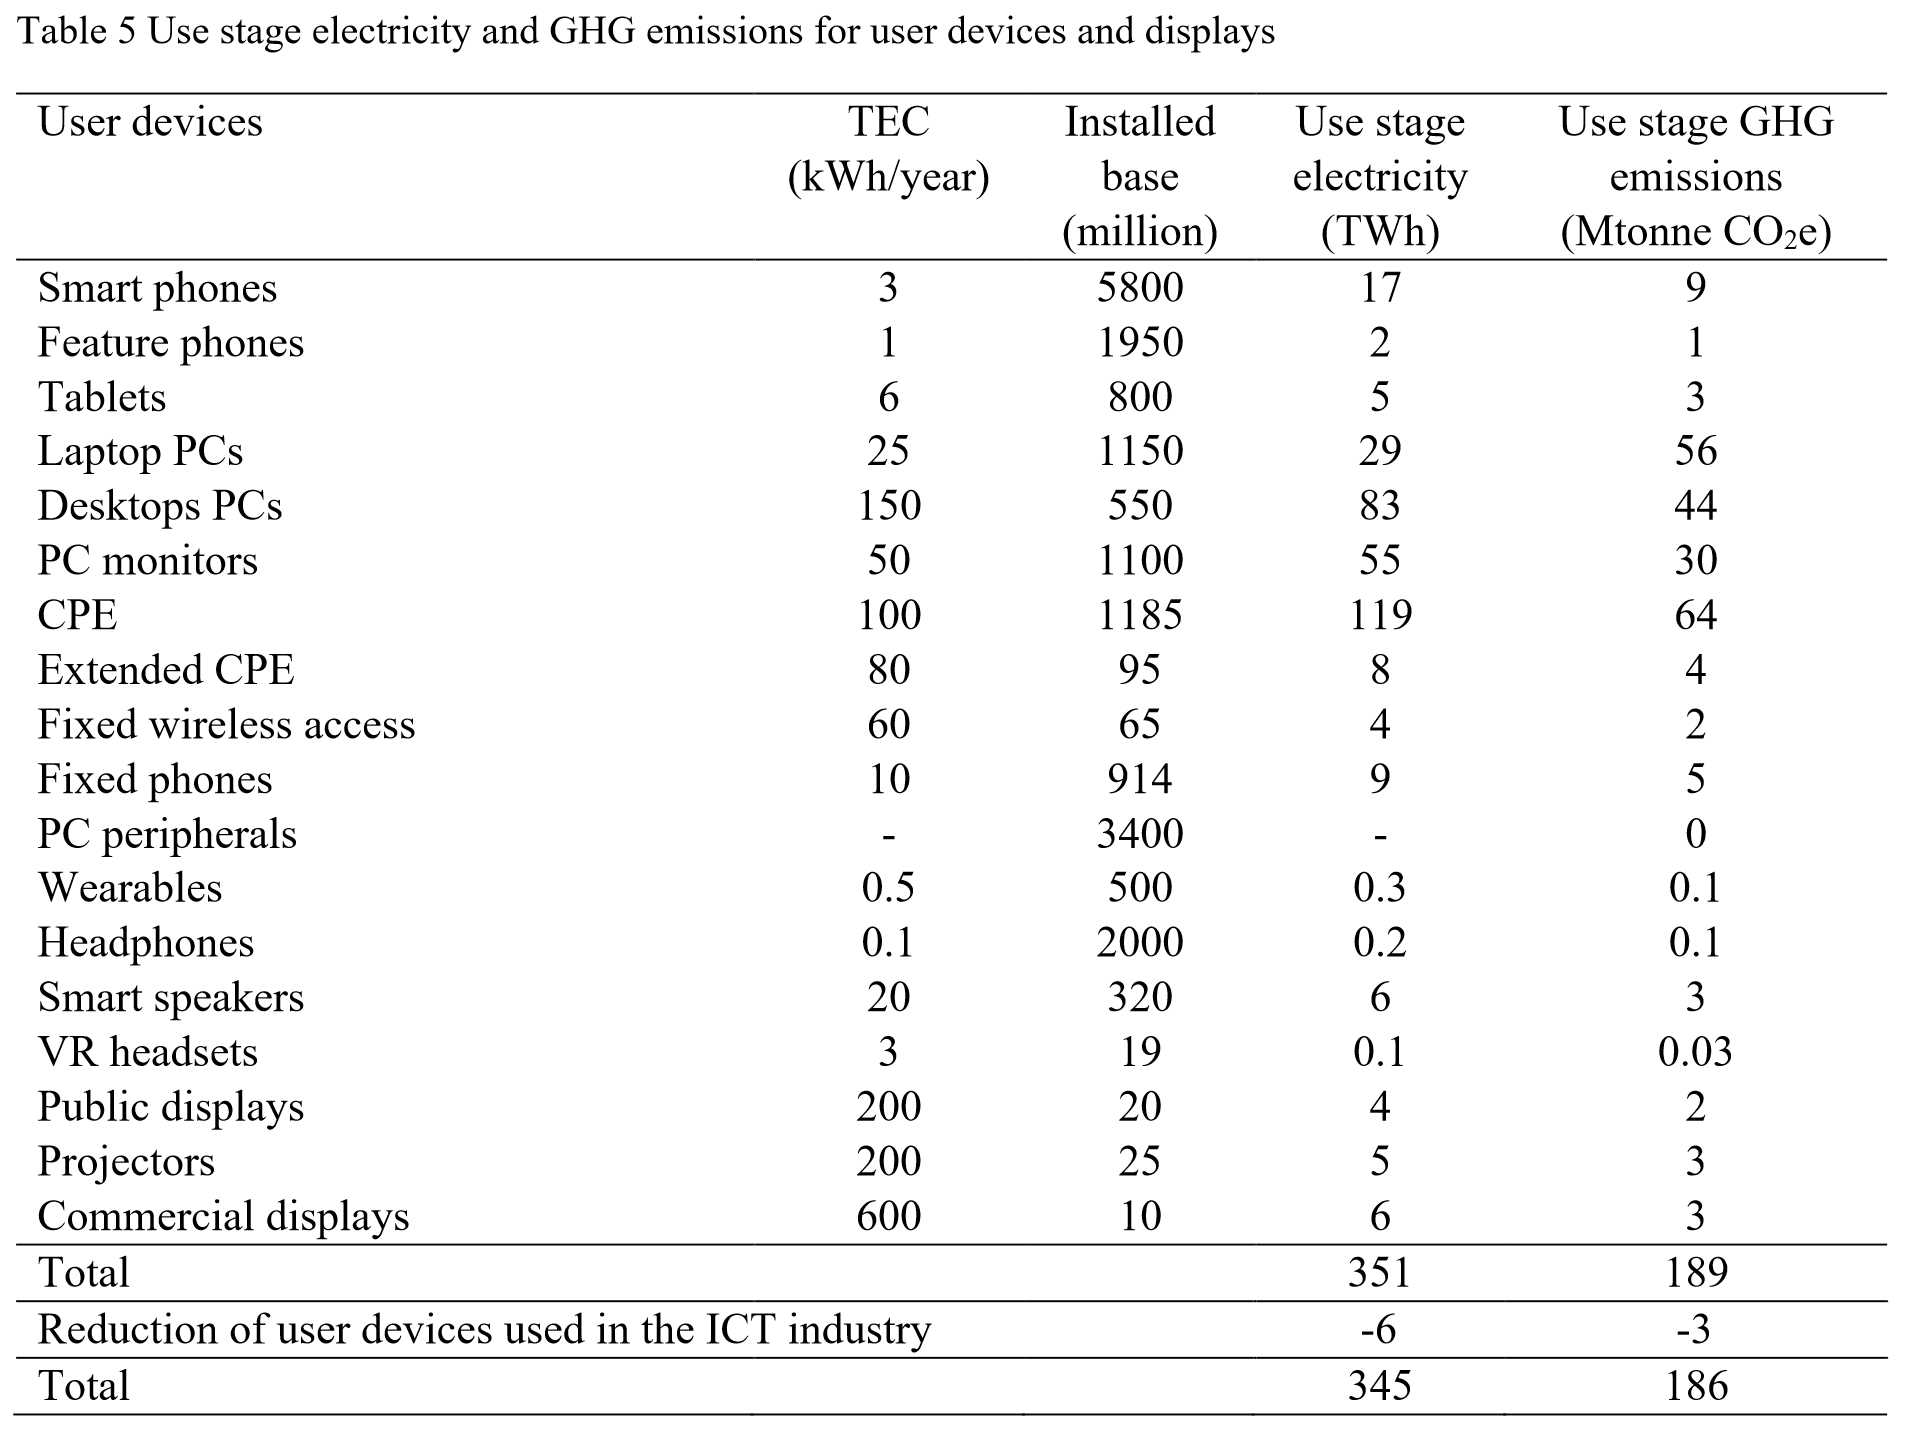
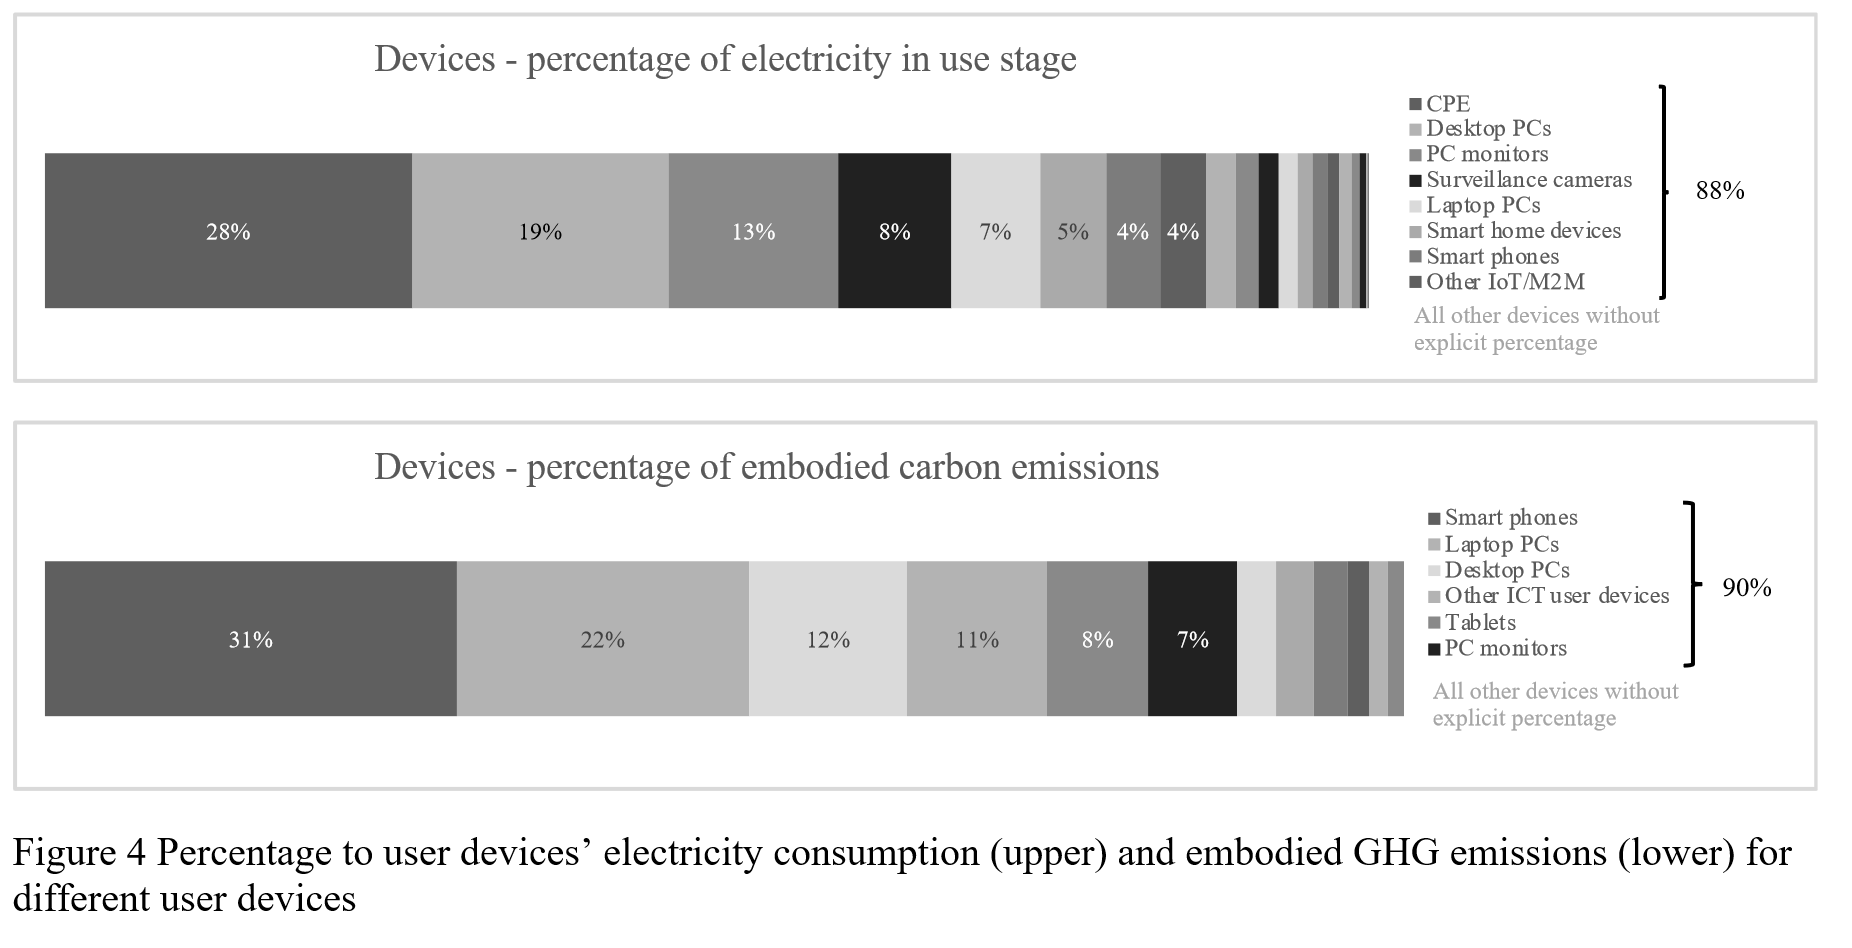
The most common user devices for communication are feature phones, smartphones, tablets, laptop and desktop PCs and the related PC displays and CPEs. For these user devices the total embodied GHG emissions for 2020 are about 180 Mtonne CO2e [21]. The rest of the ICT devices in Table 5 has an embodied GHG emission of 17 Mtonne which is calculated from the ‘Other ICT devices’ allocation in [37] and a removal of payment terminals and other IoT/M2 as these are included in Table 6.
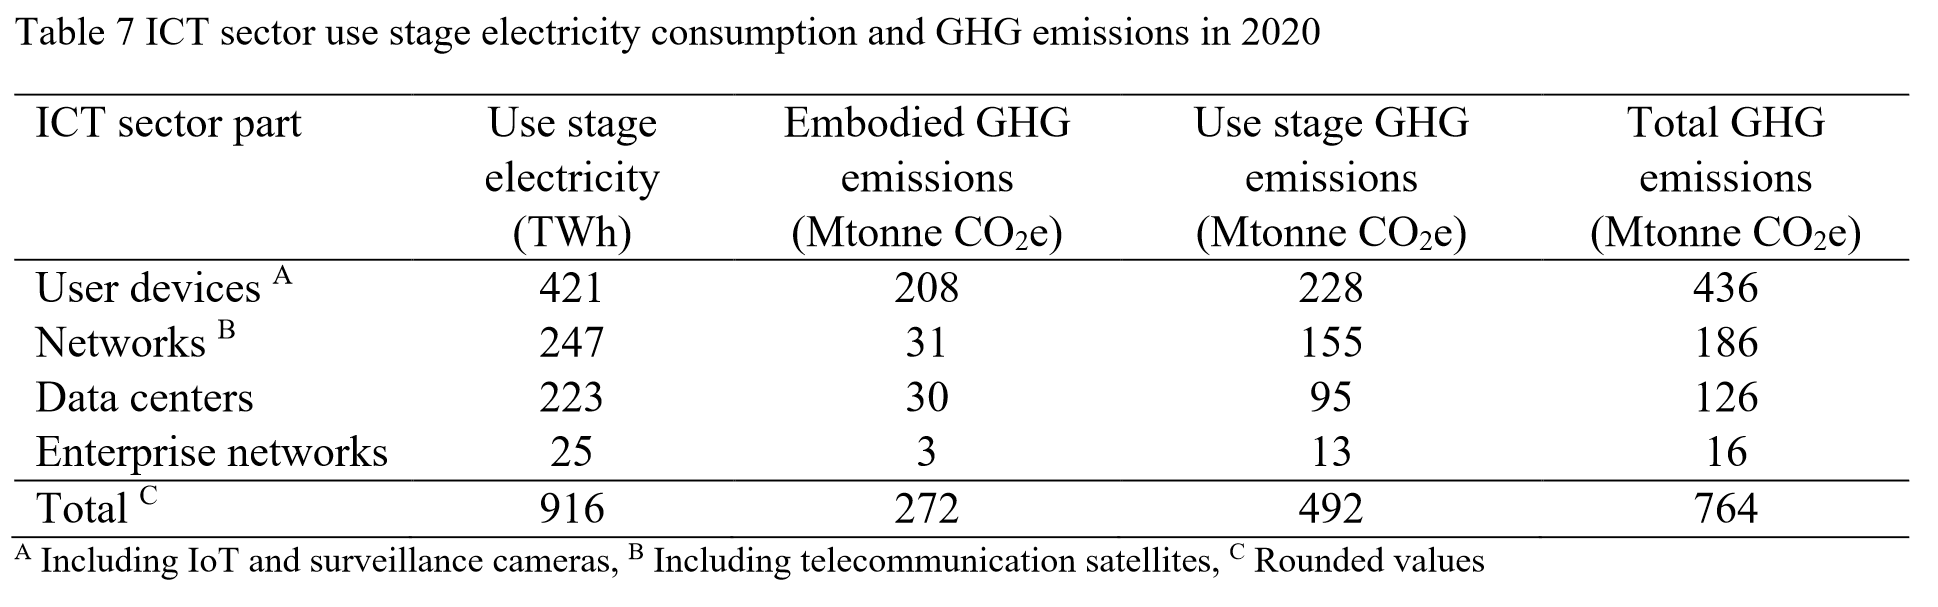
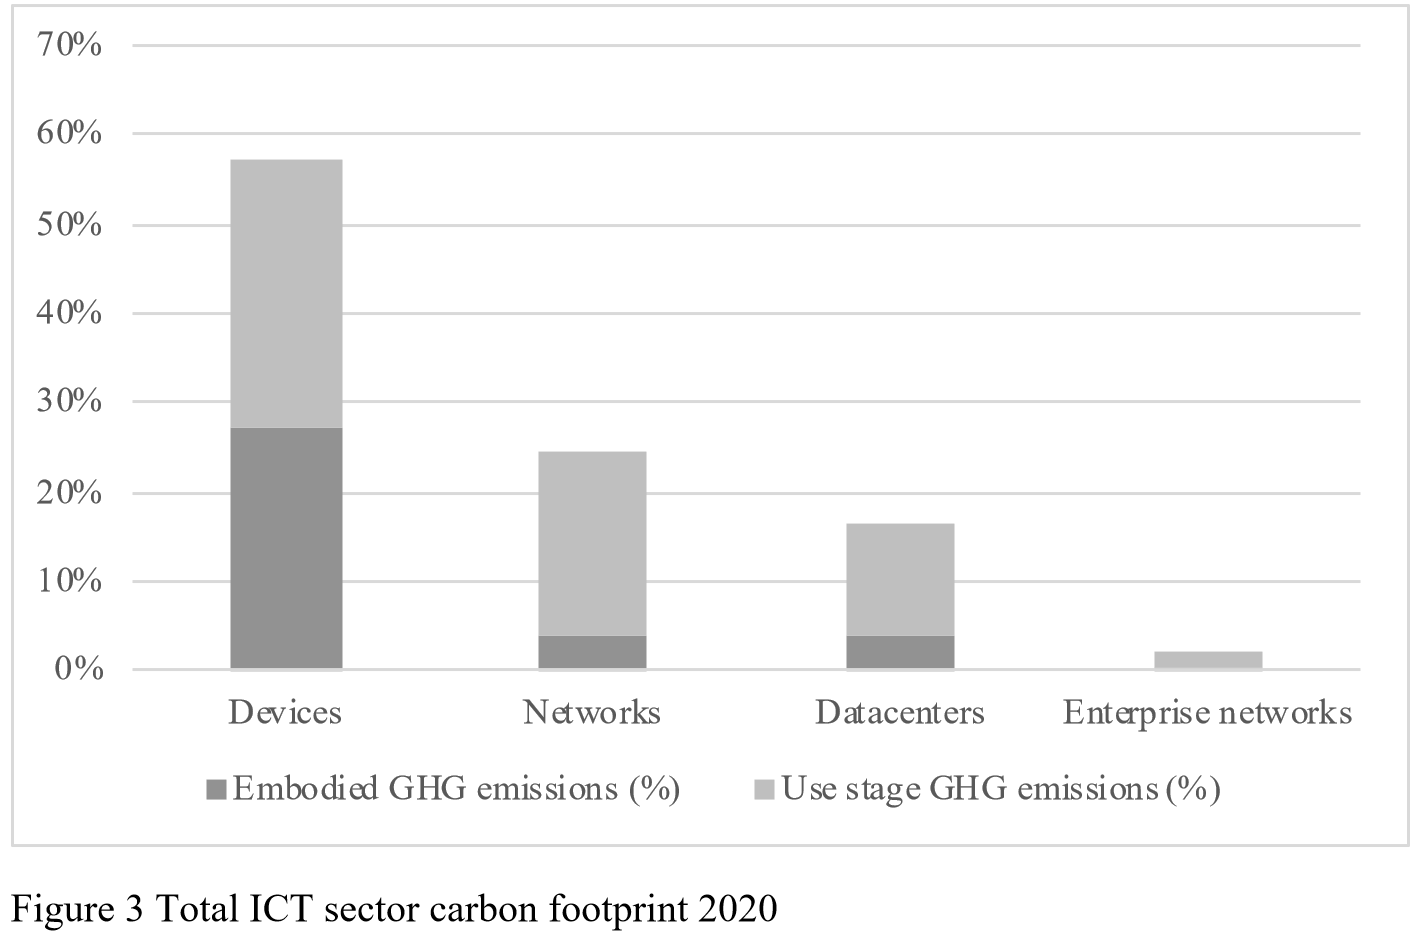
The total use stage electricity, related GHG emissions and embodied emissions are summarized for the different parts of the ICT sector in Table 7 ICT sector use stage electricity consumption and GHG emissions in 2020.
User devices represent the majority of the GHG emissions (about 57%), with almost equal parts relating to embodied and use stage GHG emissions, as shown in Figure 3.
The ICT sector represents about 1.4% of the global GHG emissions including land use effects presented by [43].
The ICT sector’s electricity consumption is about 3.9% when comparing to global electricity consumption figures from Enerdata (23584 TWh in 2020, 23742TWh in 2019) [44].
Studies have sometimes assumed that the ICT sector’s footprint will grow over time in line with the data traffic growth which has resulted in exaggerated estimates and forecasts. For this reason, allocating electricity consumption and GHG emissions to services or any type of use based on data traffic, e.g., datacenters footprints, is not recommended.
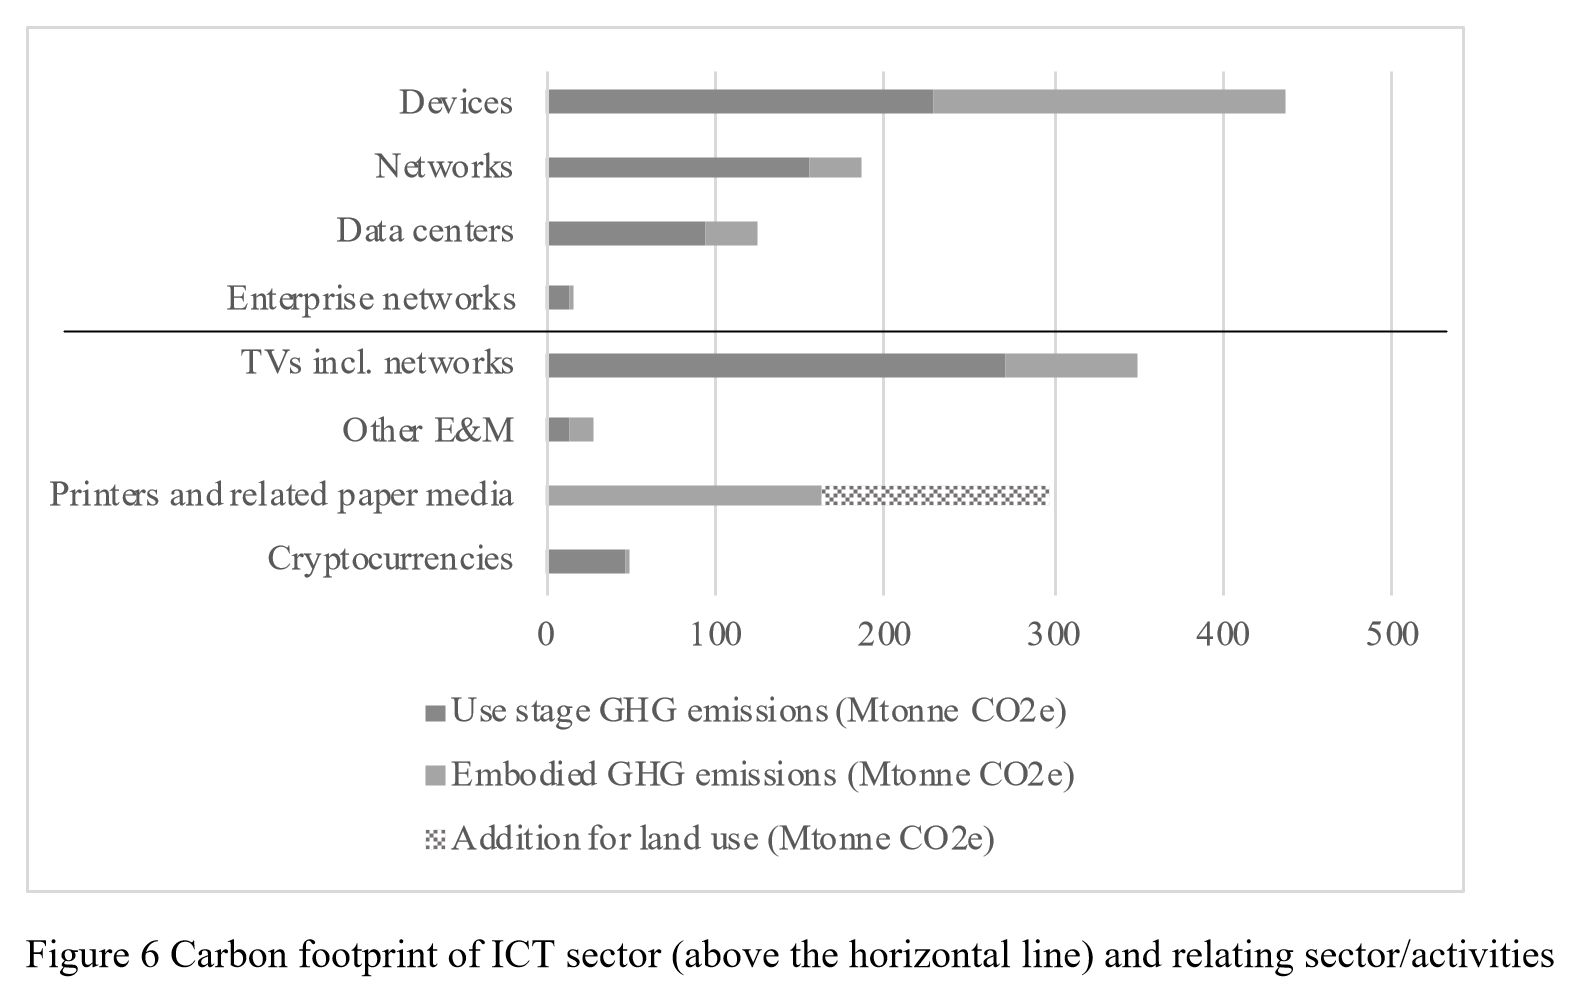
The boundaries for the ICT sector is not well-defined and sometimes the ICT sector is presented together with or including televisions and gaming (also referred to as the entertainment and media sector). Other related activities are printers and paper media and cryptocurrency mining.
TVs, TV peripherals and TV networks are likely the category outside ICT most closely related to ICT. Many other studies include the TV subsector as part of the ICT sector, at least TVs. The TV subsector is reported as part of the Entertainment and Media (E&M) sector and not part of the ICT sector that is defined as just IT and telecom. Also included in the E&M sector are e.g., gaming devices, audio and camera devices.
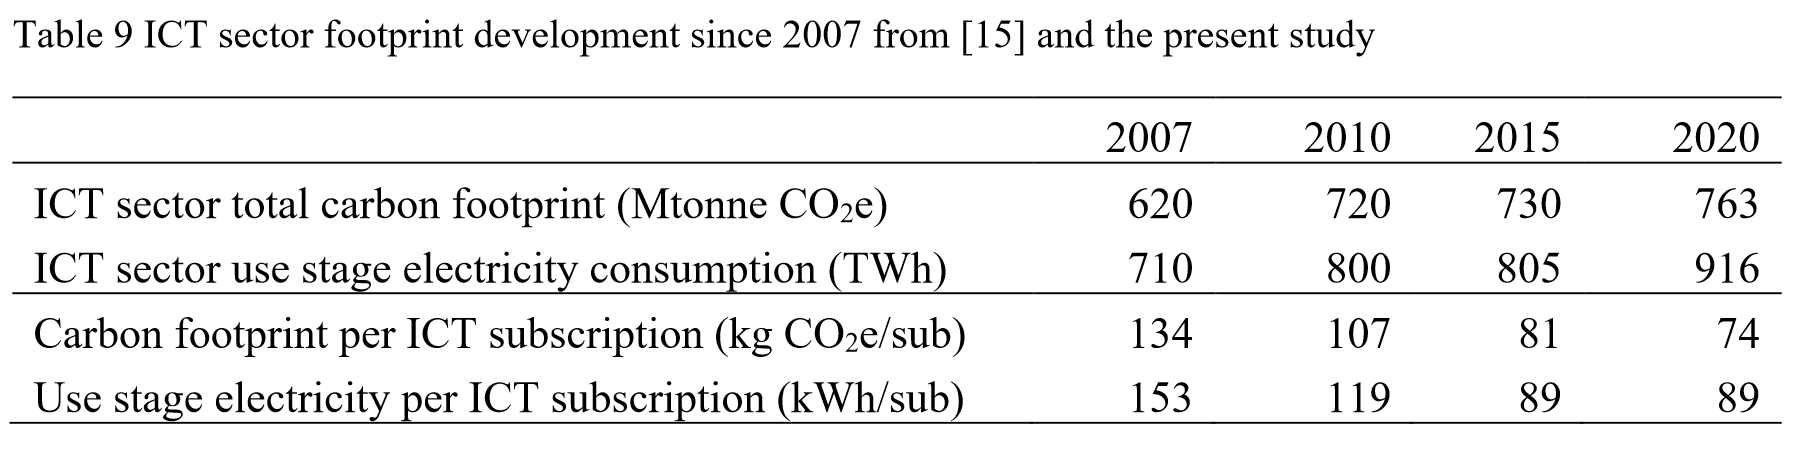
ICT sector used about 4% of the global electricity in the use stage and represented about 1.4% of the global GHG emissions in 2020 [43]- [44]. This shows that the ICT sector has developed in line with the rest of the world as the percentage of the total carbon footprint are at about the same level as in 2015, while the use stage electricity increased somewhat.
📑 Annotations (imported on 2023-08-01#16:22:27)
Calcuation of the percentage of the global GHG emissions in 2020:
Contribution of the ICT sector: 763 MtCOe
Total GHG emissions in 2020: 54 GtCO2e (Source: [43])
Share: 0,763/54 = 1,4 %