A call for research on storage emissions
Status:: 🟩
Links:: Carbon Footprint of Storage – HDD vs. SSD Carbon Footprint of ICT Devices
Metadata
Authors:: McAllister, Sara; Kazhamiaka, Fiodar; Berger, Daniel S; Fonseca, Rodrigo; Frost, Kali; Ogus, Aaron; Sah, Maneesh; Bianchini, Ricardo; Amvrosiadis, George; Beckmann, Nathan; Ganger, Gregory R
Title:: A call for research on storage emissions
Date:: 2024
URL:: https://hotcarbon.org/assets/2024/pdf/hotcarbon24-final126.pdf
DOI::
McAllister, S. et al. (2024) ‘A call for research on storage emissions’, in. HotCarbon 2024. Available at: https://hotcarbon.org/assets/2024/pdf/hotcarbon24-final126.pdf (Accessed: 18 July 2024).
Major cloud providers have committed to lowering carbon emissions by 2030 across their datacenters, and research has contributed many ideas on how this may be achieved. However, a major contributor to datacenter emissions has not received enough attention: storage. Storage — everything from file storage to inter-application messaging in datacenters — causes 33% of operational emissions and 61% of embodied emissions in Azure’s general-purpose cloud, based on a recent study.
Notes & Annotations
Color-coded highlighting system used for annotations
Slides: https://saramcallister.github.io/files/2024-hotcarbon-mcallister-slides.pdf
📑 Annotations (imported on 2024-07-18#11:41:22)
Recent data from Azure suggests that storage-related emissions — including storage racks and local storage devices make up 33% of operational and 61% of embodied emissions. Storage racks alone account for 24% of operational and 45% of embodied emissions [131].
As datacenters continue to target compute emissions and deploy renewable energy, storage will dominate overall datacenter emissions due to storage’s embodied emissions.
Cloud data storage today has two media options: hard-disk drives (HDD), for storing large amounts of data, and solid-state drives, for low-latency data access. SSDs are about 2-4x more expensive per bit than HDDs [1, 4]. For carbon, the difference is even more pronounced — SSDs require 3-10x more embodied emissions per bit [70, 128] and more power per bit (Sec. 3.1).
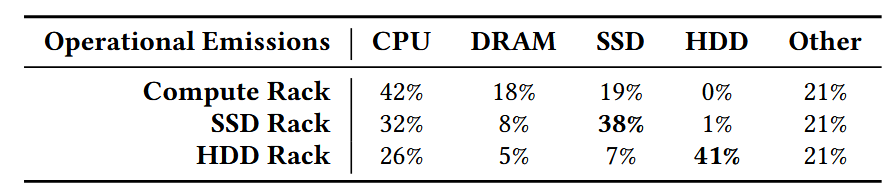
Table 2: Operational emission breakdown for Azure rack types.
Table 2 shows the relative operational emissions of each Azure rack type. To determine energy consumption and therefore operational emissions of different components, we take component energy draws measured under a representative load.
Notably, an SSD storage rack has approximately 4× the operational emissions per TB of an HDD storage rack.
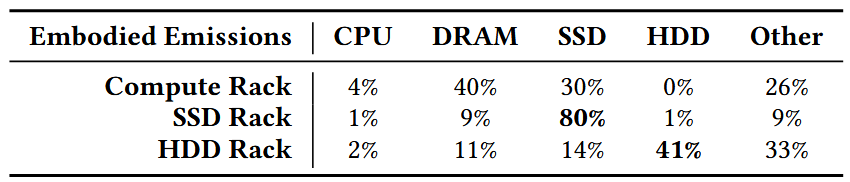
Table 3: Embodied emission breakdown for Azure racks.
We show the relative embodied emissions of each Azure rack type in Table 3. To estimate embodied emissions, we use raw material numbers from vendors, the device’s silicon area, and leverage IMEC [8] and Makersite [11] to determine average emissions for manufacturing processes. We ensure that manufacturing and shipping emissions are only counted once and are amortized across components, so that our embodied emissions results are comparable to our operational emissions results.
SSD racks emit approximately 10× the embodied emissions per TB as that of HDD storage racks. The storage devices themselves dominate embodied emissions, accounting for 81% and 55% of emissions in SSD and HDD racks, respectively.
Due to the relatively consistent power usage of both SSD and HDD clusters, shifting IO to reduce peaks or to when/where there is more renewable energy will not significantly reduce operational emissions. Conversely, increasing IO has little impact on operational emissions.
Move from SSDs to HDDs. As shown in Sec. 3, SSD servers emit more than HDD servers, both per-rack and per-bit. To reduce emissions, all applications that can tolerate HDD performance should be moved to HDDs.
IO bottlenecks are already becoming a challenge in datacenters for HDDs, primarily because higher-capacity HDDs do not increase their bandwidth. For instance, Seagate has LCA analysis for its Exos HDDs show that its 18 TB HDD has 59.6% fewer kg CO2e per TByear compared to its 10 TB drive [20, 21]. However, the 18 TB HDD’s bandwidth only increases 8.4% and has no increase in random 4KB IOPS [17, 18]. In order to use the 18 TB drives instead of 10 TB drives, we would need to reduce IO per GB stored. But there is little headroom available — many storage applications already saturate today’s HDD bandwidth.
If we push using fewer, denser devices to the extreme, we need to consider media typically meant for archival storage: tape [117], glass [29], and DNA [52, 104]. All of these media have much longer access times, so we would need workloads that can tolerate these longer access times. The potential benefit is lower emissions. Tape has the potential to lower emissions by 87% per bit [80]. Unfortunately, this estimate does not include the robots and climate control needed to deploy tape, which significantly offsets its emissions reduction. Both glass and DNA are much denser than tape, so they have the potential to reduce emissions, but we cannot determine their emissions potential until more data is available on their lifecycle embodied and operational emissions, particularly when factoring in their achievable IO.
The last method to reducing storage emissions is extending device lifetime, which amortizes embodied emissions. Expected lifetime in servers has already increased from the traditional estimate of 3 years to 5-7 years, depending on the datacenter [25, 75, 96, 97].
Extending storage lifetime comes with drawbacks, some of which are shared with compute. Newer devices tend to be more energyefficient, so in environments with significant operational emissions (e.g., with few renewables), extending lifetime can be detrimental to overall emissions. Embodied emissions are far more dominant in storage than in compute [70, 128], making this less of a concern.