How resiliency drives cloud carbon emissions
Status:: 🟩
Links:: Uptime Institute
Zotero Tags:: #zotero/✅ #zotero/💎
Metadata
Type:: #zotero/report
Authors:: Rogers, Owen
Title:: How resiliency drives cloud carbon emissions
Date:: 2022
Publisher:: Uptime Institute
URL:: https://uptimeinstitute.com/resources/research-and-reports/how-resiliency-drives-cloud-carbon-emissions
Bibliography
Rogers, O. (2022). How resiliency drives cloud carbon emissions (p. 22). Uptime Institute. https://uptimeinstitute.com/resources/research-and-reports/how-resiliency-drives-cloud-carbon-emissions
Zotero
Abstract
Distributing workloads across multiple locations helps users achieve resiliency. Users should be aware, however, that greater duplication can mean both higher costs, and greater carbon emissions. Using public emissions and cost data, this report quantifies the carbon footprint of several common architectures used in building resiliency into stateless cloud applications, and determines the level of protection and cost of each.
Notes & Annotations
The largest cloud provider, Amazon Web Services (AWS), reports on a user’s carbon emissions through its customer carbon footprint tool, and provides a basis for carbon reduction through its Well-Architected Sustainability Pillar. Google Cloud reports a user’s carbon emissions through its cloud portal, and makes some carbon data publicly available via GitHub. Microsoft Azure offers an emissions dashboard, accessible through its Power BI platform. Rather than forming an integral part of its cloud management portal, however, Microsoft’s dashboard must be installed on Power BI and is subject to usage charges. Independent platforms for tracking cloud emissions are also available from startups such as Greenpixie and Kainos.
Cloud providers can claim net-zero carbon emissions at a data center by matching avoided and / or captured emissions against emissions of consumed energy. This does not mean the provider is not producing carbon — it means the provider is transferring the carbon emissions to another organization’s share of carbon emissions or renewable energy use. Carbon offsets and RECs do not cut carbon sustainably, in the long term.
In the cloud model, application performance and resiliency are primarily the user’s responsibility — although many users do not fully realize this. Cloud providers offer services that users use to build applications; effectively, their responsibility ends with the provision of these services. The analogy of cloud services as toy bricks may seem trite, but it conveys some fundamental aspects of the cloud model effectively. The cloud provider is not responsible for the efficiency or performance of the applications that the customer builds.
The cloud model allows users to consume services when they need them; but this flexibility and freedom means users can consume more than they need, increasing costs and carbon emissions. To help manage this, cloud providers ask users to turn off capacity they do not need, and to resize virtual machines (VMs) to achieve higher utilization levels.
Cloud providers are also asking users to consider moving workloads to alternative regions where the electricity supply is less carbon heavy — a win-win situation that can often result in lower costs for customers and lower carbon emissions for providers. It is still the user’s job to make these changes, however, and to report their emissions accurately.
SPECpower is a database of power consumption at various points of utilization for a wide range of servers. Power is converted to an estimate of carbon emissions using data sourced from the European Environment Agency, the US Environmental Protection Agency and carbonfootprint.com.


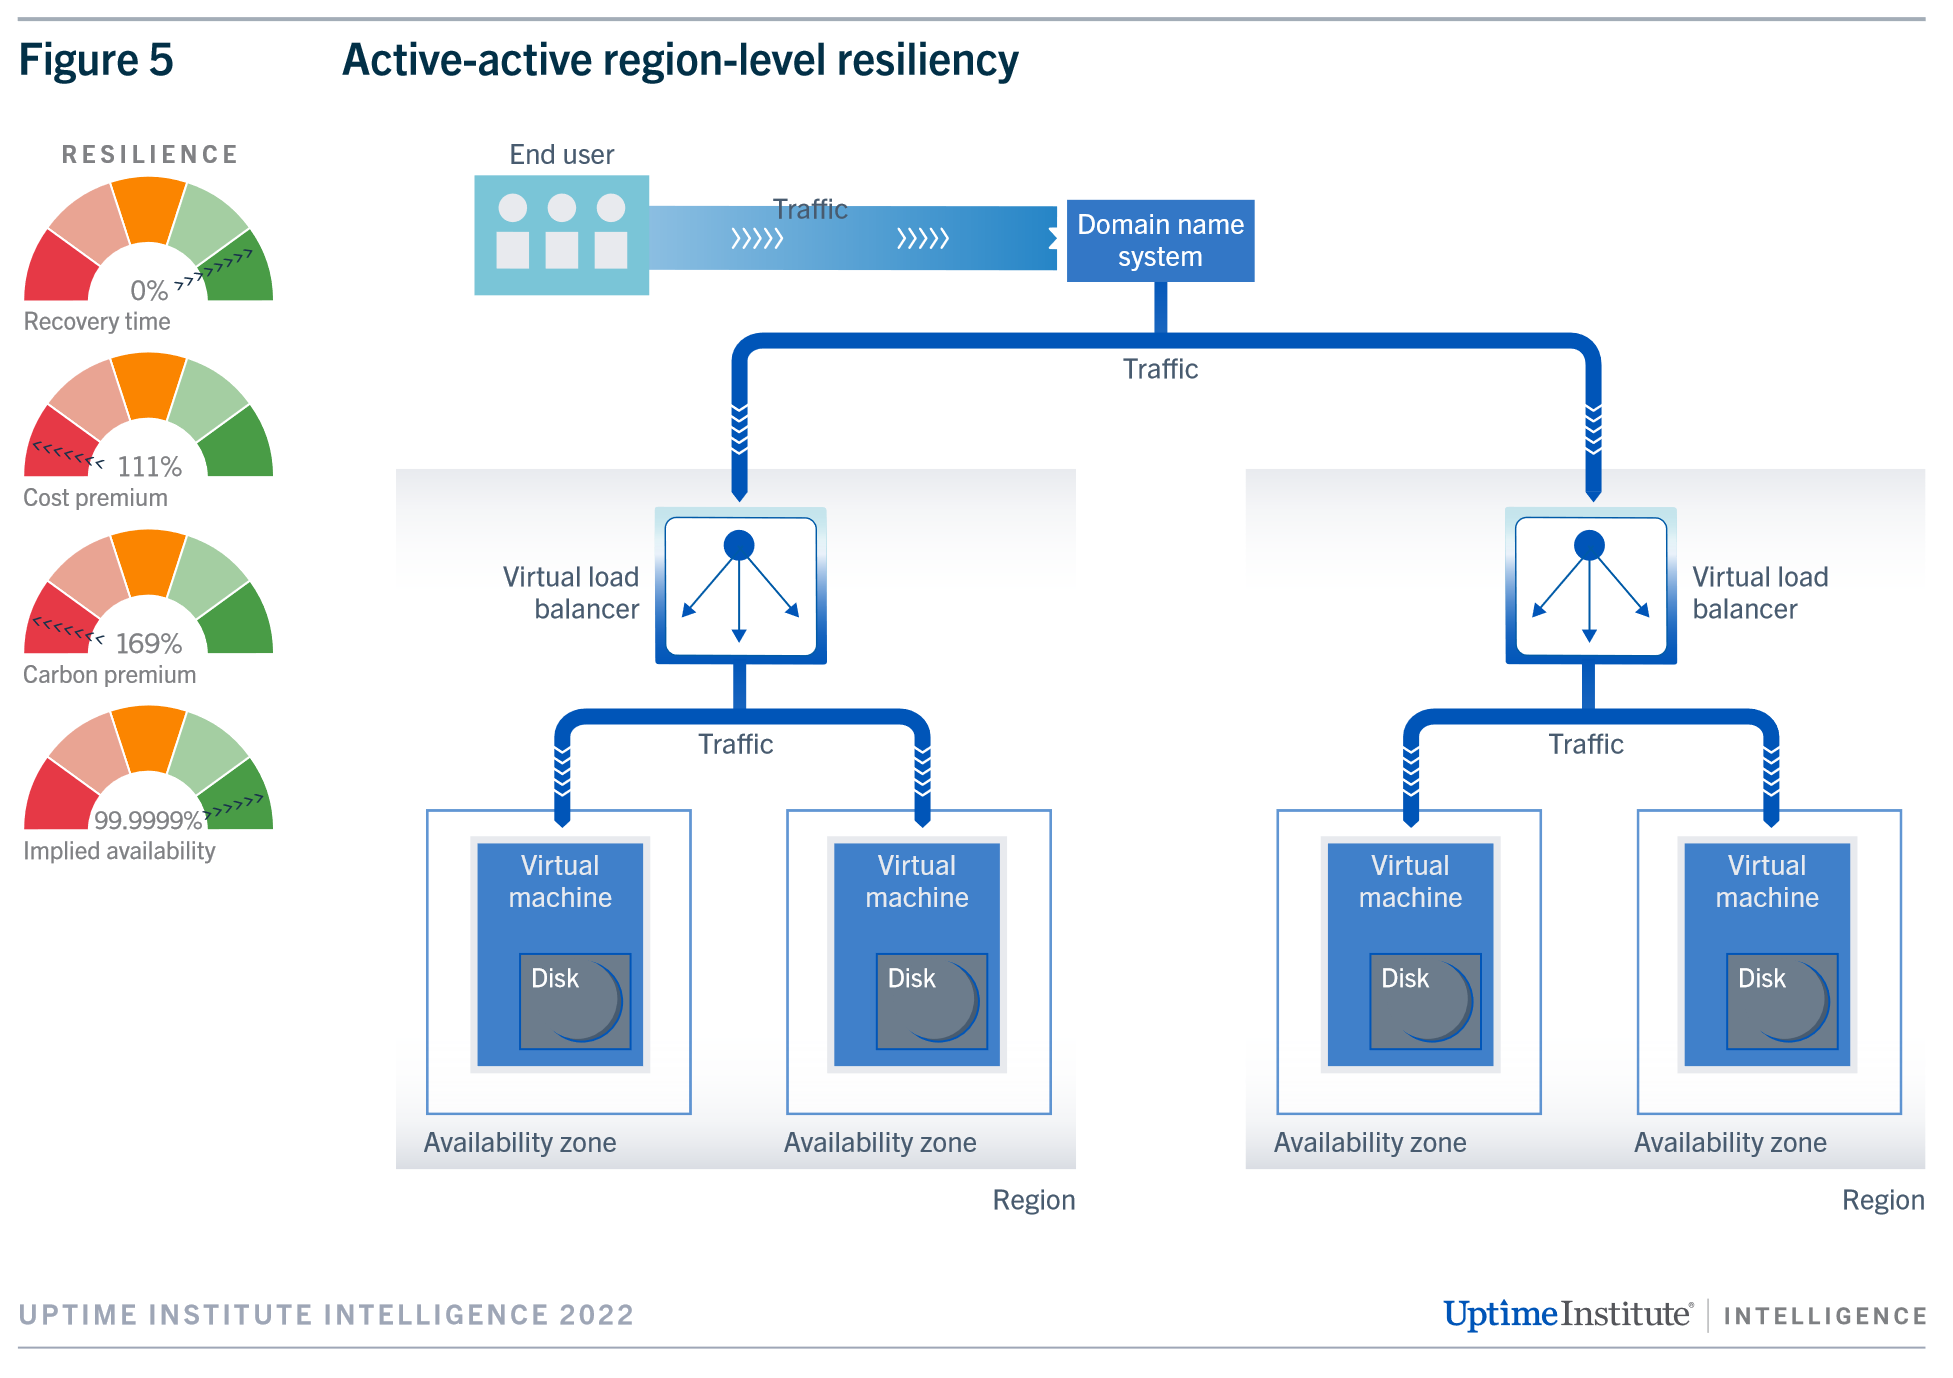
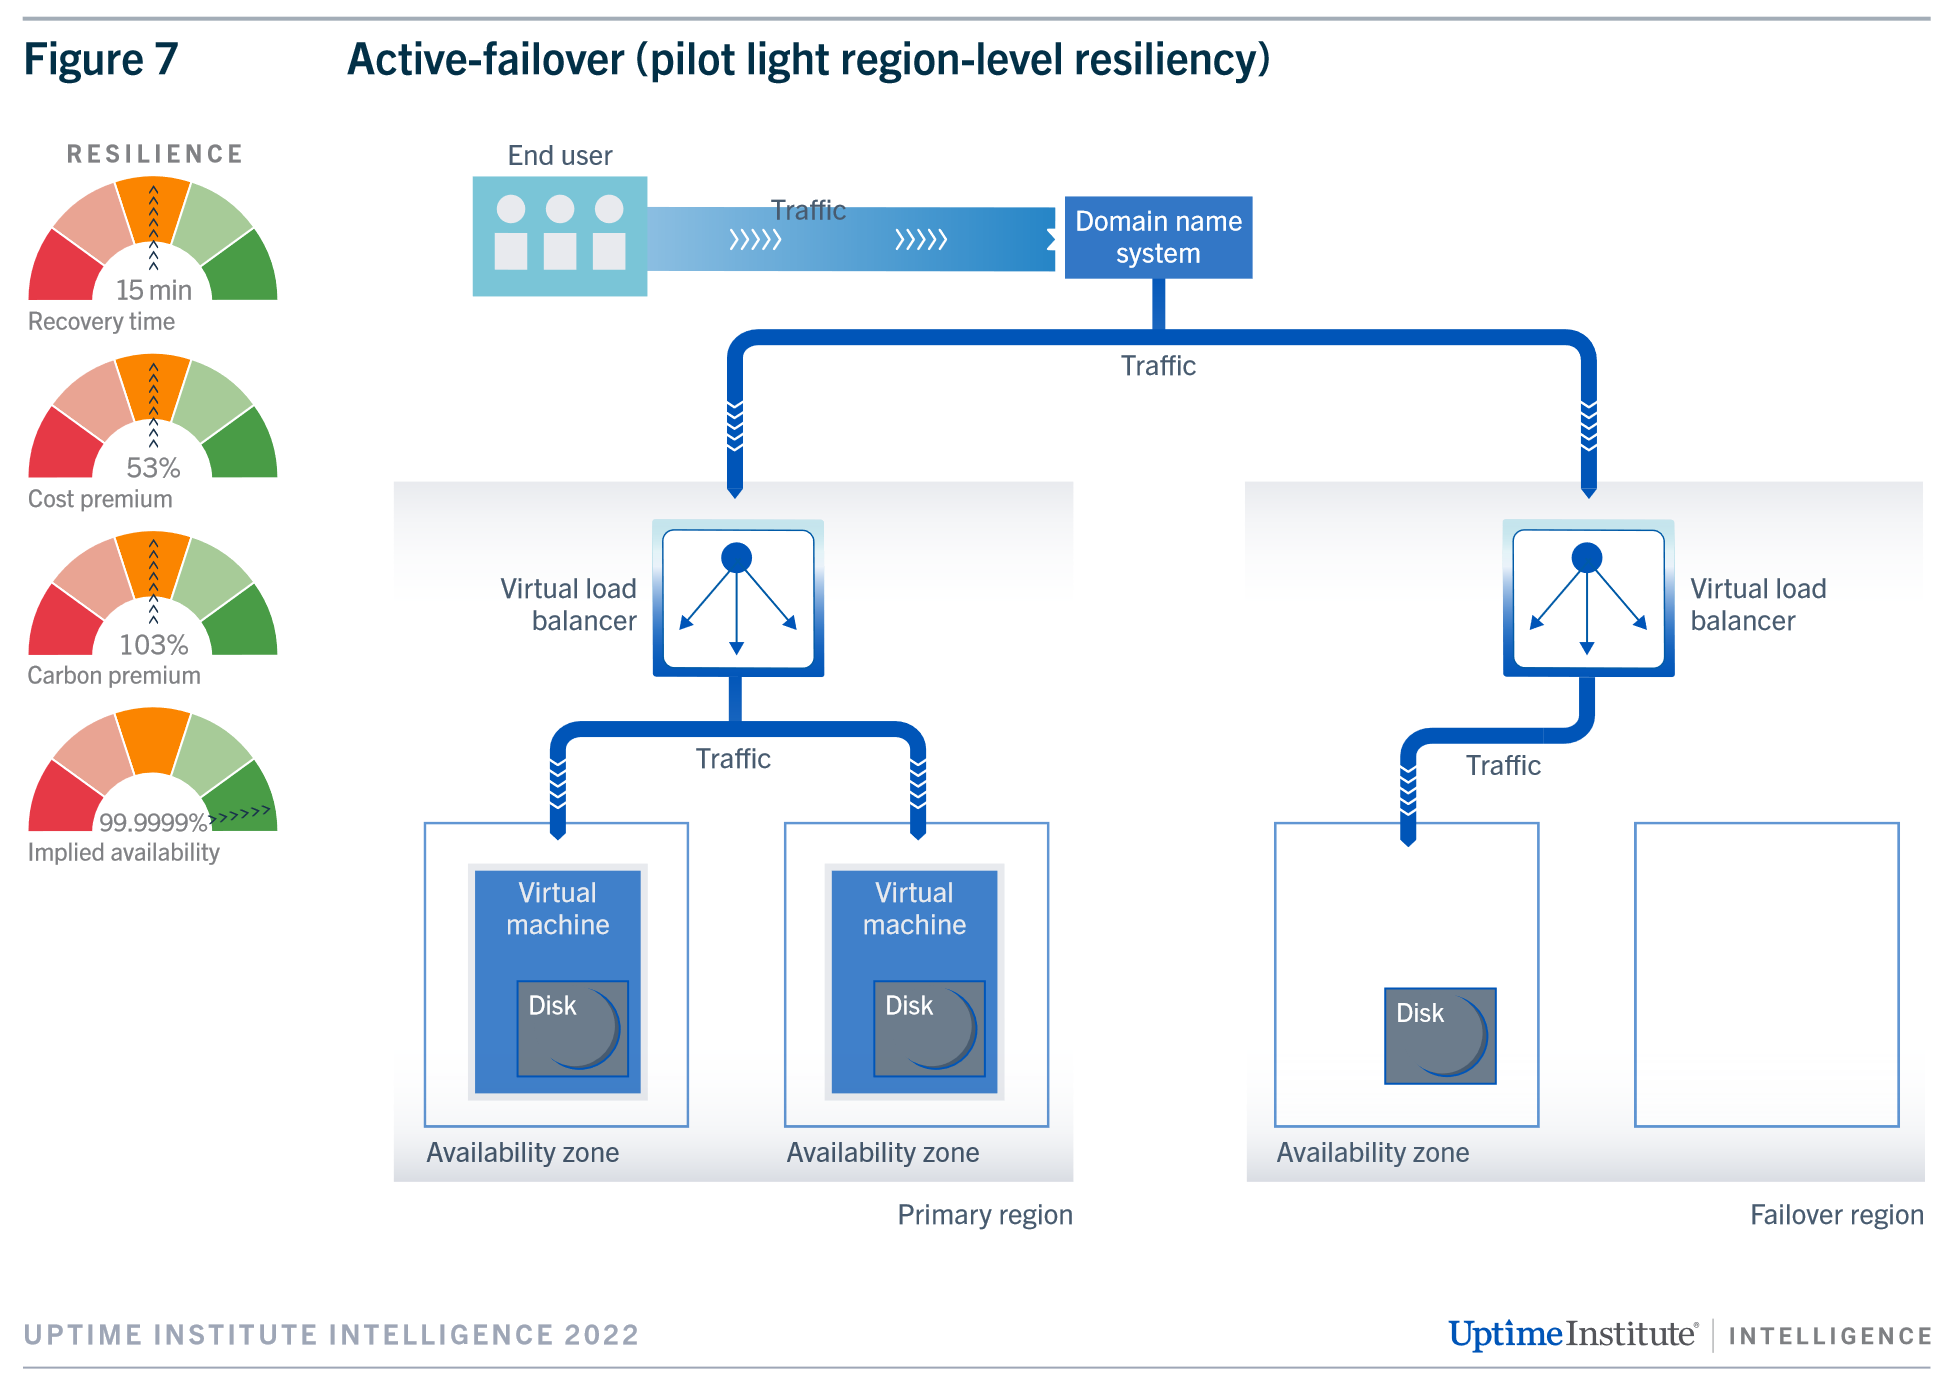
In the cloud model, users can architect resiliency into their applications by distributing workloads across locations. By duplicating workloads, applications consume more cloud resources. Users consume more physical servers and power by consuming more cloud resources, and this greater consumption translates into greater carbon emissions.
In active-active models, underutilized VMs compound the carbon footprint of the application. The basis of active-active is that there are sufficient spare resources to take the strain should the whole zone or region go down. These excess, idle resources generate carbon even when not deriving any value for the organization.
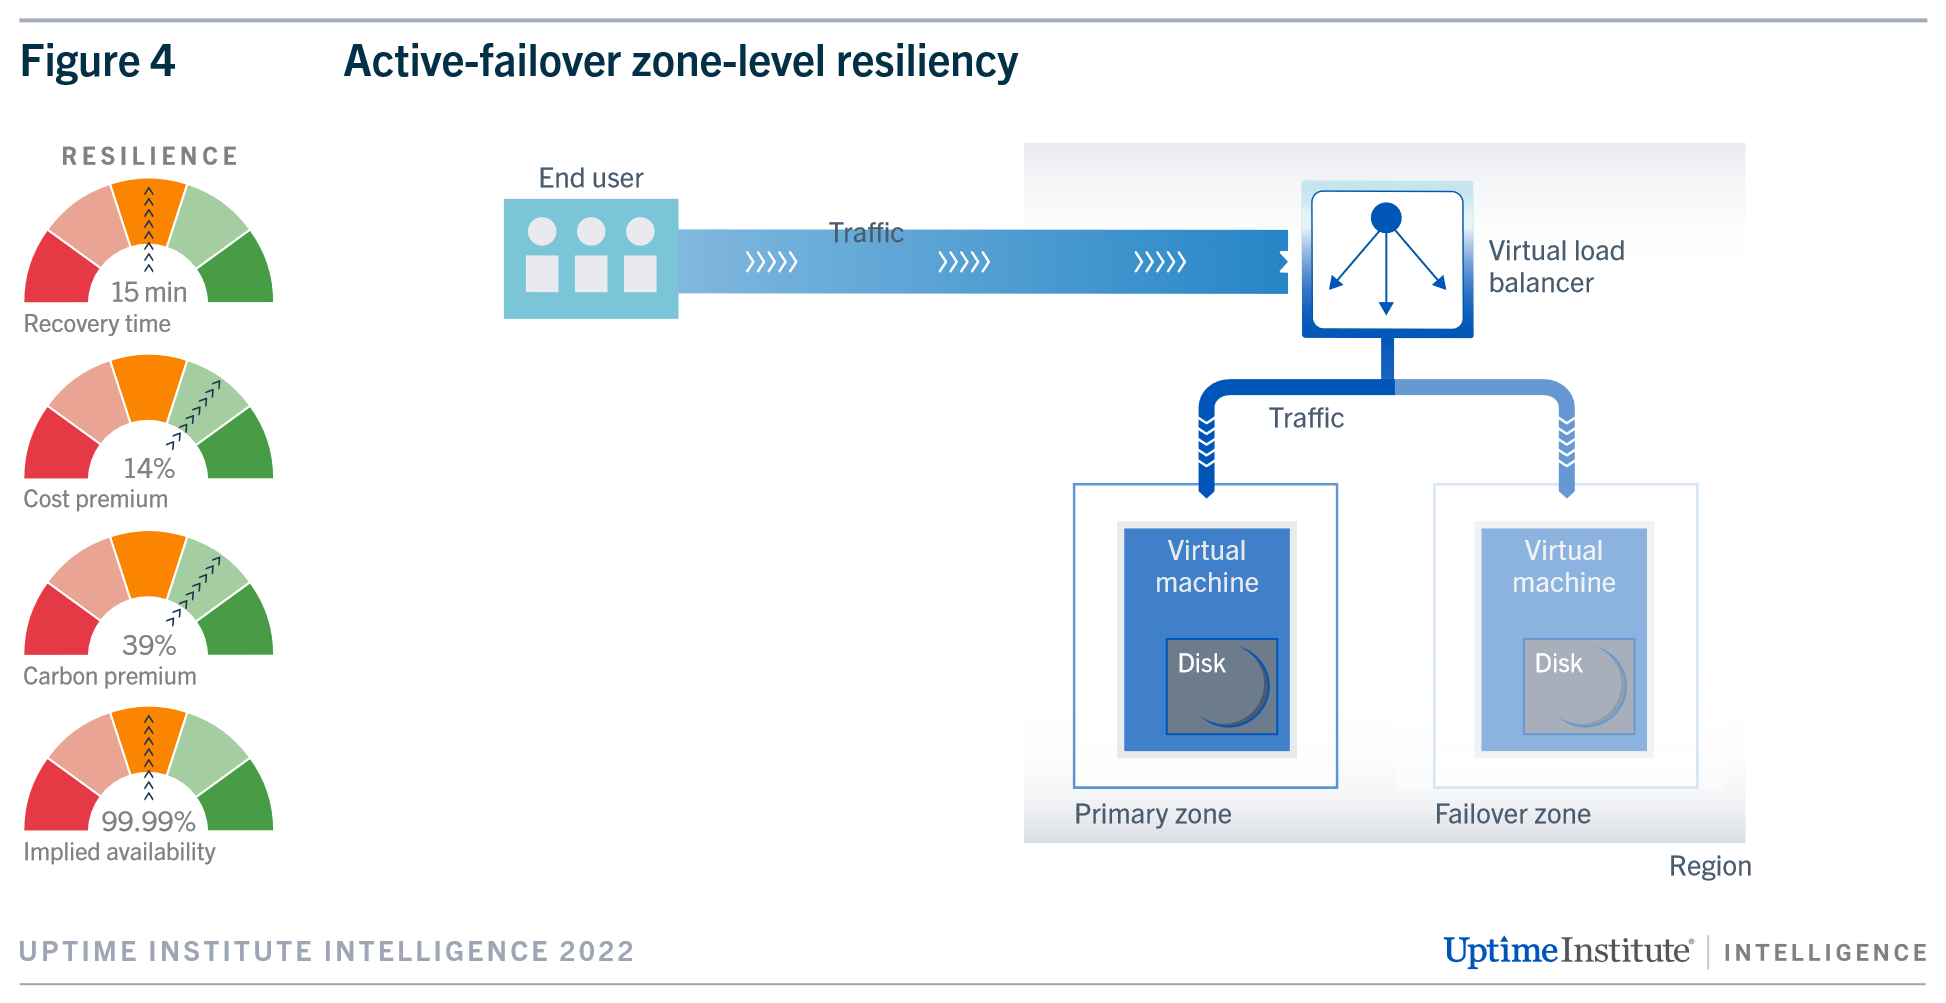
A fair compromise is an active-failover model, which reduces costs and carbon but sacrifices recovery time. An active-failover model across availability zones, for example, costs just 14% more than an unprotected application, but still produces 39% more carbon.
By deploying across VMs in separate availability zones, instead of within a single zone, users should expect availability to rise from 99.95% to 99.99%, with no increase in carbon emissions or cost.
Organizations need to factor sustainability into their applications, but in the context of specific business requirements. Cutting carbon is an important goal, but not perhaps to the detriment of mission-critical applications’ stability.
There are simple approaches organizations can take to reduce carbon without having to rearchitect an application, such as:
- Turning off idle VMs, including those architected for resiliency.
- Choosing better-sized VMs, with higher utilization levels.
- Selecting VMs with more power-efficient chips.
📑 Annotations (imported on 2023-03-31#13:03:31)
The baseline application used for carbon comparisons is “stateless.” This means the application does not store any new information from end-user requests and does not perform any task based on past transactions. A simple web service is stateless: users request a page, and the page is returned.