United States Data Center Energy Usage Report
Status:: 🟩
Links:: @Shehabi.etal.2024.2024UnitedStates
Zotero Tags:: #zotero/✅ #zotero/💎 #zotero/climate_footprint #zotero/data_center_efficiency
Metadata
Type:: #zotero/journalArticle
Authors:: Shehabi, Arman; Smith, Sarah; Sartor, Dale; Brown, Richard; Herrlin, Magnus; Koomey, Jonathan; Masanet, Eric; Horner, Nathaniel; Azevedo, Inês; Lintner, William
Title:: United States Data Center Energy Usage Report
Date:: 2016
URL:: https://escholarship.org/uc/item/84p772fc
Bibliography
Shehabi, A., Smith, S., Sartor, D., Brown, R., Herrlin, M., Koomey, J., Masanet, E., Horner, N., Azevedo, I., & Lintner, W. (2016). United States Data Center Energy Usage Report. https://escholarship.org/uc/item/84p772fc
Zotero
Notes & Annotations
| Space Type | 2000-2010 | 2020 |
|---|---|---|
| Internal | 10% | 15% |
| Service Provider | 20% | 25% |
| Hyperscale | 45% | 50% |
Hyperscale data centers are assumed to run at higher utilizations than other service provider and internal data centers based on server utilization estimates in cloud and non-cloud data centers.
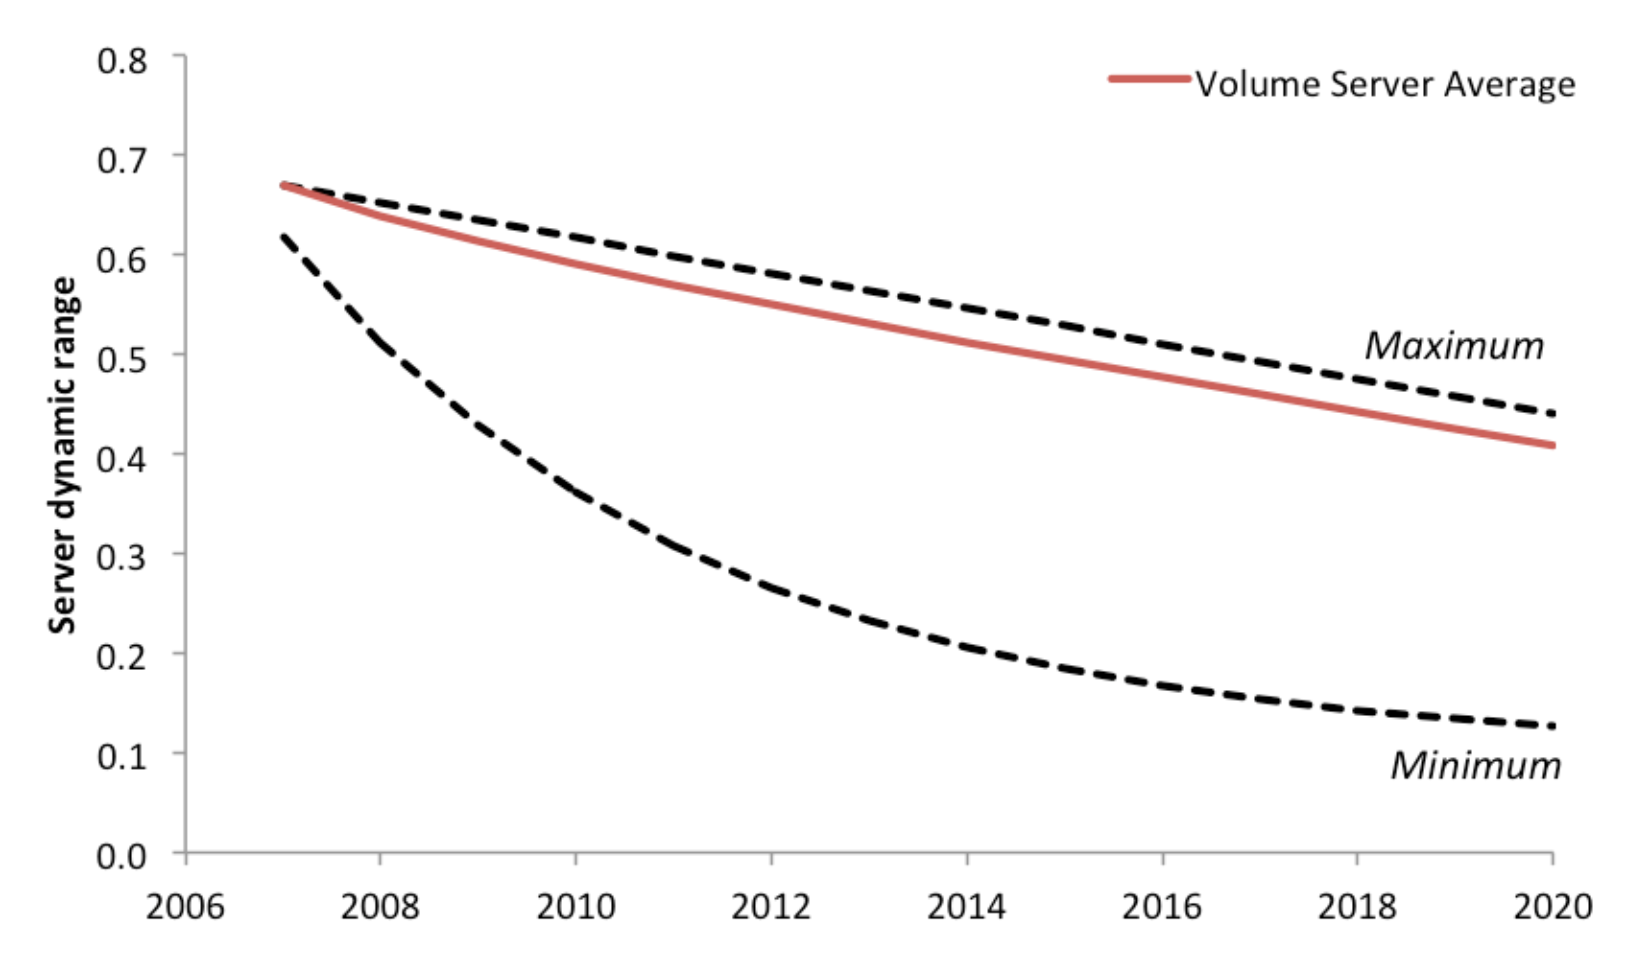
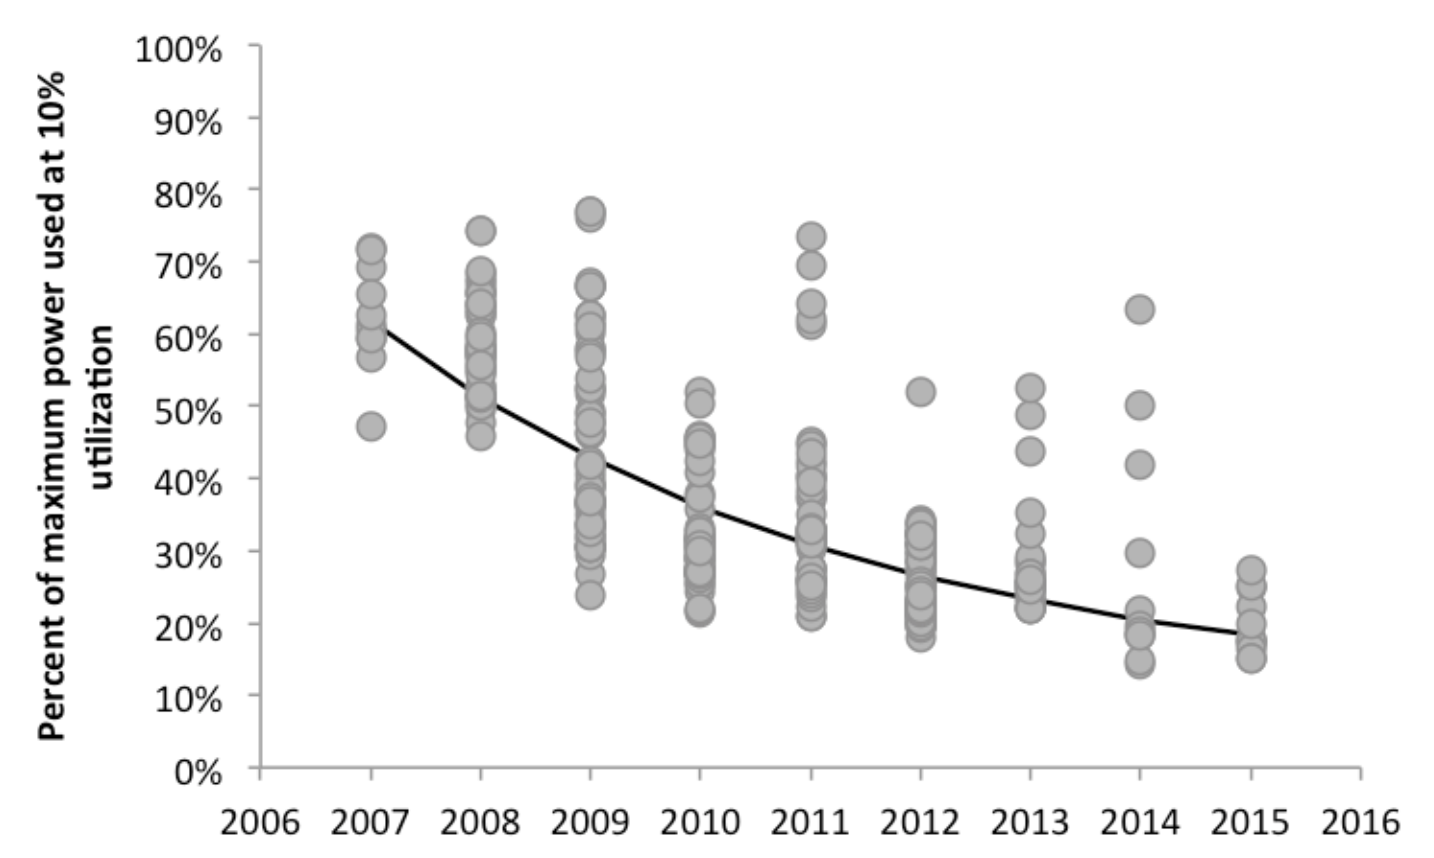
The amount of power consumed at average utilization is dependent on how closely servers come to achieving power-proportionality, where power consumption scales directly with utilization. In other words, perfect power-proportionality would mean that a server would only use 10% of maximum power when run at 10% utilization.
One metric used to quantify this behavior is the dynamic range (DR), which is the ratio between the lowest power level (idle power) and the maximum power.
Dynamic Range of 1- and 2-Socket Servers in SPEC Database
Infrastructure energy consumption (cooling equipment, uninterrupted power supplies, lighting, etc.) is calculated using the power usage effectiveness (PUE) metric.31 This metric represents the total energy required by the data center in relation to the energy needed for the IT equipment. A data center with PUE of 1 would use no electricity other than the IT equipment.
The slower rate of efficiency improvement in PUE relative to IT equipment is partially due to the slower turnover rate of a data center’s infrastructure relative to the IT equipment. The opportunities to improve data center PUE increase with larger data centers that have the ability to develop better airflow management and employ more efficient cooling equipment or advanced cooling technologies such as liquid cooling. Consequently, smaller data centers are still being measured with PUE values greater than 2.037 while large hyperscale cloud data centers are beginning to record PUE value of 1.1 or less.
A number of energy efficiency trends have been shaping server operations over the past decade, including virtualization and consolidation, which are expected to continue to generate energy savings and reduce server footprint.
Furthermore, the growing trend of cloud computing has resulted in significantly larger data centers that are more efficient, both in terms of server utilization and infrastructure PUE, compared to traditional enterprise data centers.
The impact on the installed base in hyperscale data centers is smaller since, on average, one server in a hyperscale data center can replace 3.75 servers in non-hyperscale data centers. This is because servers in hyperscal
37 data centers are assumed to run at roughly 3 times the utilization of non-hyperscale data centers and have no redundancy requirements.
Due to the limited data on utilization rates for servers in U.S. data centers, this study generalizes server utilization using a single average (per space type), with no information about the actual distribution of utilization over the average year. This generalization prevents distinguishing between a server that is run at 40% utilization constantly and one that is run at 80% utilization half of the time and idled the other half of the time.
The limitations of PUE, the most commonly discussed metric of efficiency, are generally understood, but a key issue it that PUE only measures the efficiency of the building infrastructure supporting a given data center and indicates nothing about the efficiency of the IT equipment itself.
Initial efforts to accomplish this include The Green Grid’s Data Center Productivity (DCP) and Data Center energy Productivity (DCeP), the Uptime Institute and McKinsey’s Corporate Average Data center Efficiency (CADE), and JouleX’s Performance per Watt (PPW), but PUE is still the dominant metric broadly observed in the data center industry.
📑 Annotations (imported on 2023-03-31#13:03:31)