BoaviztAPI: a bottom-up model to assess the environmental impacts of cloud services
Status:: 🟩
Links:: Carbon Footprint of ICT Devices LCA of Electronic Devices Estimate carbon emissions of cloud applications
Metadata
Authors:: Simon, Thibault; Ekchajzer, David; Berthelot, Adrien; Fourboul, Eric; Rince, Samuel; Rouvoy, Romain
Title:: BoaviztAPI: a bottom-up model to assess the environmental impacts of cloud services
Date:: 2024
URL:: https://hotcarbon.org/assets/2024/pdf/hotcarbon24-final74.pdf
DOI::
Simon, T. et al. (2024) ‘BoaviztAPI: a bottom-up model to assess the environmental impacts of cloud services’, in. HotCarbon 2024. Available at: https://hotcarbon.org/assets/2024/pdf/hotcarbon24-final74.pdf (Accessed: 10 July 2024).
Awareness surrounding the environmental impacts of the digital industry has led numerous professionals to incorporate these considerations into their work. However, the conceptualization of environmental impacts has often been narrowed to the scope of carbon footprint. This limitation can be attributed to various technical and data accessibility constraints, hindering a comprehensive evaluation, including a multi-criteria analysis over the entire life cycle of digital technologies.
Notes & Annotations
Color-coded highlighting system used for annotations
📑 Annotations (imported on 2024-07-18#14:46:37)
In this context, major cloud providers, such as AWS [9], Azure [10], and GCP [11], have introduced tools enabling customers to assess the carbon footprint associated with their cloud usage. However, the underlying methodologies adopted by these actors have not been subjected to rigorous transparency procedures, which presents a significant threat to ensuring the consistency of results between tools. This lack of transparency results in inconsistencies that hinder the comparability of results, stemming from variations in the scope considered and allocation methods employed.
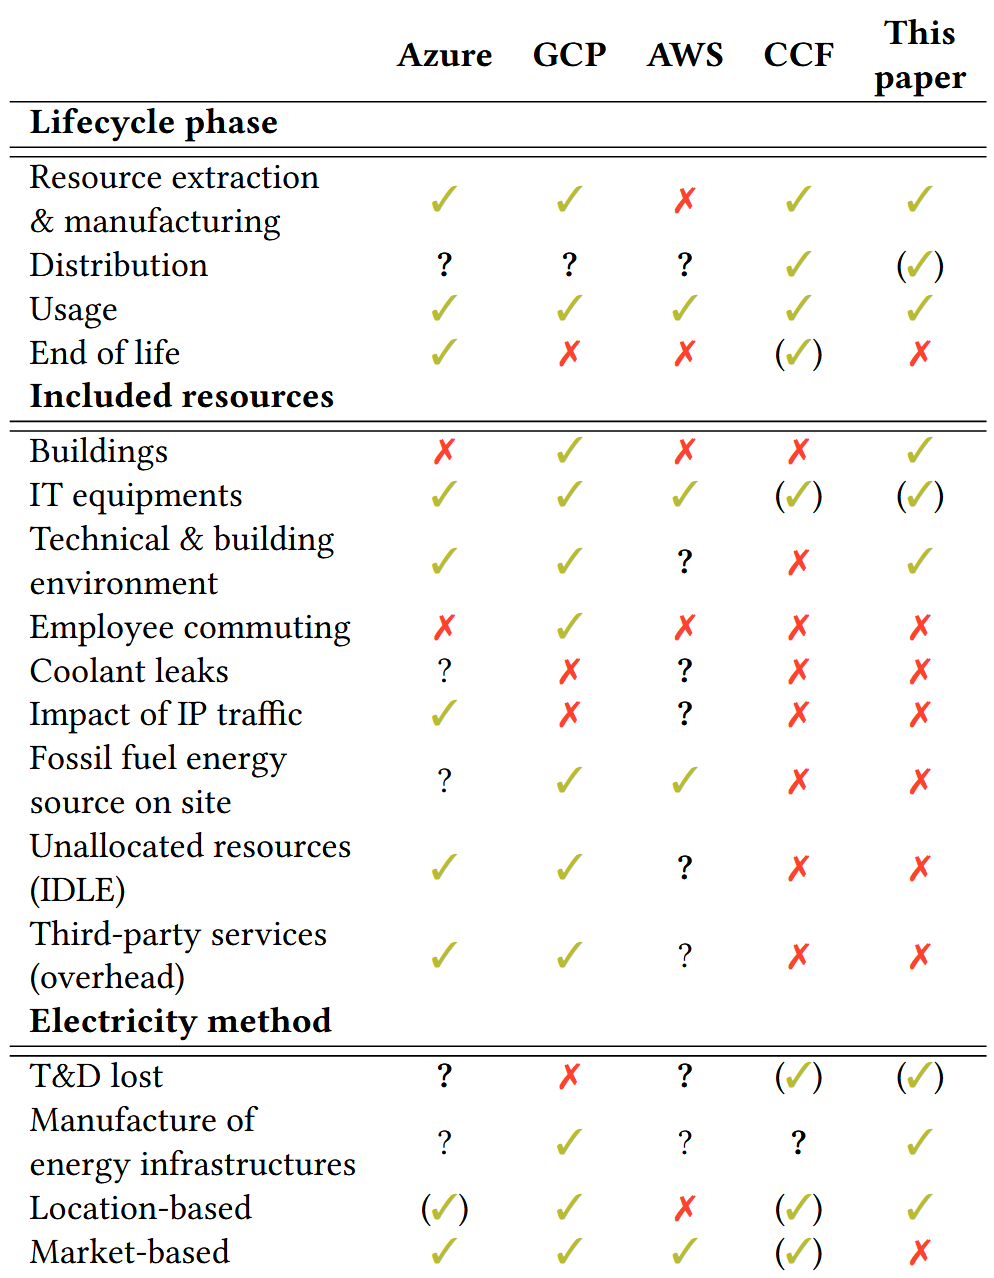
Table 1: GHG emissions accounting perimeter of cloud services
To address these limitations, the open source project Cloud Carbon Footprint (CCF) [12] introduced a provider-agnostic approach. However, its calculation remains constrained by several factors. For the resource extraction & manufacturing phase, impacts are systematically estimated based on the Dell R740 Life Cycle Assessment [13], regardless of the hardware components used. Power is modeled based on benchmarks that measure power at the machine level [14] , which CCF associates with cloud instances based on CPU architecture. Not only does the CPU architecture not seem to be a good proxy for estimating the power consumption of a CPU, but even less so for the whole machine. For example, a storage server’s primary source of power consumption is typically the hard drives. A more specific model for each component seems to be required.
As illustrated in Figure 1, the environmental impacts of a cloud platform are mostly modeled using a bottom-up approach, whereby the impacts of each resource required to fulfill the service it provides are aggregated. Unlike a top-down approach, this allows the proportion of the contribution of each resource to the global impacts to be identified. The impacts of the technical and building environment are allocated on the cloud platform using a top-down approach.
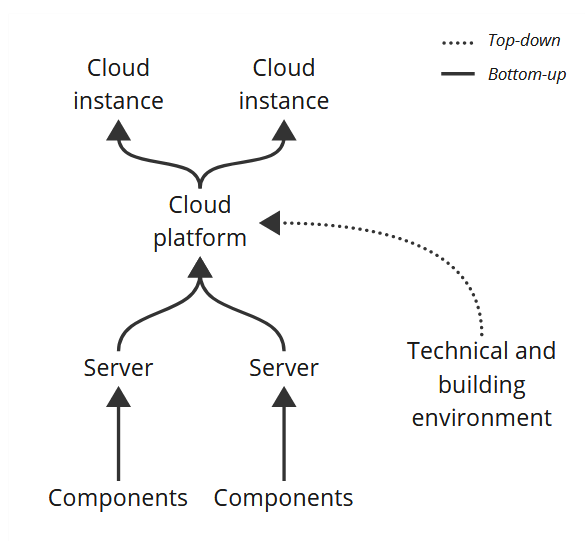
Figure 1: Modeling approach used to estimate the environmental impacts of a cloud platform and instances
For a given model, the TechPowerUp SSD specs database [35] can be used to estimate the idle and active (averaged) power consumption values. For RAM banks, we use the averaged values from [33]: 0.19 W /GB and 0.54 W /GB in idle and active states, respectively. By default, RAM banks are constantly considered in an active state.
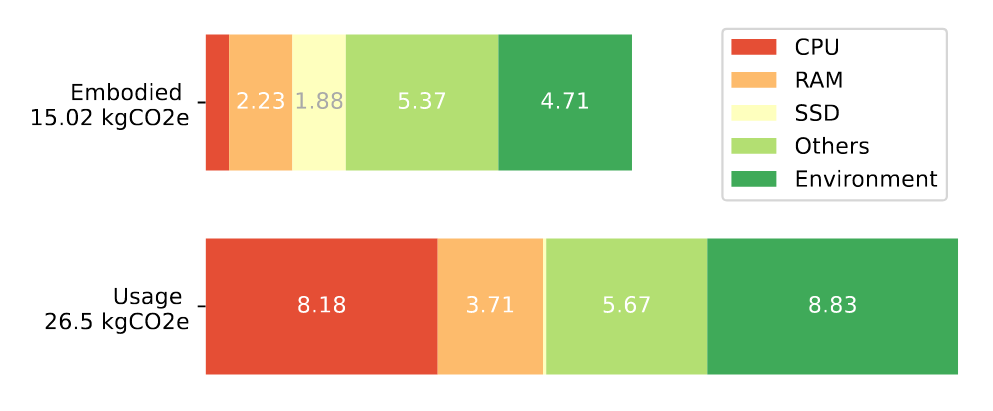
Figure 3: GWP impact of a cloud instance hosted in France with 4 vCPUs, 8 GB of vRAM and 80 GB of SSD storage used for a year, calculated using Equation 10
A cloud instance is modeled as a part of a cloud platform. Its impacts encompass both a share of the technical and building environment impacts, Ienv, and a share of each of the servers’ components impact factor Fr . This share is computed for each component using the quantity assigned to the instance Qu res over the total available resources on the platform Qu res . Such quantity Q materializes as vCPUs for CPUs and GBs for RAM and disks. For the others resources, which are not explicitly assigned to a cloud instance—i.e. motherboard, PSU, assembly, and casing (cf. Equation 3)—we have chosen an allocation based on vCPU, although this may depend on the type of cloud instance.
The impact of a year of usage for a cloud instance with 4 vCPUs, 8 GB of RAM, and 80 GB of SSD storage are estimated using Equation 10 in Figure 3. One can observe that contrary to the server in Figure 2, the impact of SSDs is smaller due to a small share of disks reserved. The technical and building environment substantially increase the total impacts, both embodied and usage.
As exposed in Fig. 1, our approach does not cover the entire perimeter of a cloud infrastructure. This includes third-party services hosted in the cloud platform that serve multiple customers. These can be technical services, such as the control plane, or customer services, such as billing. In addition, the usage impacts of nonserver IT equipment, such as network equipment, are not taken into account. This also minimizes the impacts of the technical and building environment, as we do not consider their consumption when applying the PUE. Finally, we do not consider servers in idle states.
the choice of a vCPU-based allocation for the others component and the technical and building environment remains arbitrary. This choice will be challenged in future work to better represent the link between these resources and the scaling of cloud instance.