Carbon impact of video streaming
Status:: 🟨
Links:: Climate emissions of videostreaming | Energy consumption of network communication
Metadata
Authors:: Stephens, Andie; Tremlett-Williams, Chloe; Fitzpatrick, Liam; Acerini, Luca; Anderson, Matt; Crabbendam, Noor
Title:: Carbon impact of video streaming
Date:: 2021
URL:: https://www.carbontrust.com/our-work-and-impact/guides-reports-and-tools/carbon-impact-of-video-streaming
DOI::
Bibliography
Stephens, A., Tremlett-Williams, C., Fitzpatrick, L., Acerini, L., Anderson, M., & Crabbendam, N. (2021). Carbon impact of video streaming (p. 102). Carbon Trust. https://www.carbontrust.com/our-work-and-impact/guides-reports-and-tools/carbon-impact-of-video-streaming
Zotero
Type:: #zotero/report
Keywords:: [🔥, ⏳, 💎, Videostreaming]
Relations
Related:: @DIMPACT.2023.LiteratureReviewPolicy
Notes & Annotations
📑 Annotations (imported on 2023-06-23#15:58:01)
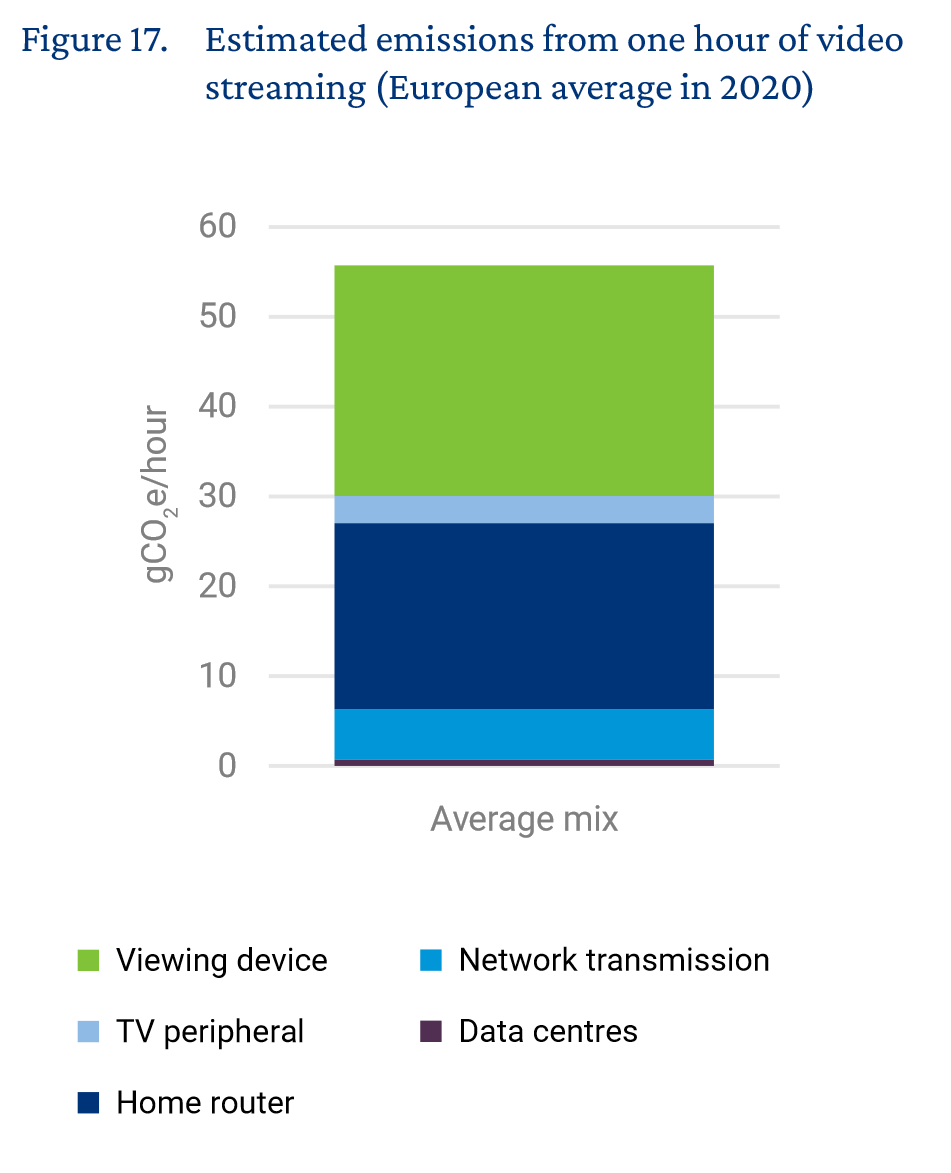
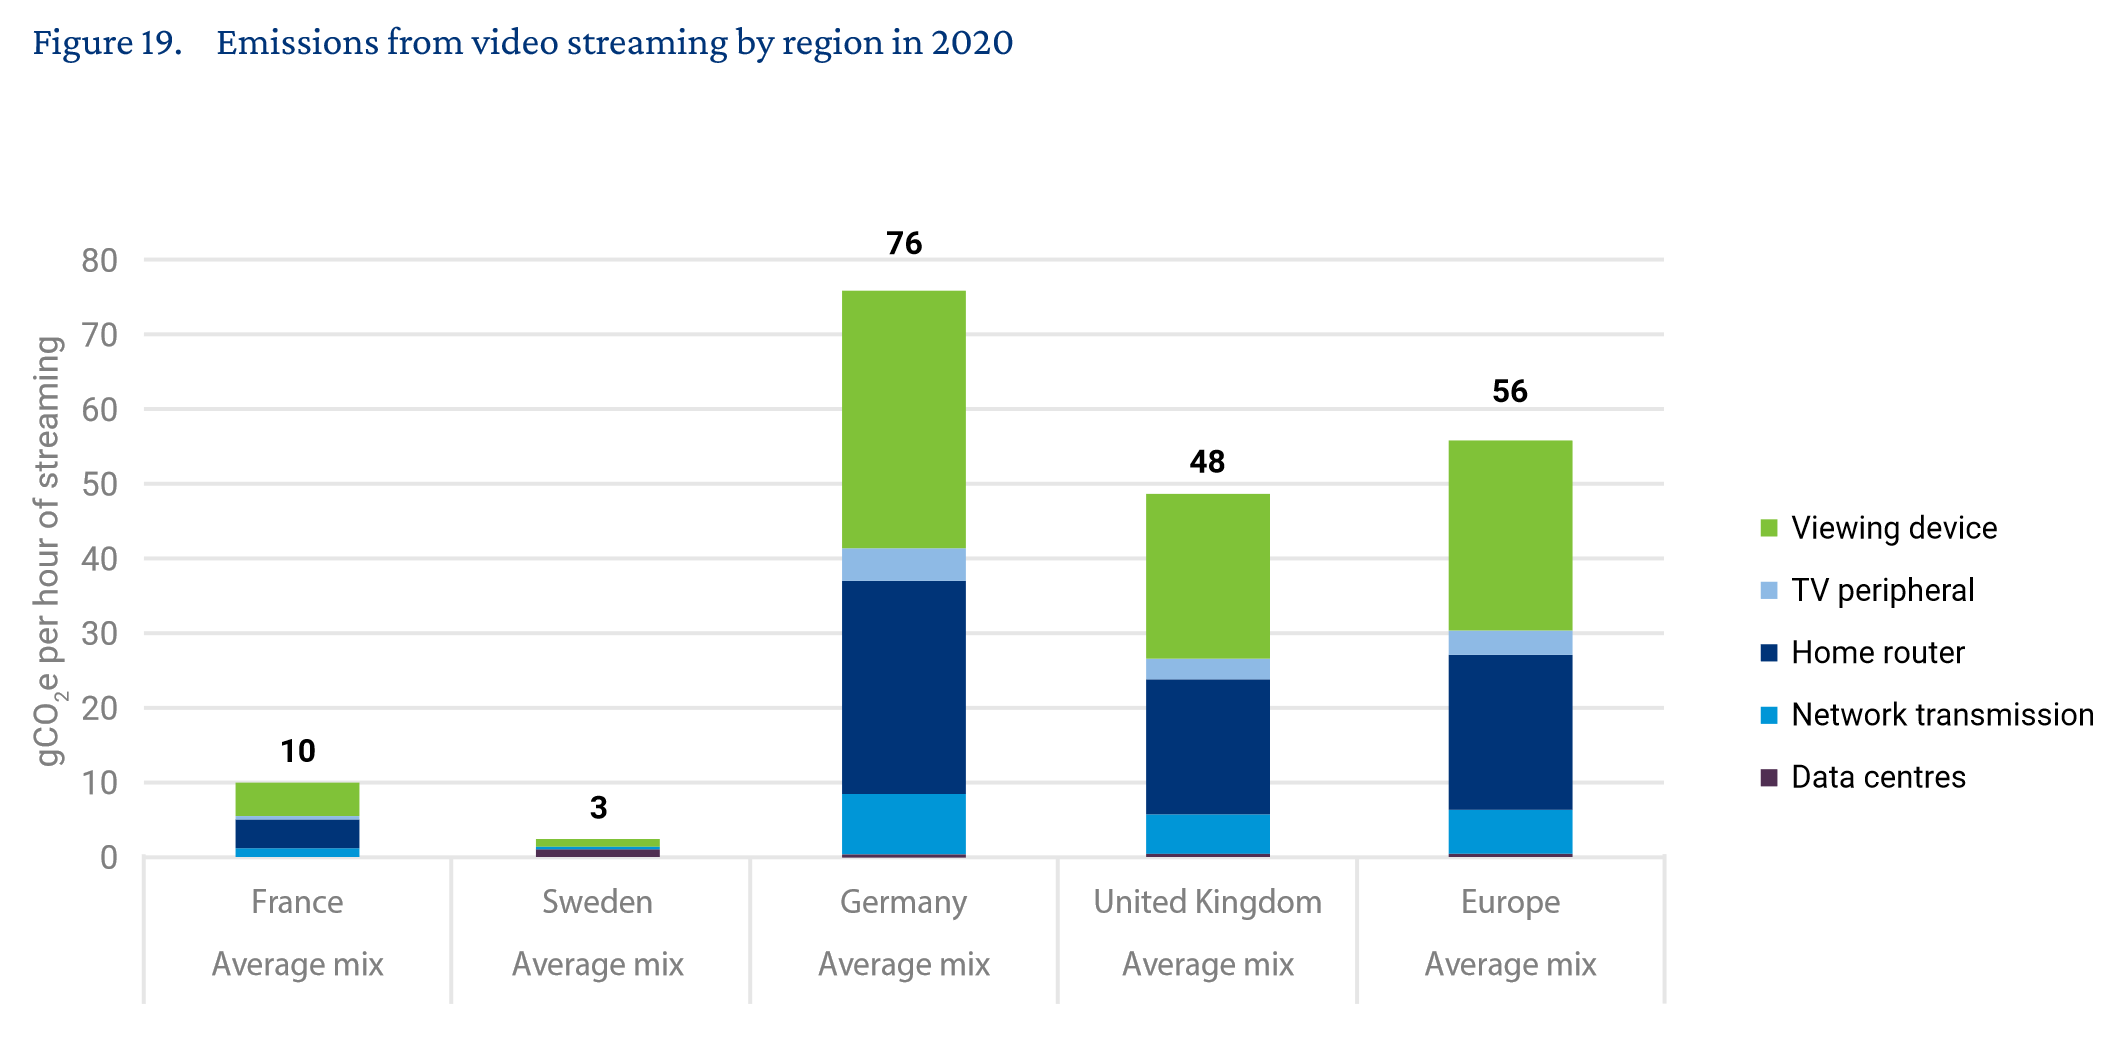
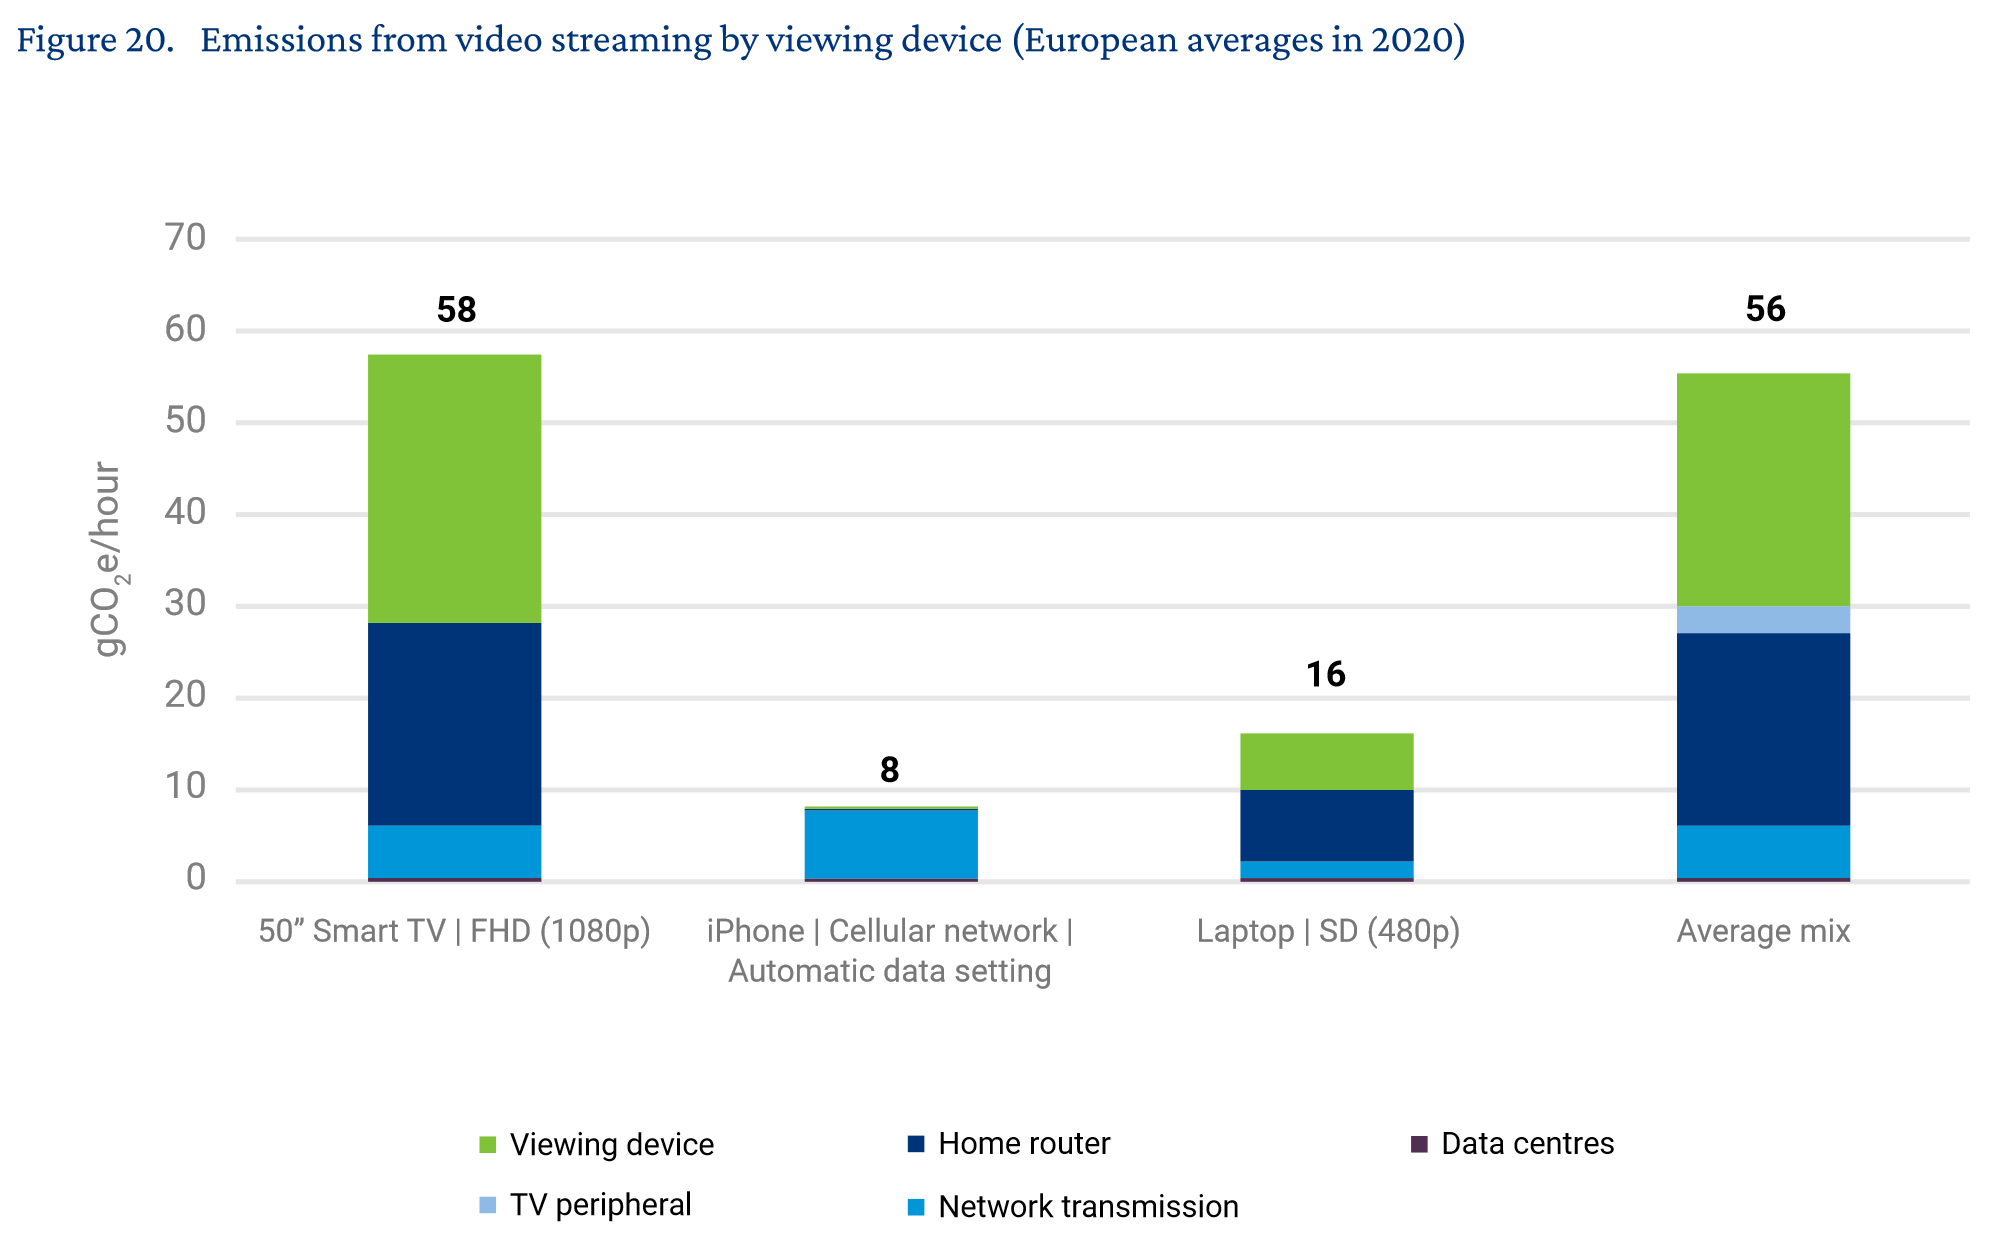
The European average footprint estimated in this white paper is approximately 55gCO2e per hour of video streaming for the conventional allocation approach.
This estimate uses a European average grid emission factor, a representative mix of viewing devices, and network energy intensity figures for 2020.
For comparison, the emissions from microwaving a bag of popcorn for four minutes is about 16gCO2e (also using a European average grid emission factor), while driving 100 metres in an average petrol car emits around 22gCO2e.
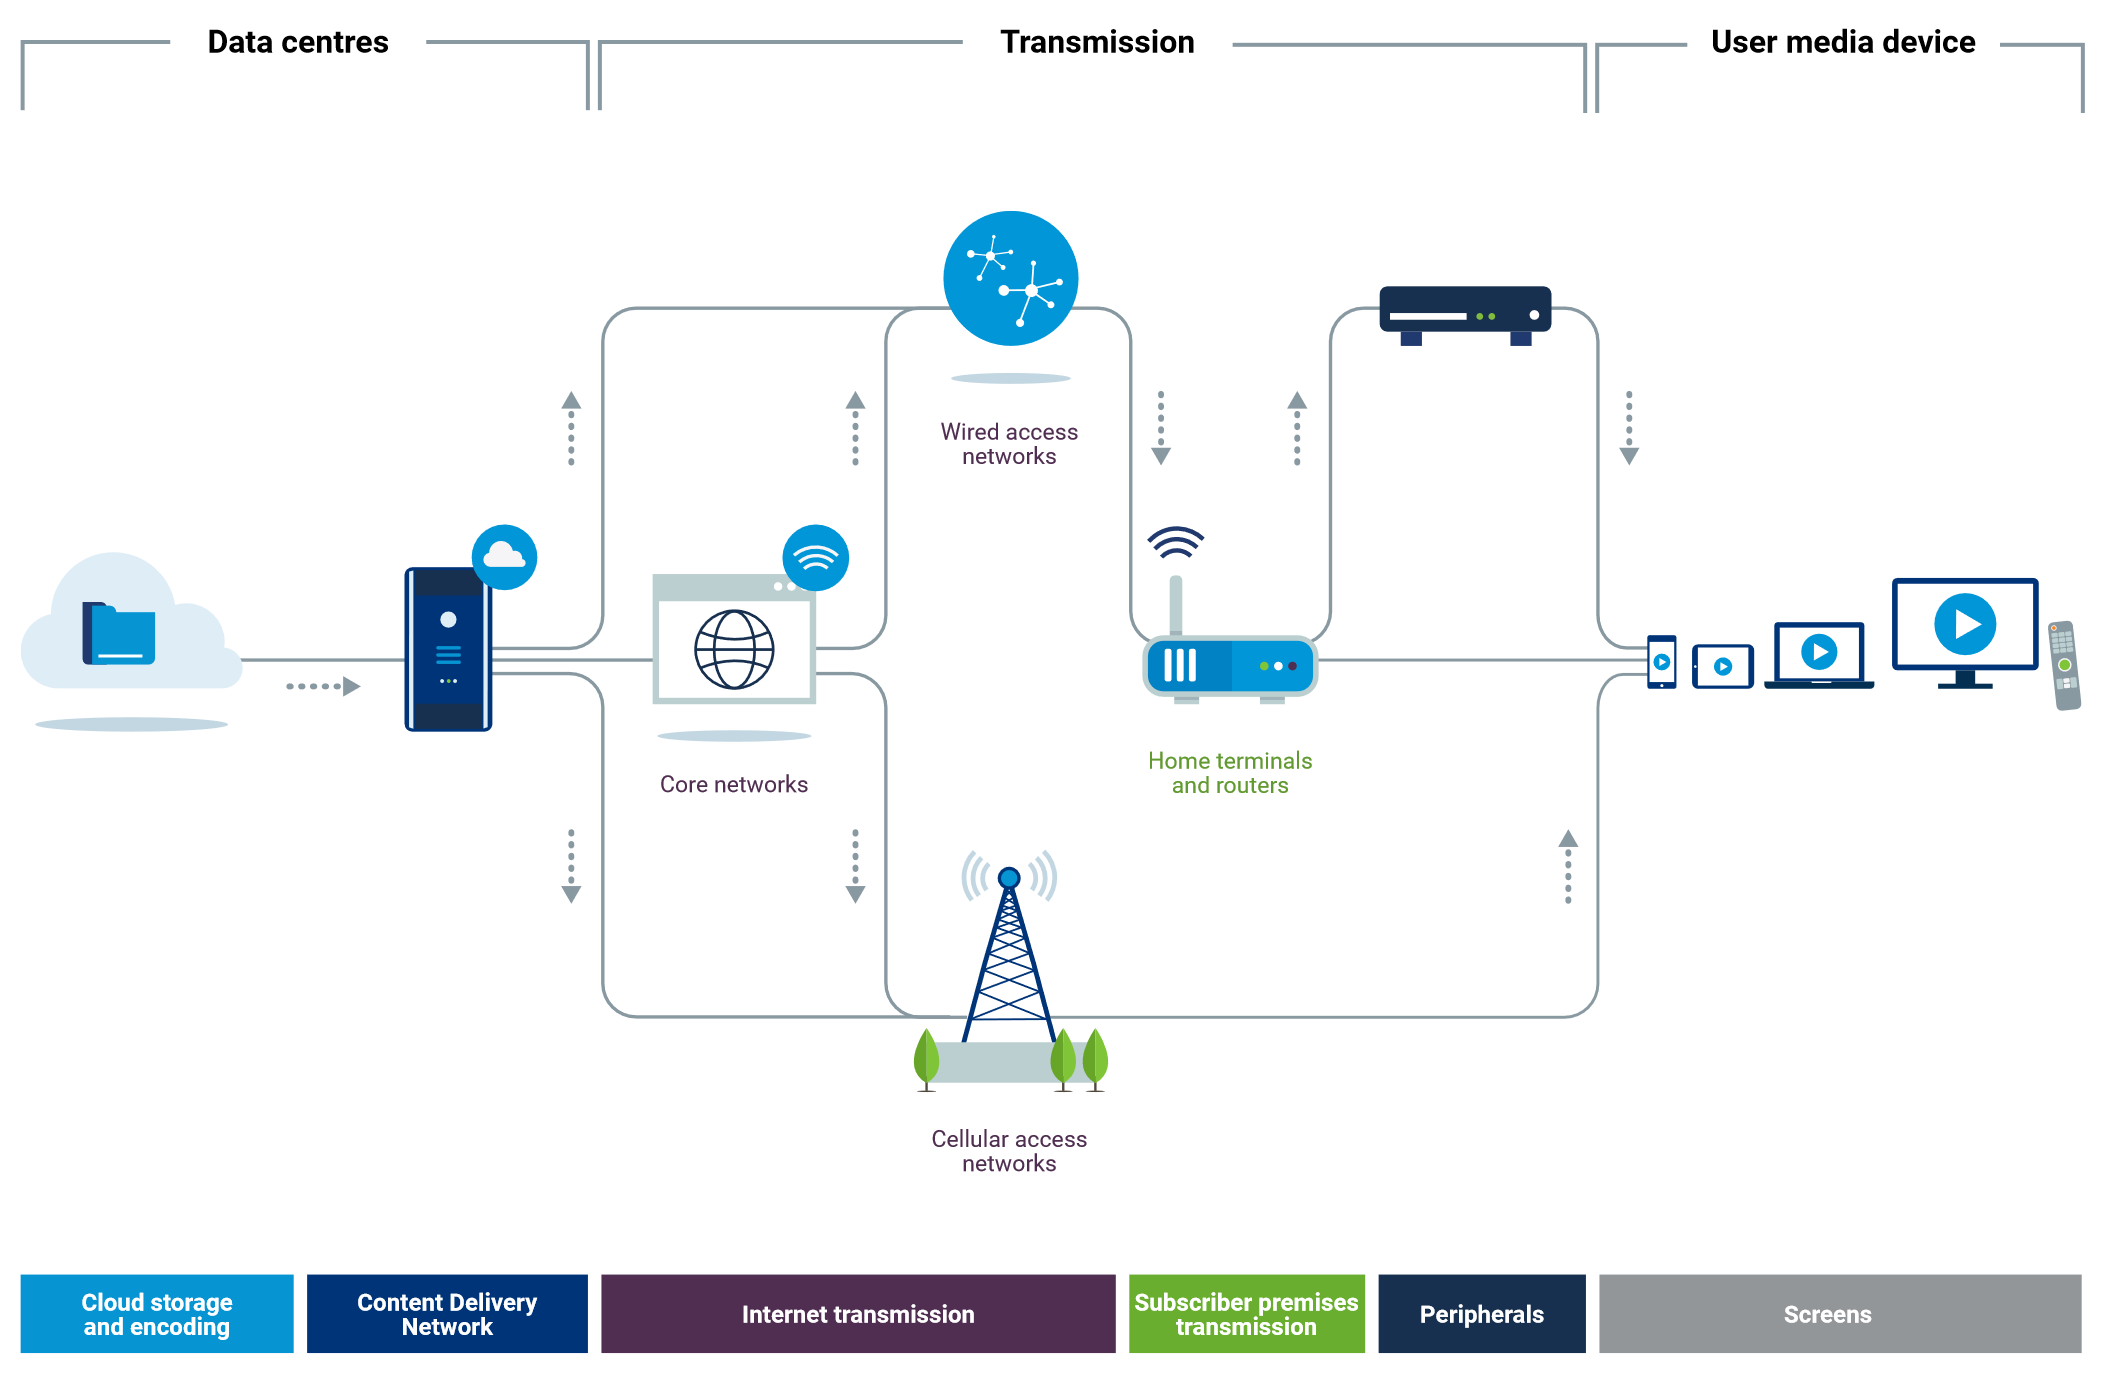
There are a number of factors that can have a significant impact on the results and explain some of the variability in the results. One is the fact that ICT technology is continually being updated and improving in energy efficiency, thus the year to which the results relate is significant, and using outdated energy intensity (and hence carbon intensity) figures will over-estimate the result. The second factor is related to the method of allocating the energy (and hence emissions) of shared resources (such as the internet transmission). A third significant factor is that the carbon intensity of electricity (i.e. the electricity grid emission factors) vary significantly from country to country, and also have been reducing over time due to decarbonisation of the electricity supply.
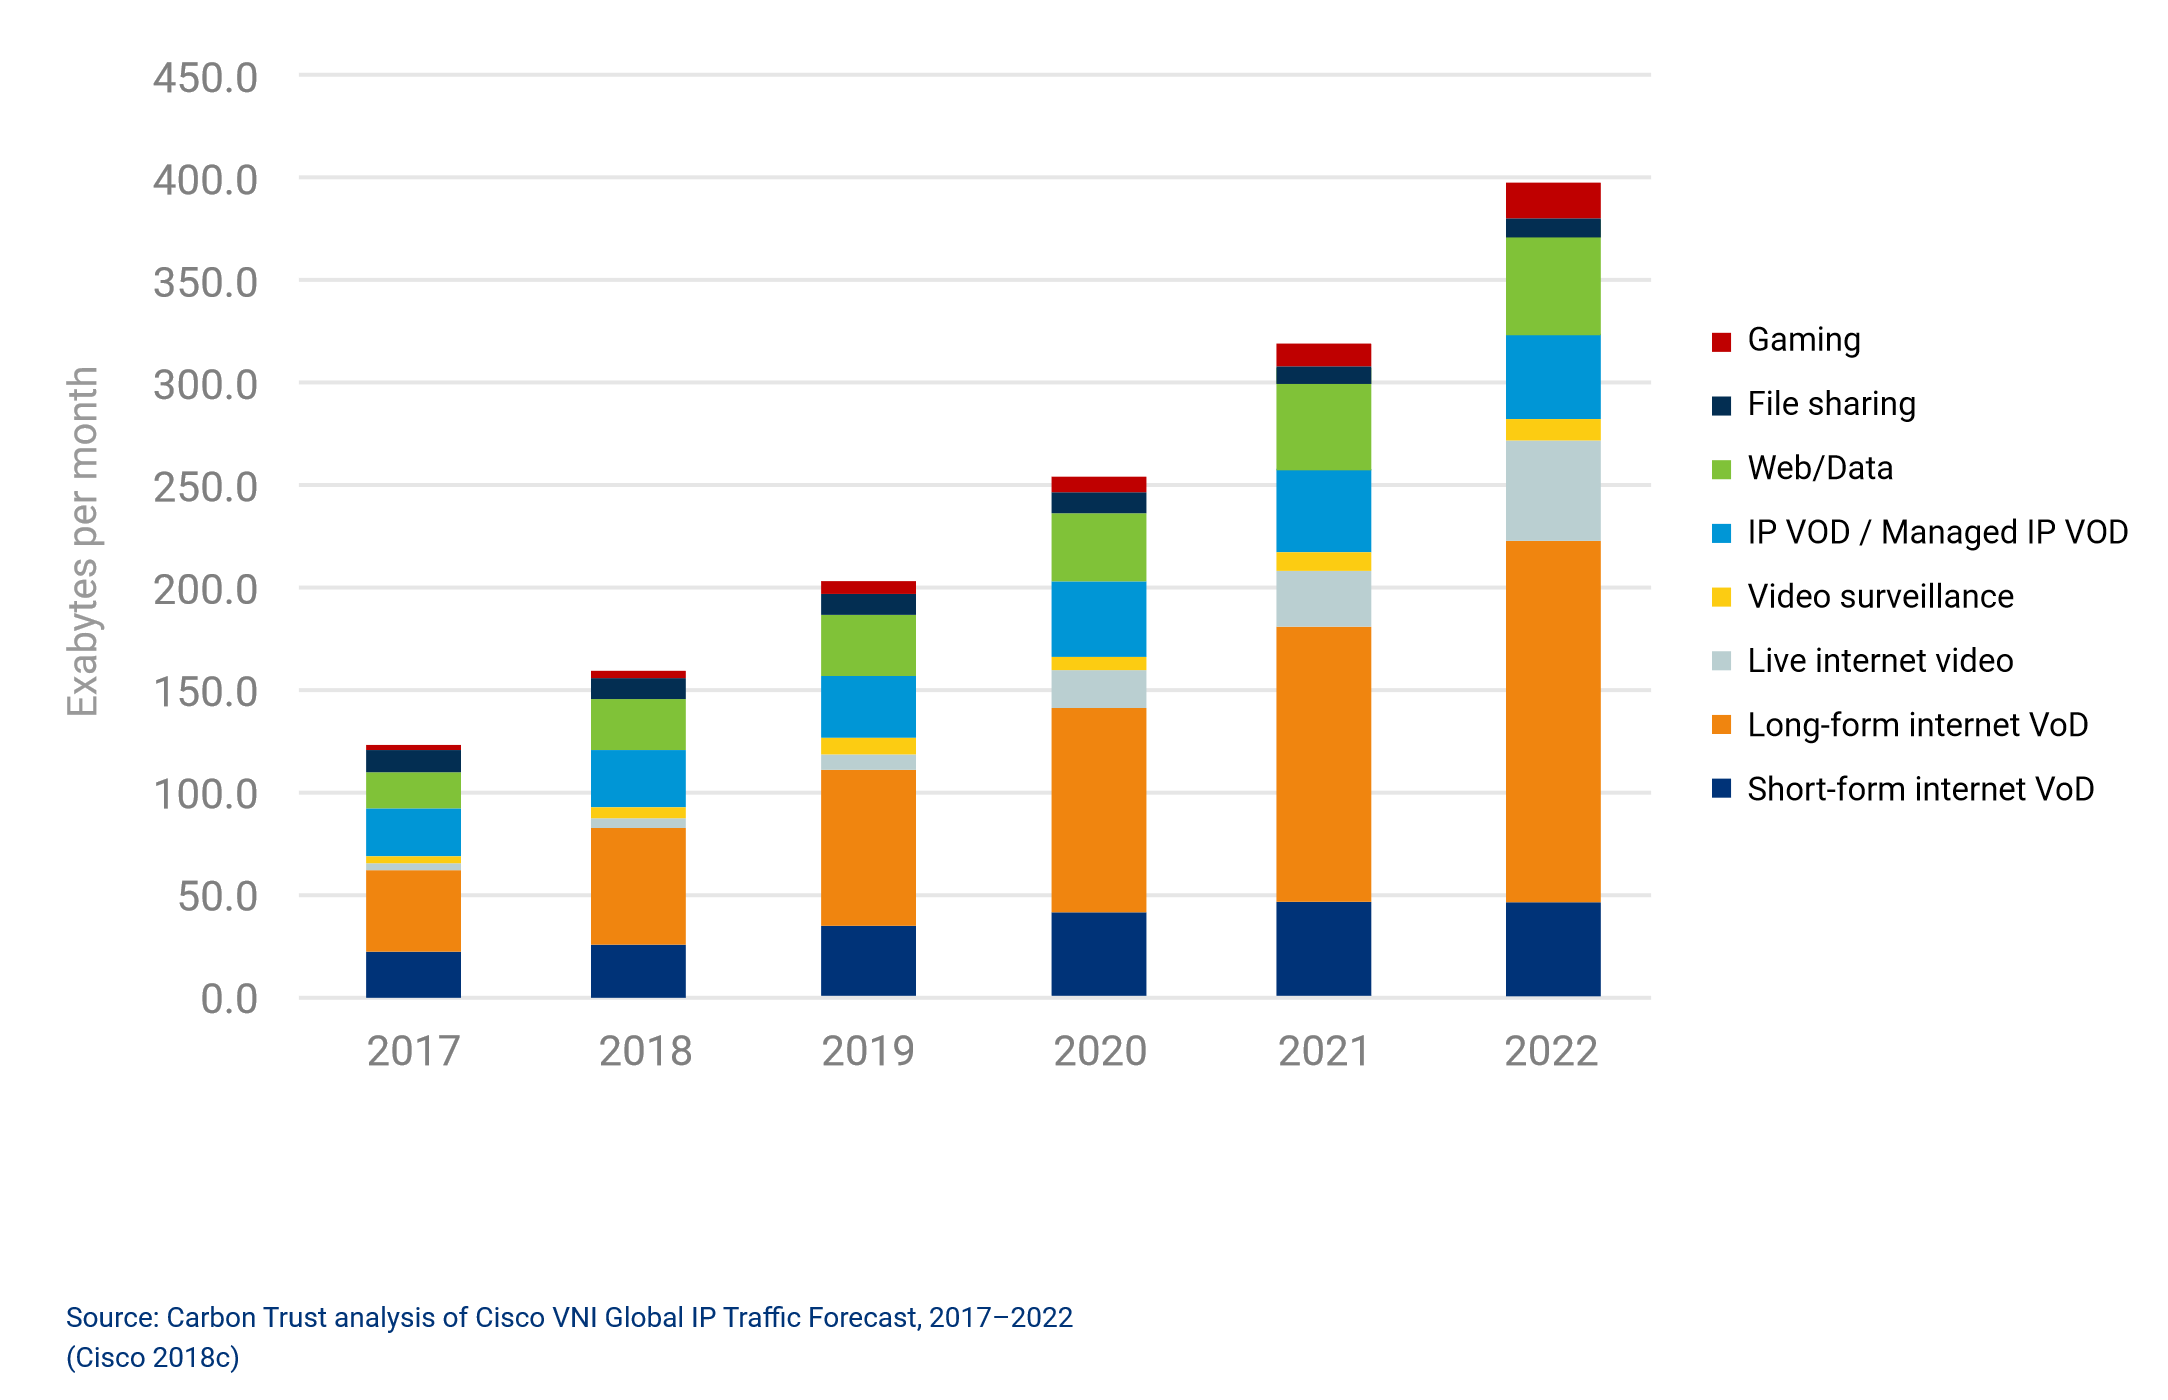
It is widely acknowledged that energy efficiency of ICT and computing equipment has historically doubled every one to three years (Kamiya, 2020; Koomey et al., 2011a, Koomey and Naffziger, 2016), and similarly energy efficiency of networks has historically doubled approximately every two years (Aslan et al., 2018)
Aslan’s rule
Analysis of estimates for the average electricity intensity of fixed-line internet transmission networks for data transfers from 2000 to 2015 concluded that electricity intensity (in kWh/GB) decreased by half approximately every two years over that time period (Aslan et al., 2018).
📑 Annotations (imported on 2023-06-23#16:04:52)
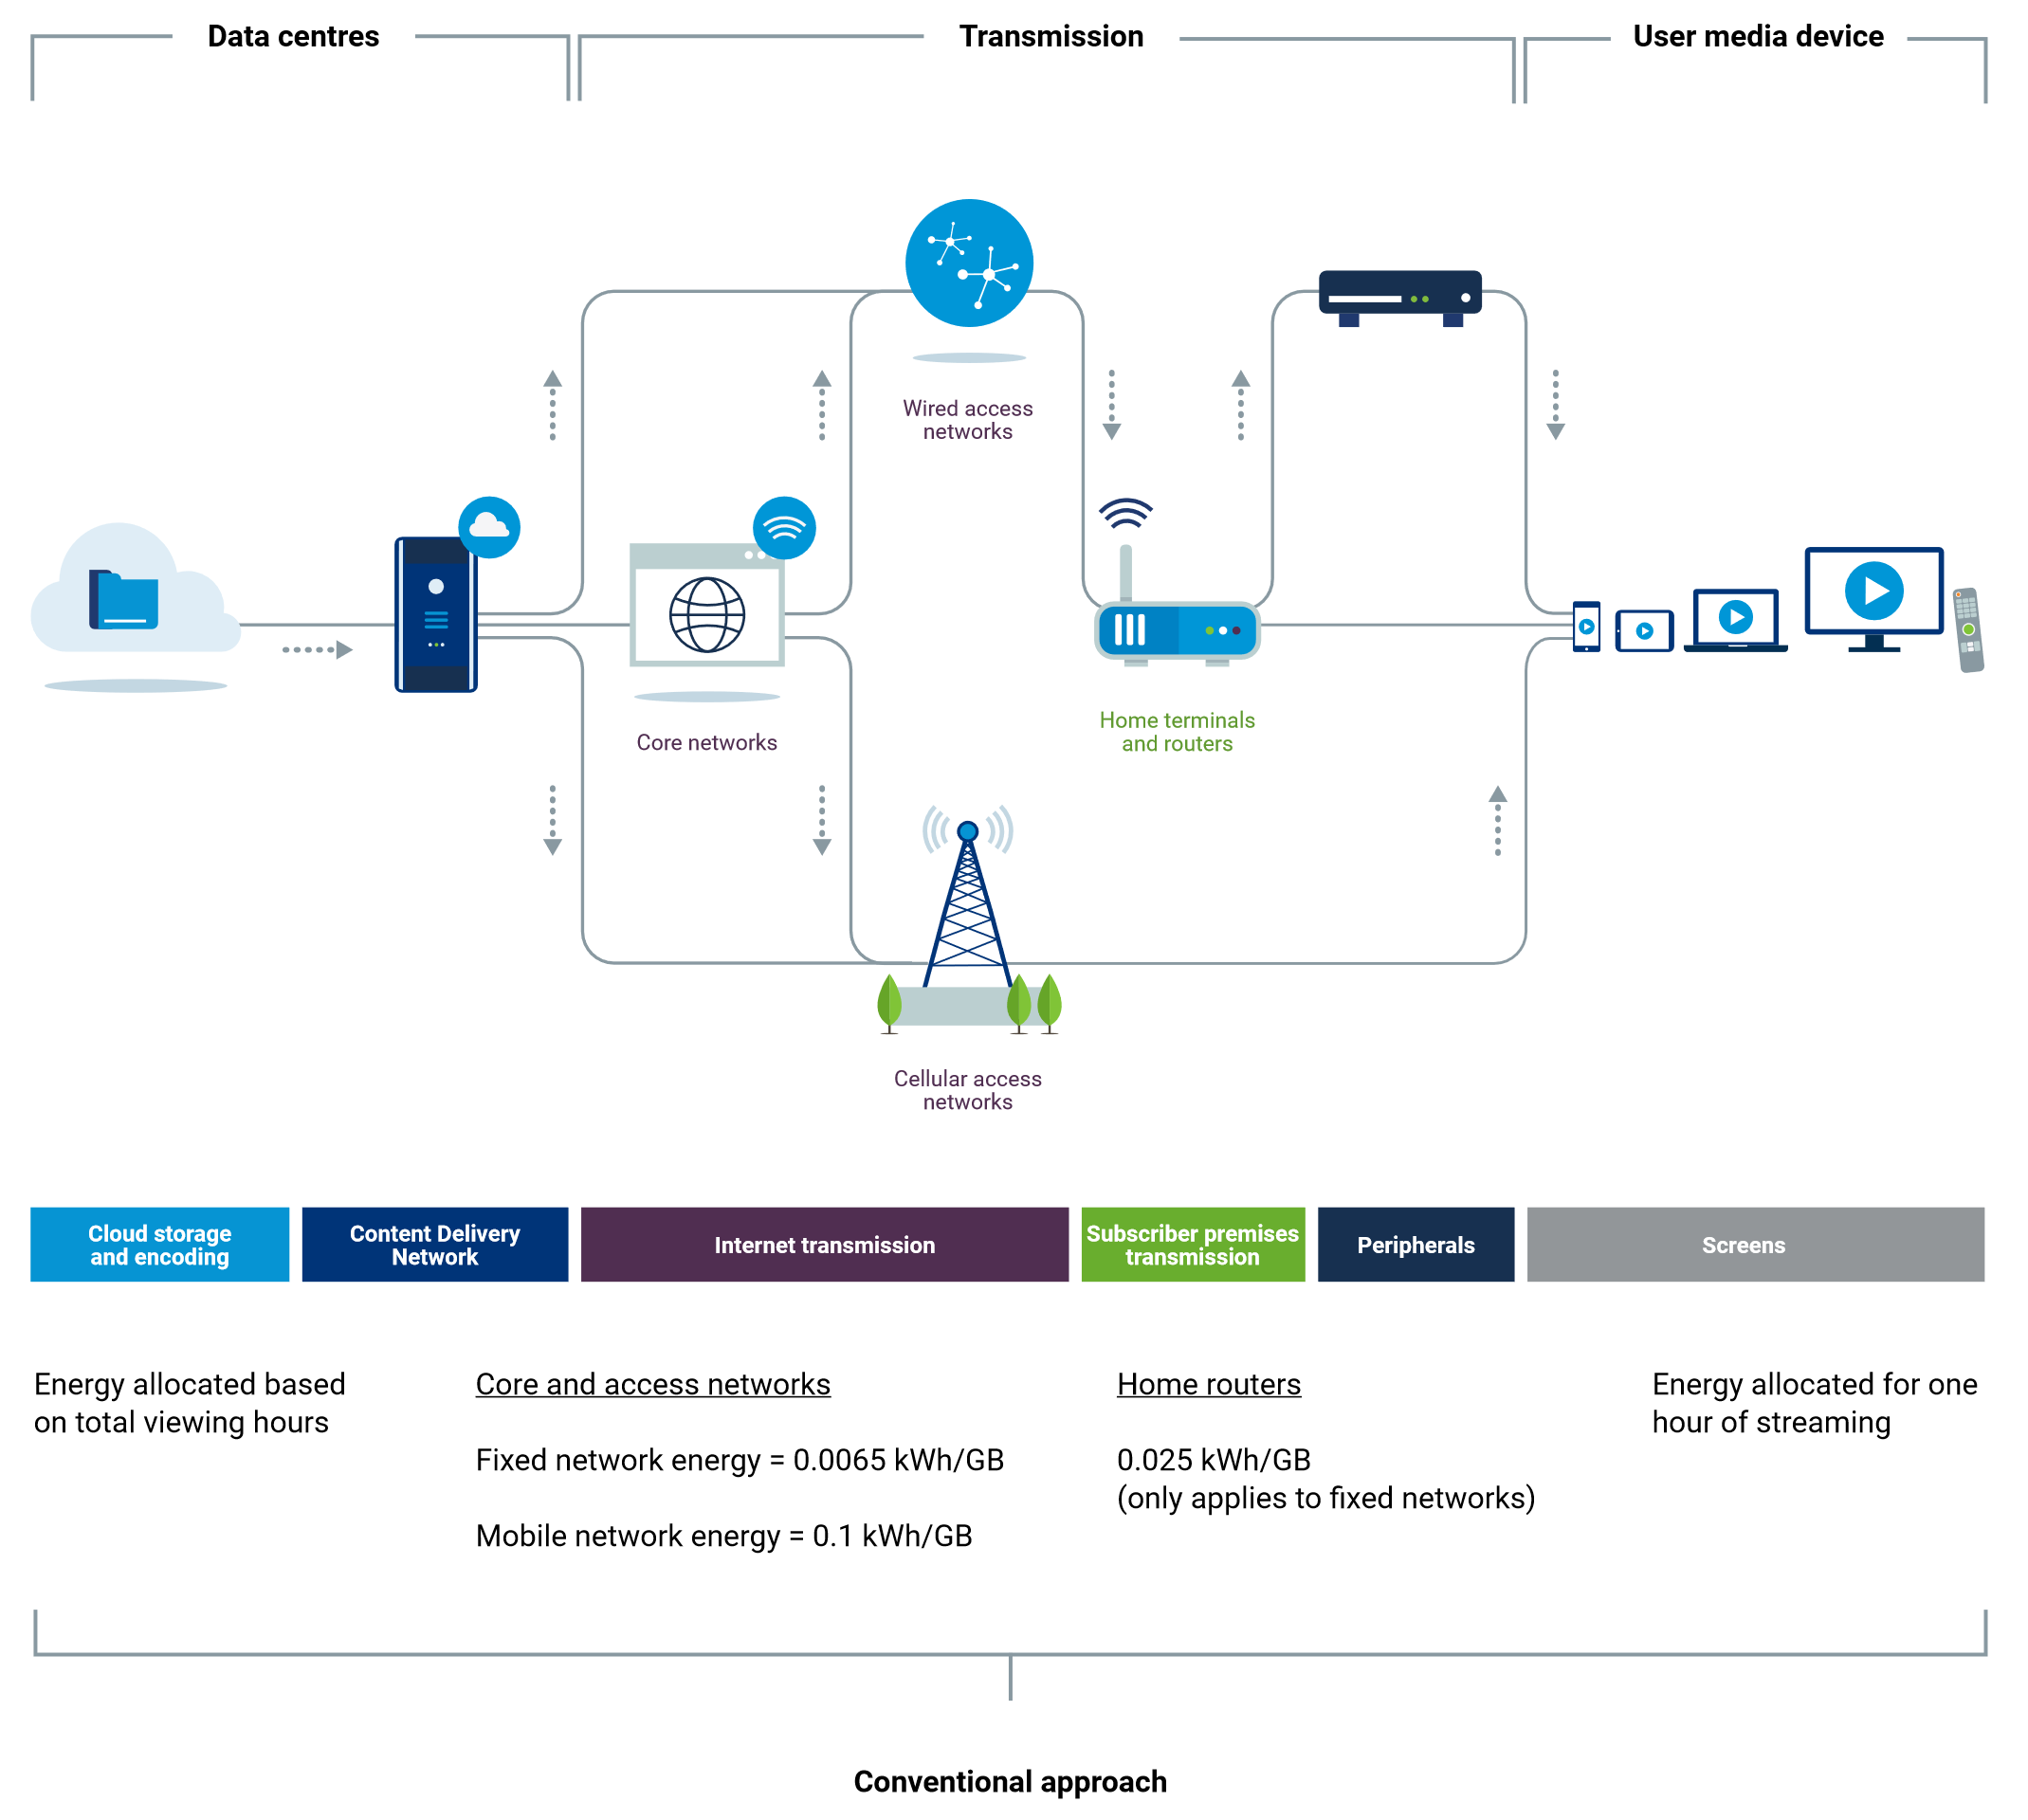
Fixed network energy intensity (2020) = 0.0065 kWh/GB
Mobile network energy intensity (2020) = 0.1 kWh/GB
Home router energy intensity (2019) = 0.025 kWh/GB
📑 Annotations (imported on 2023-11-29#09:26:16)
Using the power model approach, which reflects the instantaneous (or marginal) changes in energy, demonstrates that changes in bitrate (due to different resolutions and other settings) result in only a very small change in the carbon footprint. This is because the internet transmission and the home router use much the same energy whatever the data volumes are, and the viewing devices energy consumption also only changes by small amounts depending on the viewing resolution.
The marginal impact over fixed network as resolution and bitrate increase, is relatively small, where the transmission emissions grow from just under 1gCO2e/hour to just over 1gCO2e/hour between SD and 4K. This represents an increase of 26% in aggregated core and access transmission emissions from SD up to 4K.
For users, the most effective way to reduce their carbon impact of streaming depends on the network being used. Over a fixed network, using a more energy efficient or smaller viewing device has a far greater impact than changing video quality, particularly as enduser devices dominate the total emissions from streaming over fixed network. In fact, this analysis demonstrates that changing video quality while streaming over a fixed network has a negligible short-term impact. For a typical user streaming over a mobile network with a smartphone, emissions are small even at higher bitrates, estimated at less than 5gCO2e/hour in this scenario using the power model approach.
As video streaming consumption increases in the future there may well be a rebound effect of increased energy use and carbon impact, potentially to the point where efficiency gains in network transmission and end-user devices are outweighed by the increased consumption of streamed video content. This highlights the importance of the continued uptake of renewable electricity to power transmission networks, so that increased network energy consumption does not translate directly to increased emissions.
📑 Annotations (imported on 2023-11-29#09:40:38)
In a similar manner, network capacity expansion may be required due to the current users streaming more video, from new users who are shifting from traditional forms of TV viewing or from an increase in the number of users with internet connection. Network capacity will expand to meet this additional demand through a combination of means, which may result in an increase in total network energy, but is unlikely to do so linearly.