SustainableWebDesign.org
Creators:: Mightybytes and Wholegrain Digital
Source:: https://sustainablewebdesign.org
Description
Sustainable web design is an approach to designing web services that puts people and planet first. It delivers digital products and services that respect the principles of the Sustainable Web Manifesto: clean, efficient, open, honest, regenerative, and resilient.
Strategies
Design
https://sustainablewebdesign.org/category/design/
Development
https://sustainablewebdesign.org/category/development/
Calculating carbon emissions of web services
Webpage: https://sustainablewebdesign.org/calculating-digital-emissions/
Why is it difficult?
- network system boundaries
- some studies only include the IP core network and access networks
- additional components: undersea cable, data centers, home network equipment, user devices
- include embodied carbon?
- data up-to-date? many studies are a few years old, so they don't include gains in efficiency
GHG Protocol
It is designed to work with well known standards like the GHG Protocol Corporate Standard, to allow an organization to model the environmental impact from digital services, typically as part of their Scope 3, or supply chain emissions.
System segments
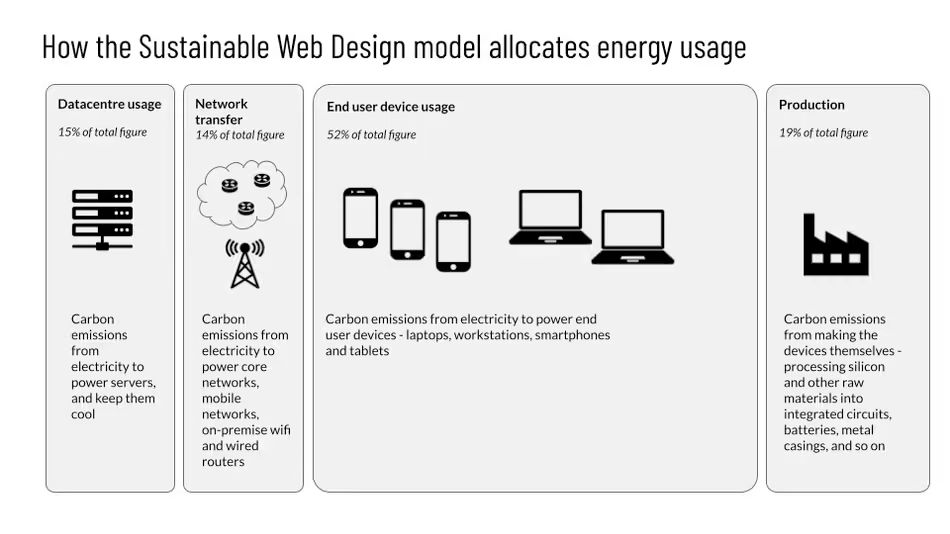
- Consumer device use: end users interacting with a product or service. This accounts for an estimated 52% of the system. Returning visitors are assumed to be 25%, loading 2% of data.
- Network use: data transferred across the network. This accounts for an estimated 14% of the system.
- Data center use: energy required to house and serve data. This accounts for an estimated 15% of the system.
- Hardware production: embodied energy used in the creation of embedded chips, use of data centers, use of networks, and the use of consumer communication devices. This accounts for an estimated 19% of the system.
Source: @Andrae.2020.NewPerspectivesInternet
Emissions Calculation Formulas
Constant value of 0.81 kWh/GB is derived from raw data for the “Expected 2020 scenario” from the Andrae study. It tries to include the energy consumption of all system segments: consumer device use (52 %), network use (14 %), data center use (15 %) and hardware production (19 %).
The model also tries to account for caching:
- 75% of requests are uncached - use the full figure for data transfer
- 25% of requests ARE cached - use a much smaller figure here, and divide this figure by 50
Energy per visit in kWh
E = [Data Transfer per Visit (new visitors) in GB x 0.81 kWh/GB x 0.75] + [Data Transfer per Visit (returning visitors) in GB x 0.81 kWh/GB x 0.25 x 0.02]
Emissions per visit in grams CO2e
C = E x 442 g/kWh (or alternative/region-specific carbon factor)
