Accounting of GHG Emissions from Digital Services & Companies
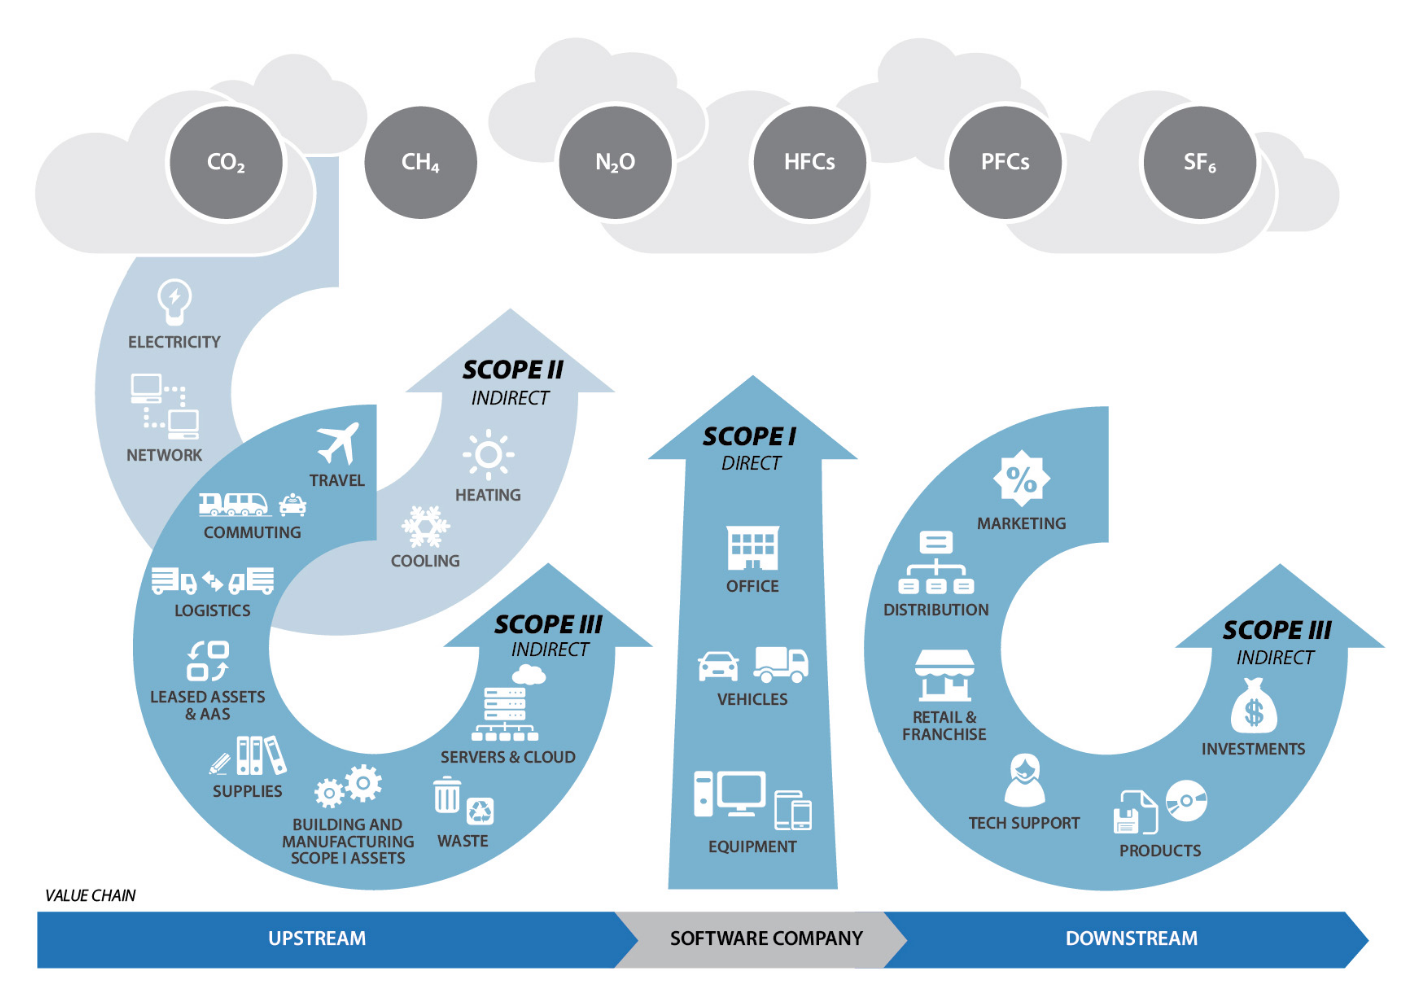
The Software Company Scopes model presents an overview of scopes and emissions across the value chain of a software company with visualization adopted from the GHG Protocol Corporate Value Chain Accounting Reporting standard [8].
Technology Carbon Standard
Proposal on how to analyze an organization's technology carbon footprint.
Includes digital emissions (scope 1-3) from off-the-shelf software, employee hardware, servers, used cloud services, network data transfer, end-user-devices, etc.
Case Study: Green Web Foundation
Cloud Services
Cloud Provider
AWS, Microsoft Azure und Google are starting to provide scope 3 emissions of their services into their carbon reports, dashboards, APIs, etc..
SaaS
I'm not aware of any SaaS that provides data about their carbon footprint.
Initiative Climat International (iCI)
Wholegrain Digital (digital agency from the UK)
Exploring the complexity of Scope 3 emissions and the responsibility of the digital sector (blog post by Marketa Benisek from Wholegrain Digital)
Google and Mozilla provide an interesting perspective on the implications of different reporting methodologies. Mozilla, a smaller company with around 1,000 employees, reported a carbon footprint of approximately 800k tonnes CO2e in 2019, attributing 98% of it to the use of its products by end users (Scope 3 emissions). In contrast, Google, with around 100k employees, reported a carbon footprint of 13 million tonnes in the same year, without including the use of its services by end users in their Scope 3 emissions. The significant difference in environmental impact raises concerns about transparency and accurate reporting.
Digital agencies that make polluting websites should take responsibility for that.
At Wholegrain Digital, we made the benchmarking process of our clients’ websites part of every project, as well as supporting them in understanding the basics of digital sustainability and adopting greener practices through their website (and beyond, if the client is interested).
Mozilla
Projects/Sustainability/Environmental Impact and Mitigation - MozillaWiki
2019
For Mozilla, Scope 3 emissions sources include the following material categories: business travel, employee data (including commuting and remote work), purchased goods and services, events, waste, use of products, transportation and distribution.
Purchased Goods & Services
For cloud services, key assumptions include (Carbon Emissions of Cloud Computing):
-
Annual server energy consumption: 1760.3 kWh/year
-
Server lifecycle emissions: 160 kgCO2e/year
-
Cloud utilization: 50% improvement over on-site servers
-
Server allocation per $ spend: 0.001 server / $ spend
-
Emissions factor: 0.0004 mtCO2e/kWh (based on global average Firefox emissions / kWh consumed)
0.0004 mtCO2e/kWh = 400 g CO2e/kWh
Result: 8,654
- Office expenses, electronic equipment, and other services: 3,489 mtCO2e
- Cloud Services: 5,165 mtCO2e
Use of Products
Key assumptions:
Breakdown of devices used to access each Mozilla product, e.g. total usage of Firefox desktop is split 65% laptop, 35% desktop computer. Emissions factors applied to regions are derived from country-level emissions factors and appropriately represent emissions by broad geographic region. Energy consumption of technology used to access Mozilla products uses the entire power demand of that device (e.g. total estimated power demand of the device is required to assess/use Mozilla products, not a portion of device power).
Calculation Details:
Hours of session time in each region is multiplied by estimated power consumption of devices and device breakdown (% laptop, % tablet, etc.) used to access Mozilla products. This calculation produces total annual kWh by region. Regional electricity emissions factors are applied to calculate total regional emissions and summed to calculate total emissions by product.
Example:
South America Region: 1.5B hour session time x (65% laptop x 60w laptop power) + (35% desktop x 110w desktop power) = 119 GWh regional electricity x region emissions factor .000350 mtCO2e/kWh = 41,893 regional mtCO2e
0.000350 mtCO2e/kWh = 350 g CO2e/kWh
Result: 785,474 mtCO2e