Energy Carbon Intensity
Definition
Average Carbon Intensity
Average number of grams of carbon dioxide that is emitted by energy consumption in a specific time frame (e.g. one hour). Location-based accounting is used, not market-based.
Marginal Carbon Intensity
Grams of carbon dioxide that is emitted caused by an additional energy consumption (e.g. if workloads are shifted to a different time).
Sources with real-time grid data
Electricity Maps
Electricity Maps Visualization
https://app.electricitymaps.com/
updated hourly, 50+ countries
Visualization is open source: https://github.com/electricitymaps/electricitymaps-contrib
CO2signal API
API to get the most recent carbon intensity numbers for any country on Electricity Maps.
Free for individual users and developers.
API documentation: https://docs.co2signal.com
WattTime
https://www.watttime.org/explorer/#4/51.34/10.45
Live global coverage map
carbon-aware-computing.com
Code is provided open source by bluehands and data is published as CC0 by Fraunhofer (see section [[#Energy Charts]] below).
https://www.carbon-aware-computing.com/
https://github.com/bluehands/Carbon-Aware-Computing
Actual Grid Intensity (Swagger UI): https://intensity.carbon-aware-computing.com/swagger/UI
Forecast API (Swagger UI): https://forecast.carbon-aware-computing.com/swagger/UI
Carbon Intensity API (UK only)
https://www.carbonintensity.org.uk/
Open Grid Emissions by Singularity (US only)
https://singularity.energy/open-grid-emissions
Sources with aggregated data
Energy Charts
https://www.energy-charts.info/
Die Rohdaten werden von Wissenschaftlern des Fraunhofer-Institut für Solare Energiesysteme ISE aus zahlreichen Quellen stündlich oder täglich abgerufen und für die Darstellung aufbereitet.
Agorameter
https://www.agora-energiewende.de/en/service/recent-electricity-data/
All data is usually entered within 48 hours.
Ember
Ember provides electricity demand, generation, capacity and CO2 data by country for free. The data is updated monthly.
Ember API
https://ember-energy.org/data/api/
API for open electricity data on yearly and monthly electricity generation, demand, power sector emissions and carbon intensity
Electricity Data Explorer
https://ember-climate.org/data/data-tools/data-explorer/
Many datasets including yearly CO2 intensity data per country.
Can also be used to compare countries or regions.
Our World in Data
https://ourworldindata.org/grapher/carbon-intensity-electricity
Chart and Map based on the data from Ember.
Visualizations
Animation: Carbon intensity of electricity consumption of the last 25 days (Twitter)
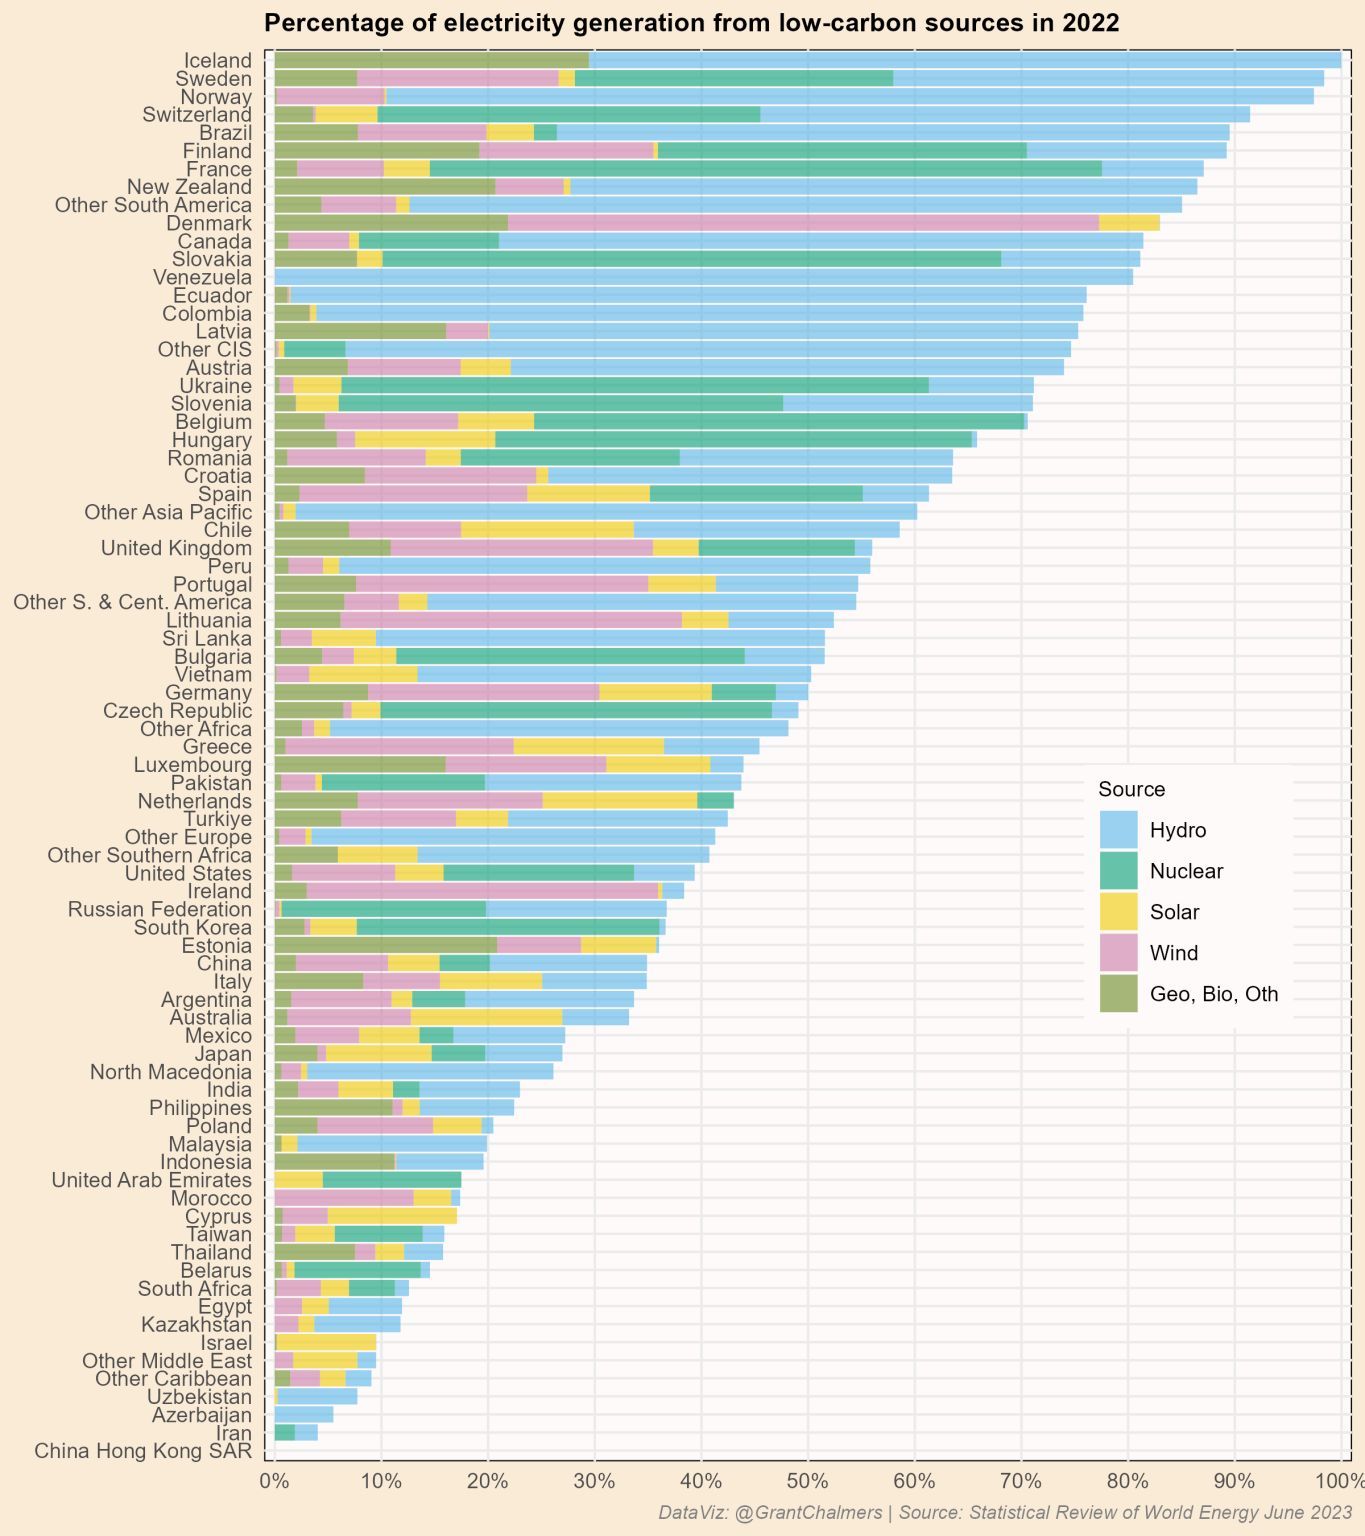
ElectricityMap Visualisations in R | by Grant Chalmers | The Kernel | Medium
Usages
Values per Energy Source
Carbon emissions of different electricity supply technologies