Energy consumption & carbon emissions of data centers
The consumption and emissions caused by data centers are part of the Global energy consumption & carbon emissions of the whole ICT sector.
Global energy usage
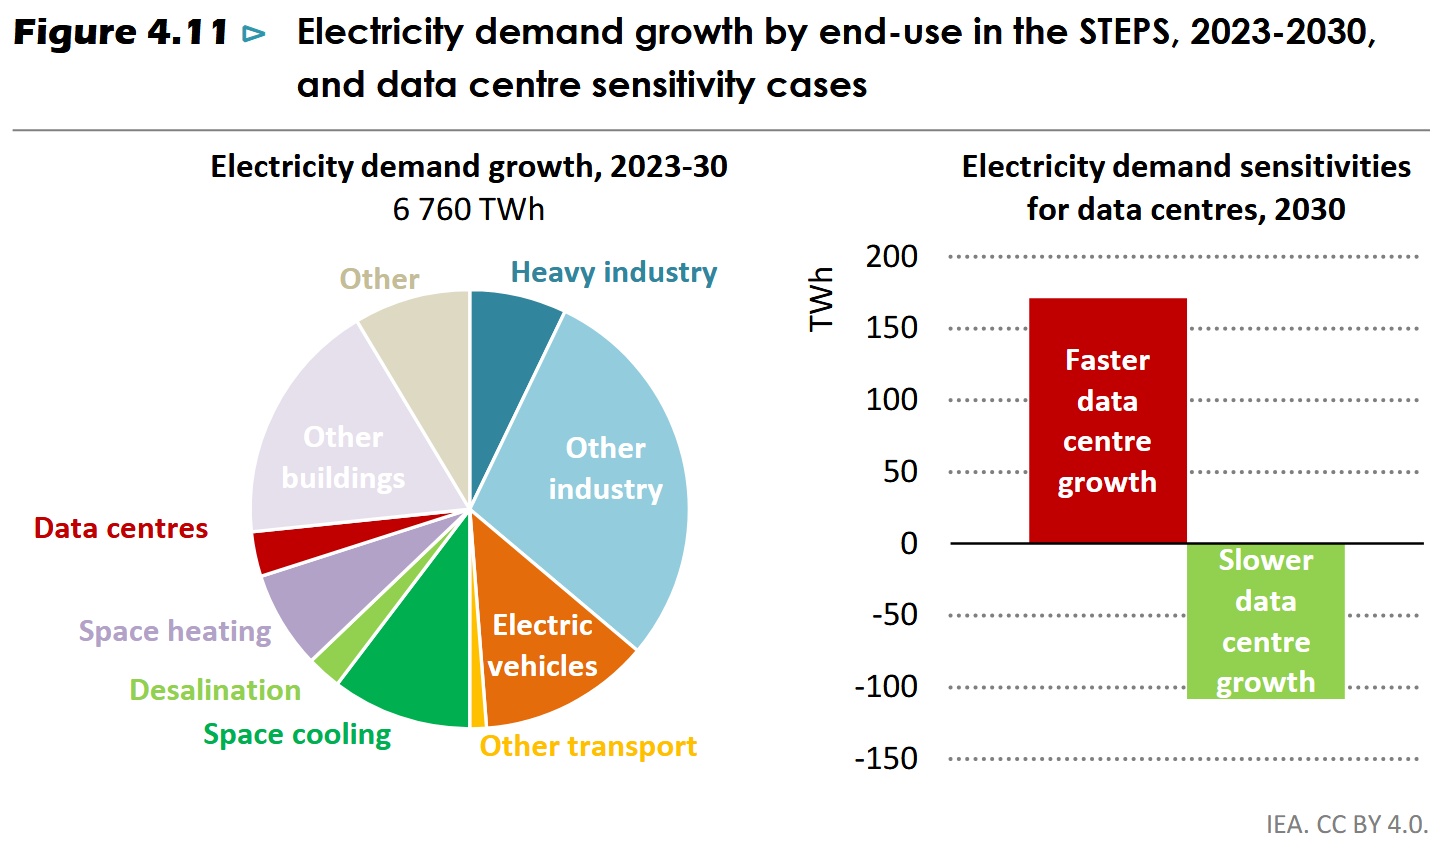
IEA: World Energy Outlook 2024
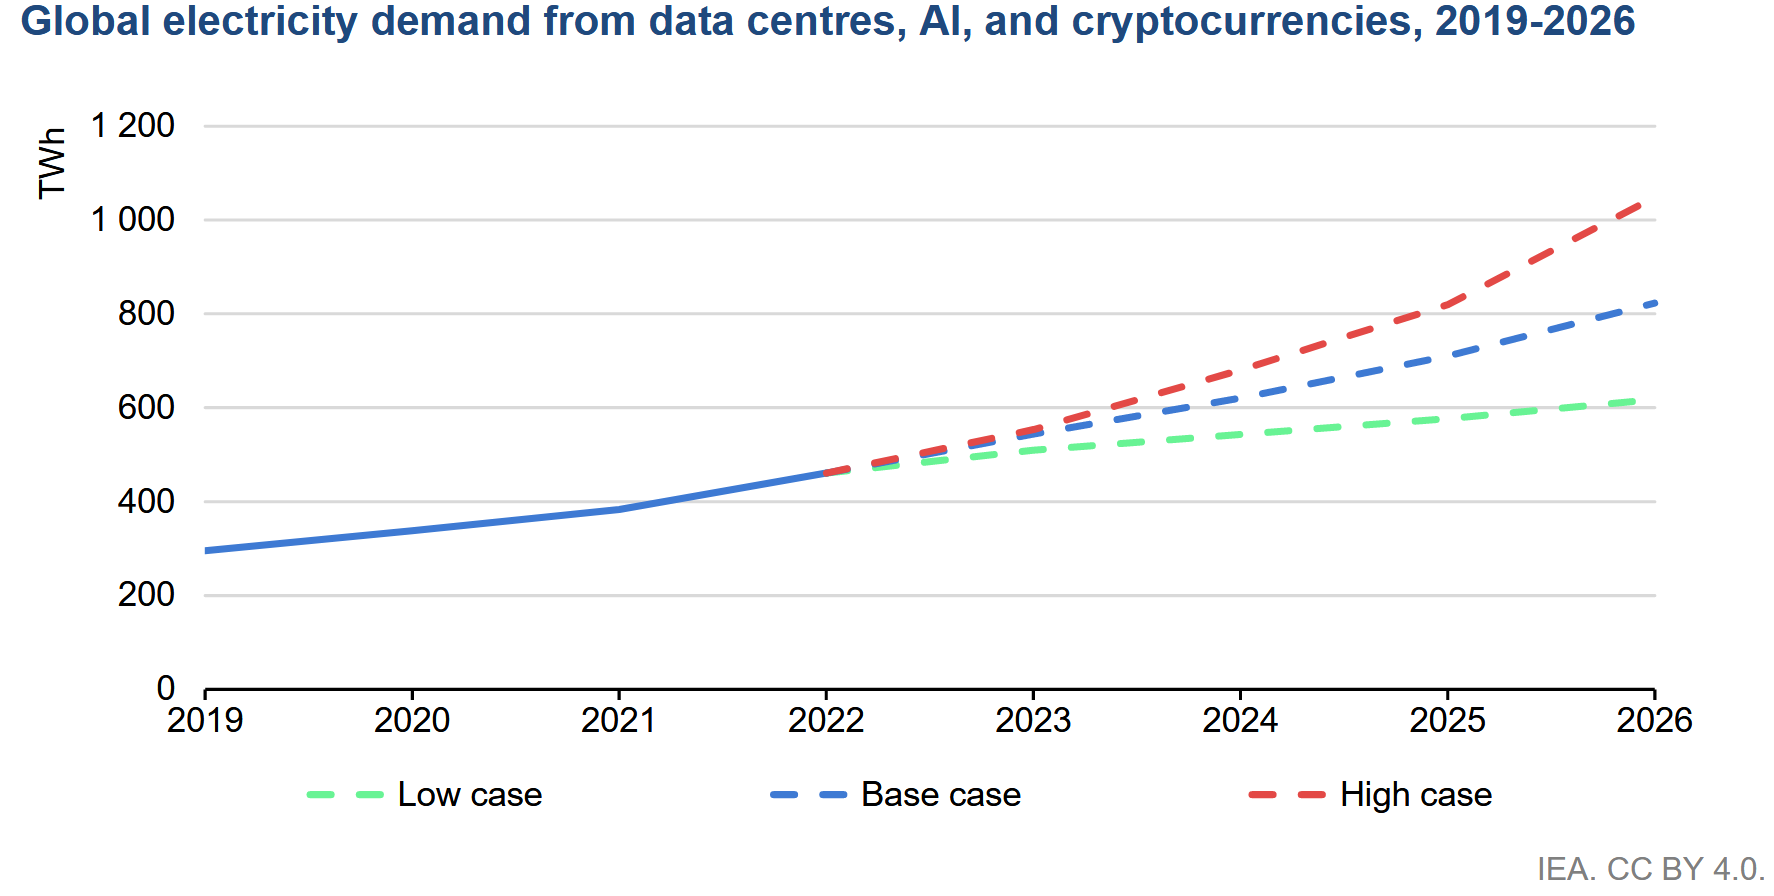
IEA: Electricity 2024
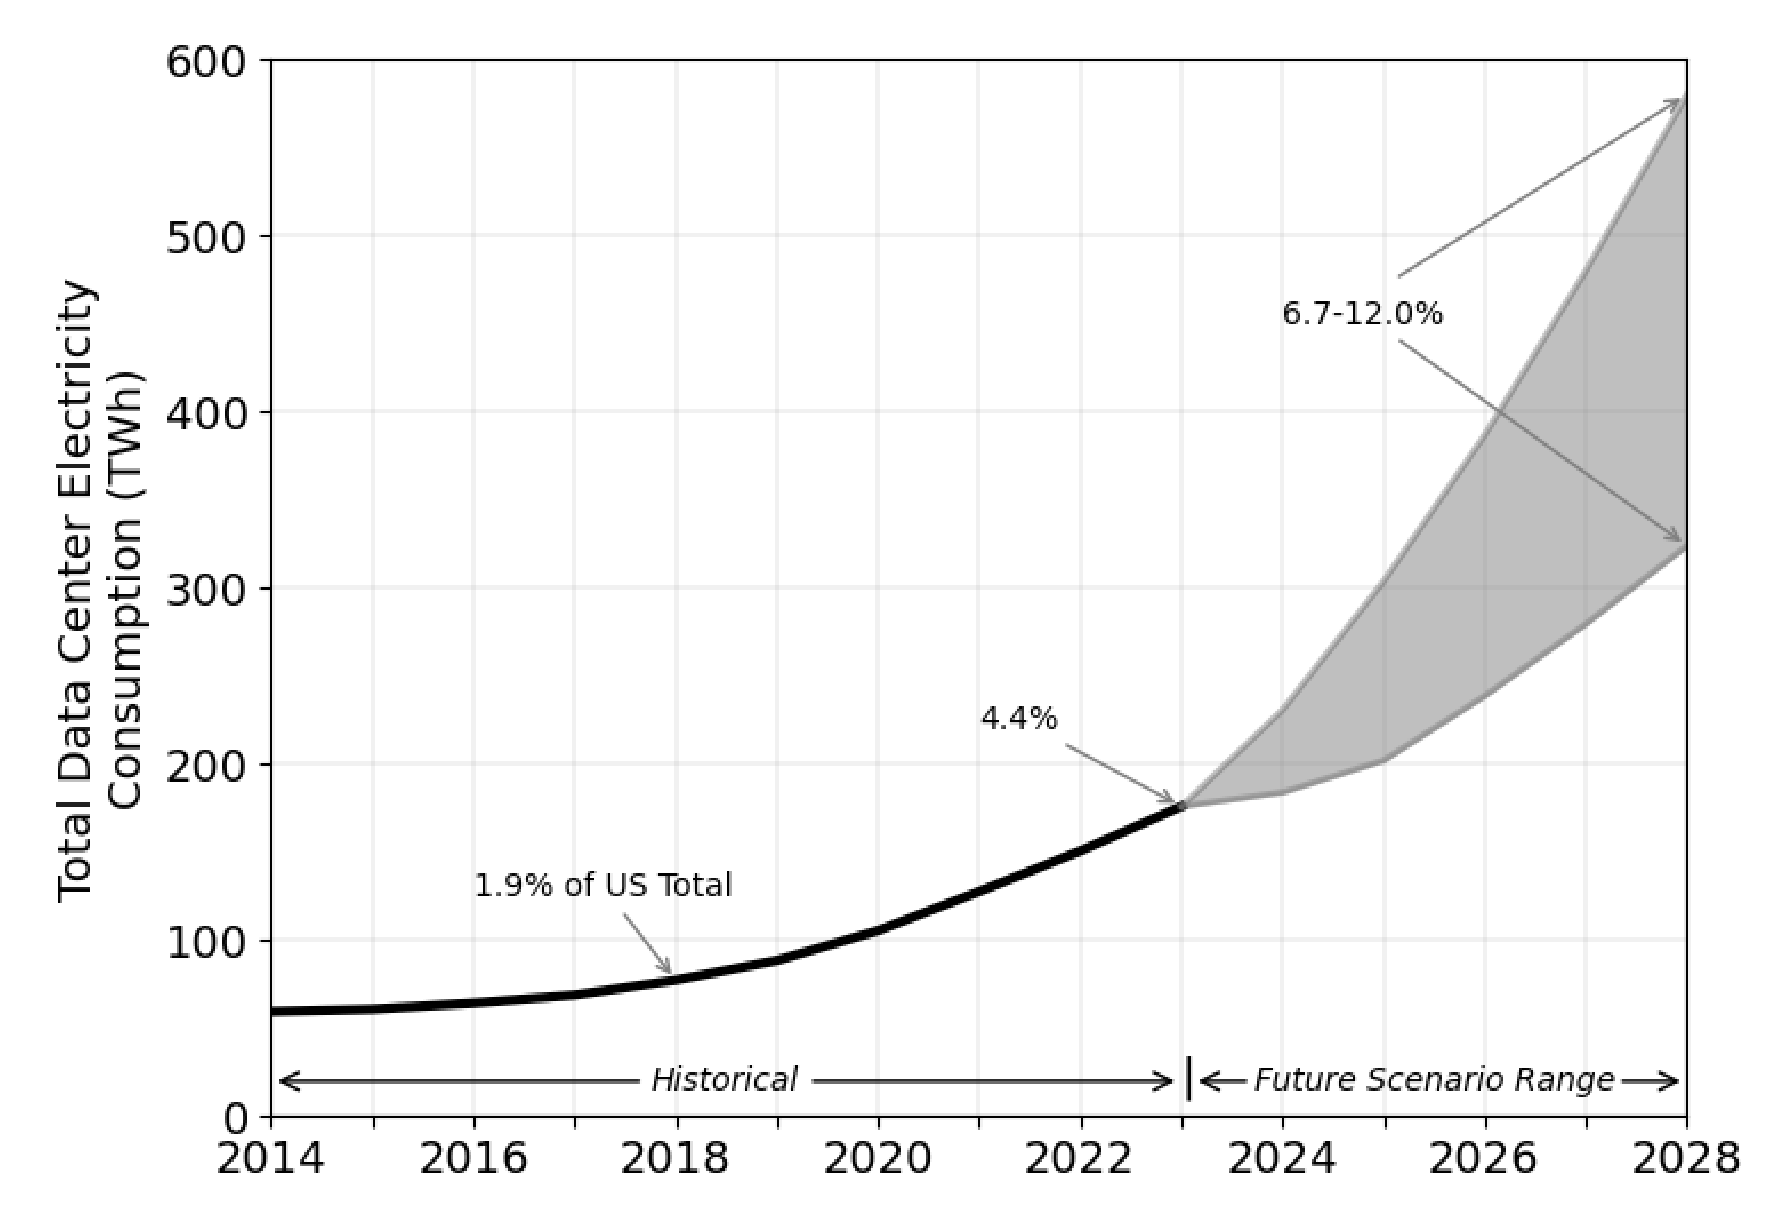
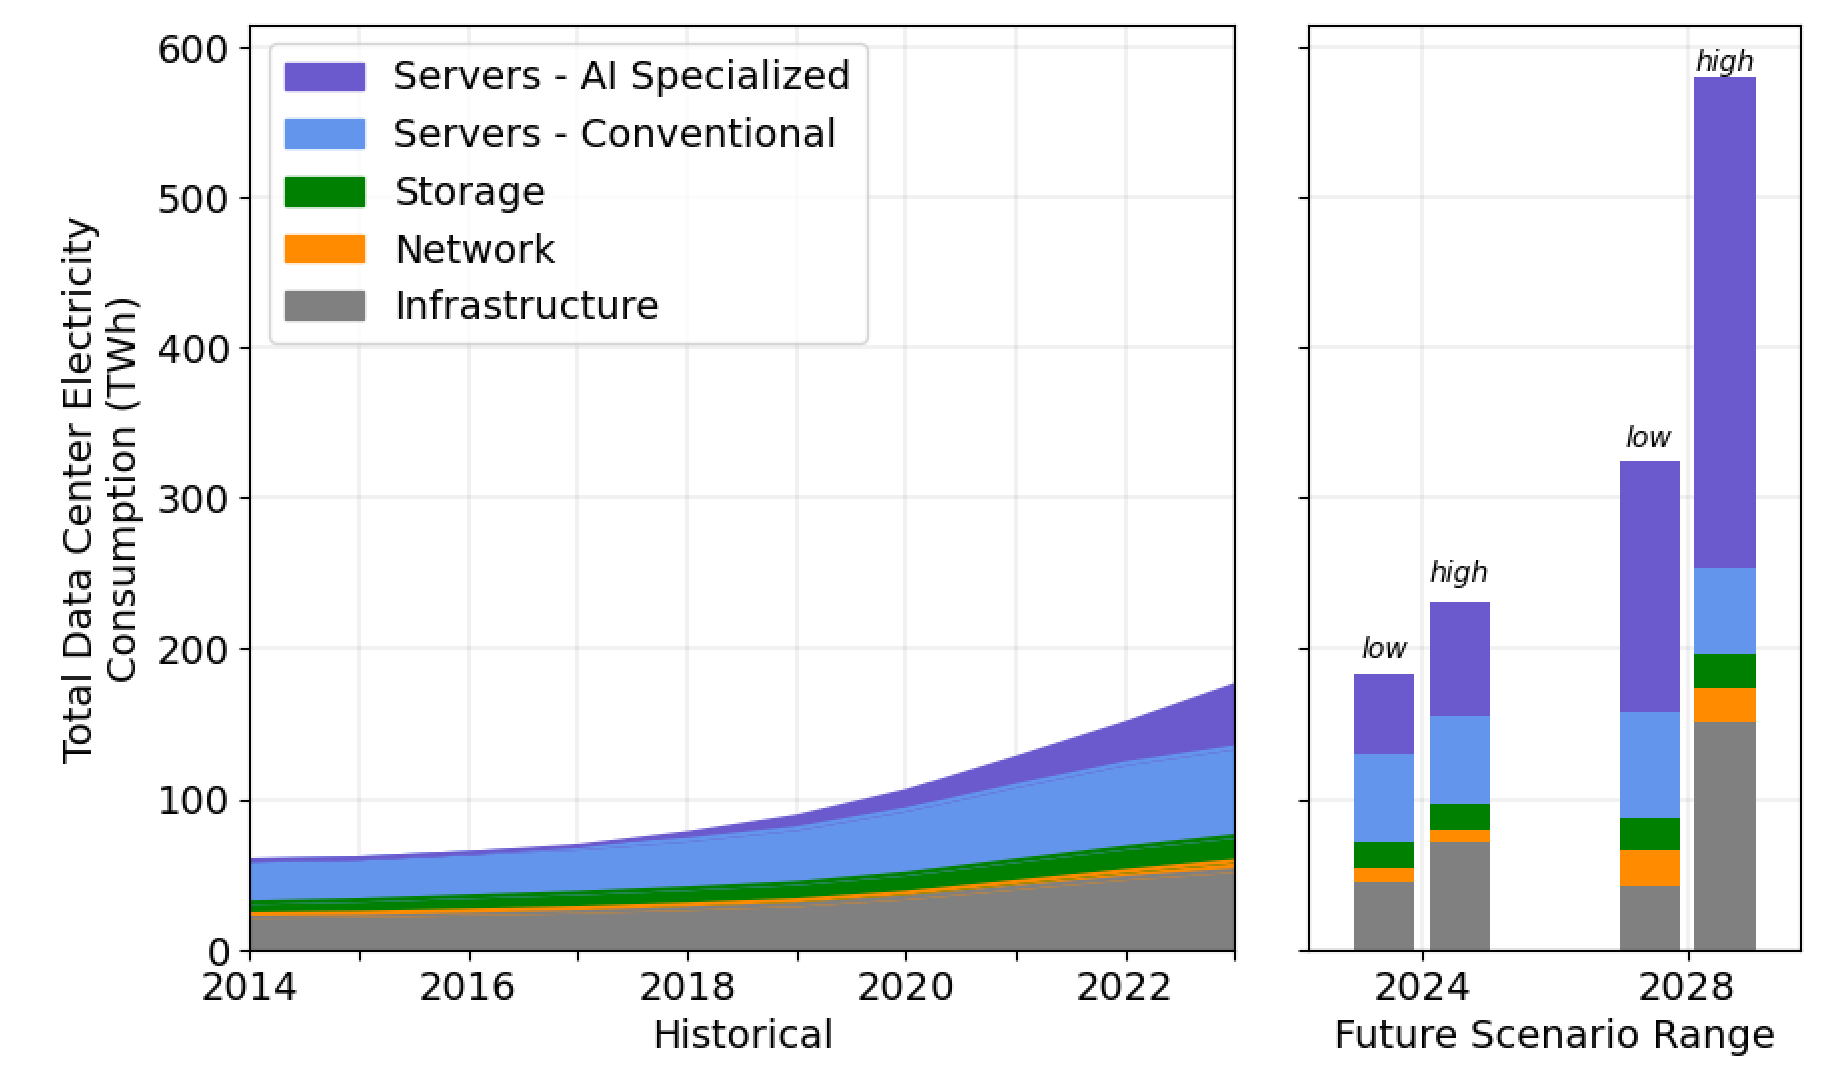
EPRI (2024)
Powering Intelligence: Analyzing Artificial Intelligence and Data Center Energy Consumption
https://www.epri.com/research/products/3002028905
IEA (2023)
IEA (2023), Data Centres and Data Transmission Networks, IEA, Paris https://www.iea.org/energy-system/buildings/data-centres-and-data-transmission-networks, License: CC BY 4.0
Global GHG emissions:
The data centres and data transmission networks1 that underpin digitalisation accounted for around 330 Mt CO2 equivalent in 2020 (including embodied emissions), equivalent to 0.9% of energy-related GHG emissions (or 0.6% of total GHG emissions). Since 2010, emissions have grown modestly despite rapidly growing demand for digital services, thanks to energy efficiency improvements, renewable energy purchases by information and communications technology (ICT) companies and broader decarbonisation of electricity grids in many regions. However, to get on track with the NZE Scenario, emissions must halve by 2030.
Global energy consumption:
Estimated global data centre electricity consumption in 2022 was 240-340 TWh1, or around 1-1.3% of global final electricity demand. This excludes energy used for cryptocurrency mining, which was estimated to be around 110 TWh in 2022, accounting for 0.4% of annual global electricity demand.
Global trends in digital and energy indicators, 2015-2021:
| 2015 | 2022 | Change | |
|---|---|---|---|
| Internet users | 3 billion | 5.3 billion | +78% |
| Internet traffic | 0.6 ZB | 4.4 ZB | +600% |
| Data centre workloads | 180 million | 800 million | +340% |
| Data centre energy use (excluding crypto) | 200 TWh | 240-340 TWh | +20-70% |
| Crypto mining energy use | 4 TWh | 100-150 TWh | +2300-3500% |
| Data transmission network energy use | 220 TWh | 260-360 TWh | +18-64% |
table copied 2024-03-05
Masanet et al. (2020)
Overview by David Mytton
How much energy do data centers use? · David Mytton
Server: 118W for single socket servers and 365W for two socket servers
Storage:
- HDD: 8.6W/disk in 2015, decreasing by 5 % every year
- SSD: 6W/disk
Network: 0.06 kWh/GB in 2015, decreasing by 50 % every two years
Infrastructure: Industry average PUE is 1.67 (2019)
Europe
Energy Consumption in Data Centres and Broadband Communication Networks in the EU (2024)
Data centres in the EU-27 used an estimated 45–65 TWh of electricity in 2022, or 1.8–2.6% of total electricity consumption.
https://publications.jrc.ec.europa.eu/repository/bitstream/JRC135926/JRC135926_01.pdf
Trends
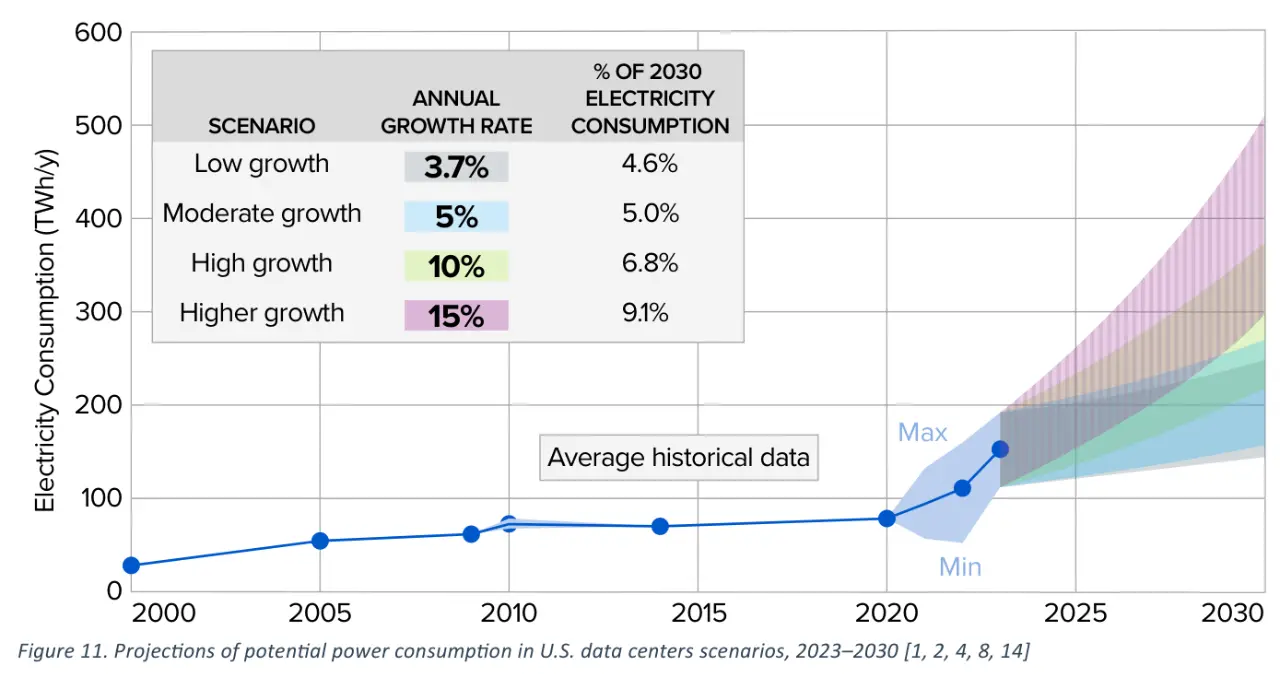
Berkely Lab (2024)
2024 United States Data Center Energy Usage Report
Data centres' share of US energy could triple 2023-2028 - from 4.4% to 12% of total US energy consumption.
Koomey, J., & Masanet, E. (2021)
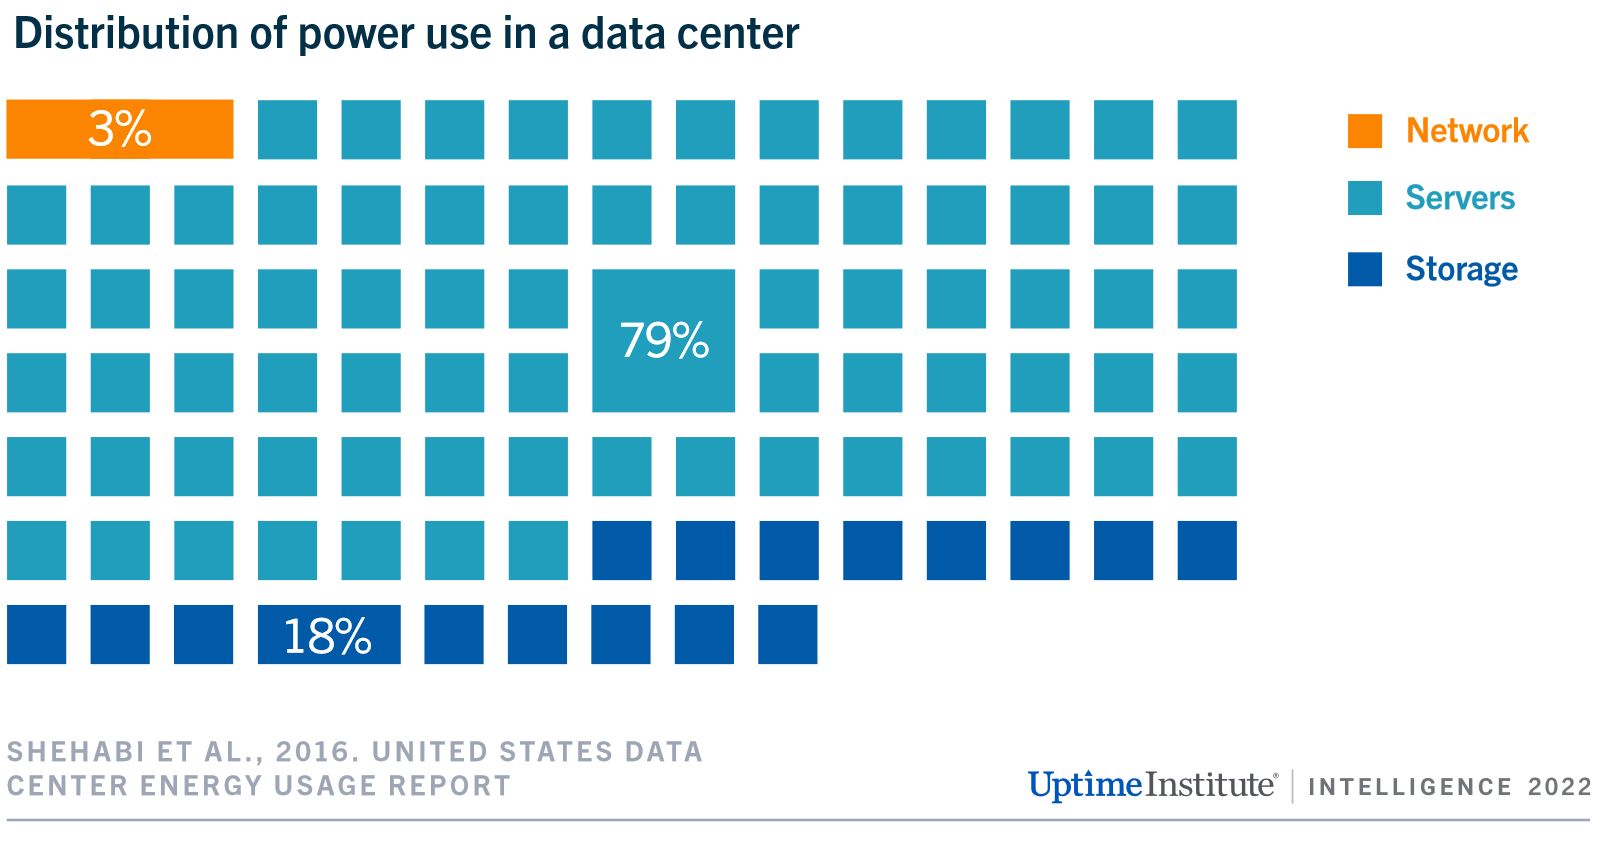
Distribution of power usage
Efficiency
Optimize Server Utilization for Energy Efficiency and Embodied Carbon
Embodied Carbon
Embodied carbon of ICT devices
Carbon emissions of cloud data storage
Estimates of different literature resources (copied from Why is it important to limit infobesity in Microsoft 365? | Thibault Joubert):
| Source | Value (for 1 GB) | Scope | Methodology (with French energy mix: 80g CO2e per kWh) |
|---|---|---|---|
| Stanford (2017) | 250 g CO2e per year | Storage only | Estimation of 3 kWh per GB |
| Shift Project (2020) | 80 g CO2e per year | Storage only | Estimation of 1 kWh per GB with French “Caisse des Dépots” |
| Green Cloud Computing (2021) | 35g CO2e per year | Storage and datacenter | 0.65 W per hour per TB, 6x replication |
| Negaoctet (2022) | 12g CO2e per year | Storage and datacenter | From a Netflix storage analysis |
| ADEME (?) | 0.24 gCO2 per year | Storage and datacenter | Source from Negaoctet ? |
Note: the data correspond to the French energy mix which is particularly low in carbon (e.g. United States x6).
Comparison to local data storage
- Storage of data locally on a hard drive consumes 3000 times less energy in many scenarios than if you stored it in the cloud (Gerry McGovern)
Metrics
→ Data Center Sustainability Metrics
Regional issues
Ireland
Ireland's data centres turning to fossil fuels after maxing out country's electricity grid
over 135,000 tonnes of CO2 was emitted from these centres in the last five years from generators not on the electricity grid.
[…]
These backup generators are used to keep the energy-hungry equipment in these centres operational during times of grid connectivity issues.
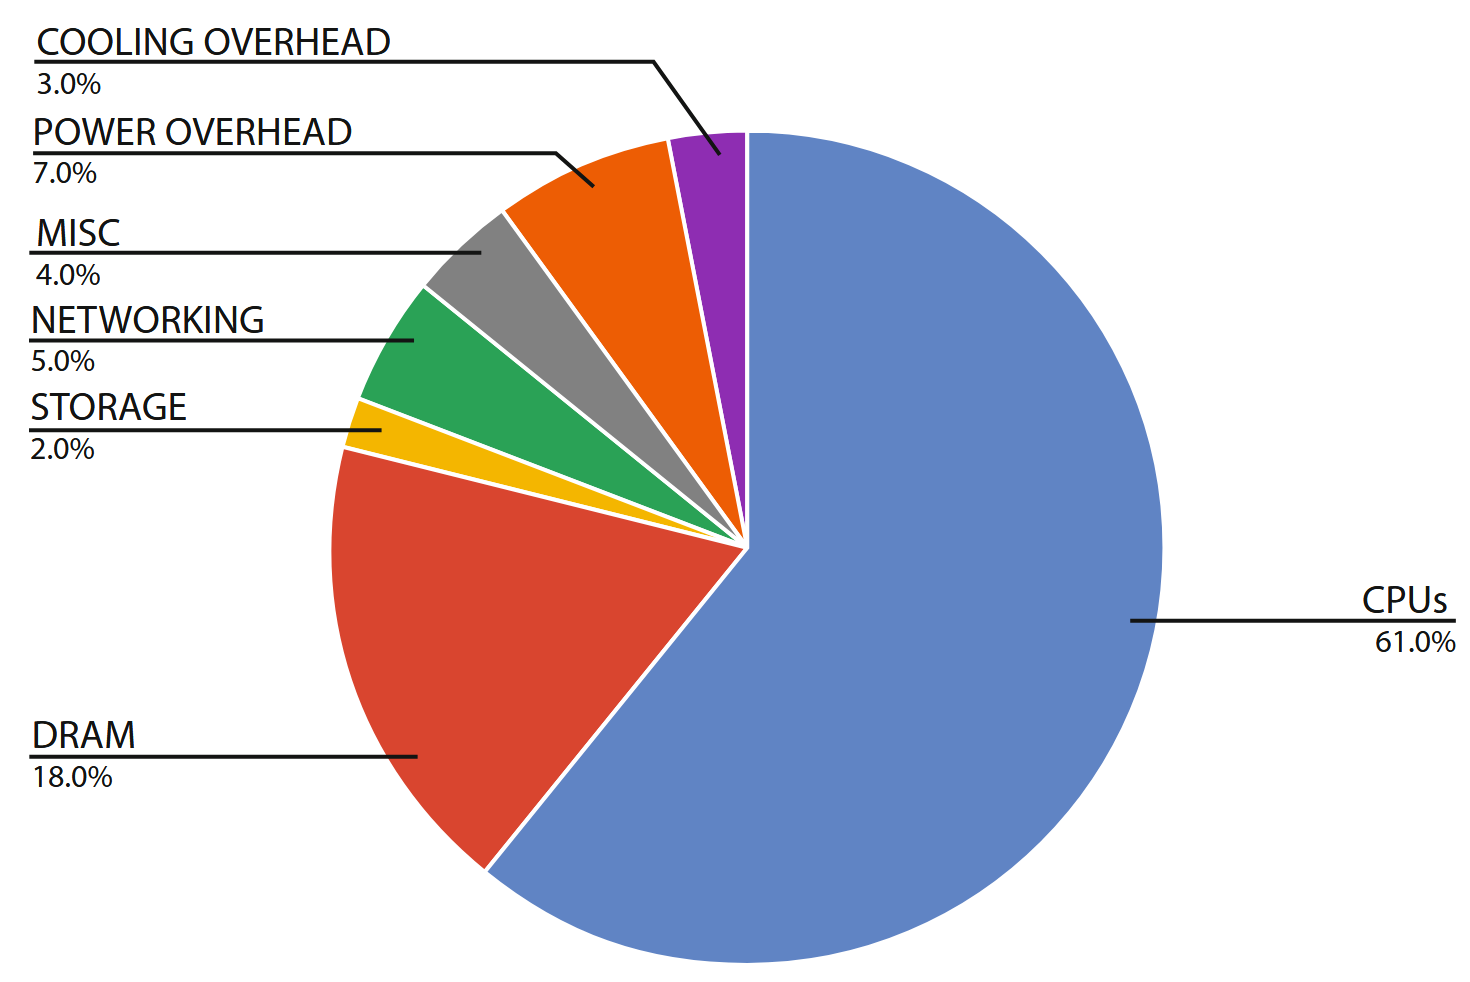
Distribution of Data Center Costs
Total Cost of Ownership of a Data Center
🔗 References
Isotopp – Data Centers and Energy
Gerry McGovern on Designing a Greener Web
Why is it important to limit infobesity in Microsoft 365? | Thibault Joubert
