Energy consumption of network communication
Together with Arne Tarara I wrote a blog article about this topic:
www.green-coding.io/blog/network-carbon-emissions-in-green-software/
System boundaries
The system boundaries are set differently depending on the study.
Examples of different system boundaries:
- mobile network: data transfer between base station and end-user device
- data exchange between data centers
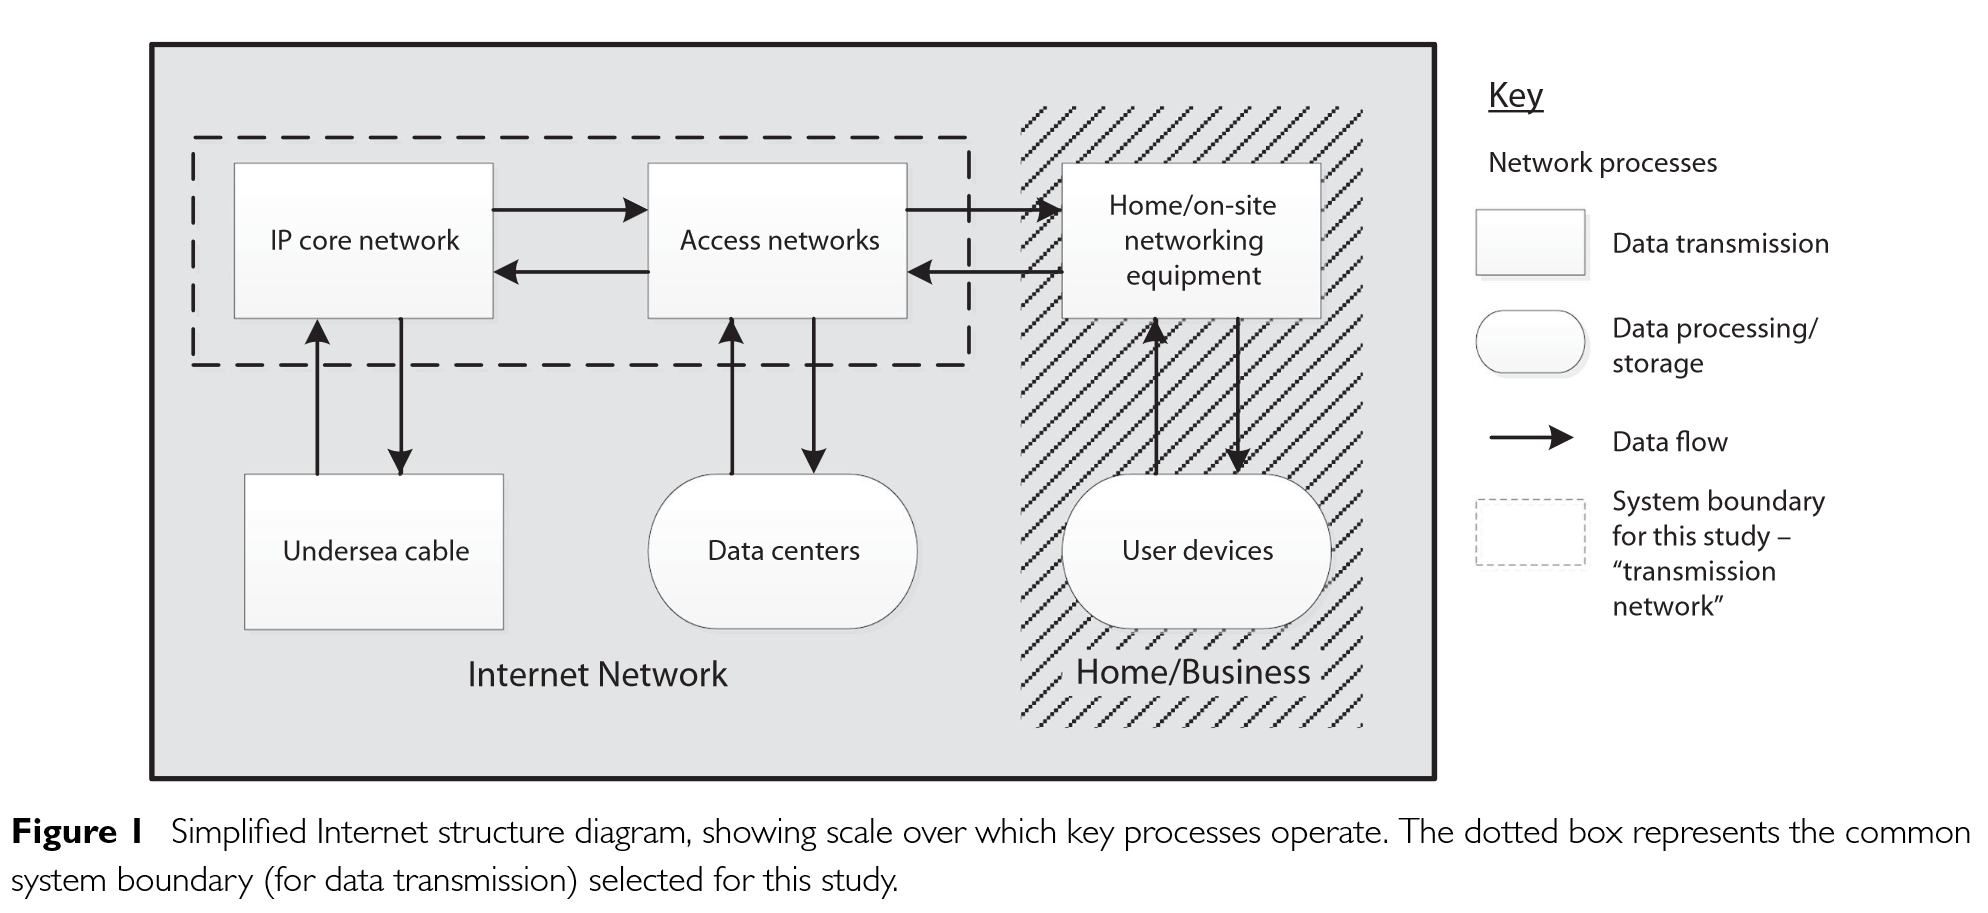
- internet traffic / transmission network: data transfer between a data center and a end-user device (data center and end-user devices are excluded; differentiation between fixed-line and mobile access is important)
See also the network categories defined by the Technology Carbon Standard:
- operational network
- backbone internet
- public wireless networks
- client network
Energy consumption of internet data transfer
Often the metric kWh/GB is used to calculate the energy consumption of network transfer. However, there is no correlation between the amount of transferred data and energy consumption! Therefore it can't be used for consequential reasoning (halve the data transfer != halve the emissions).
Coroama 2021
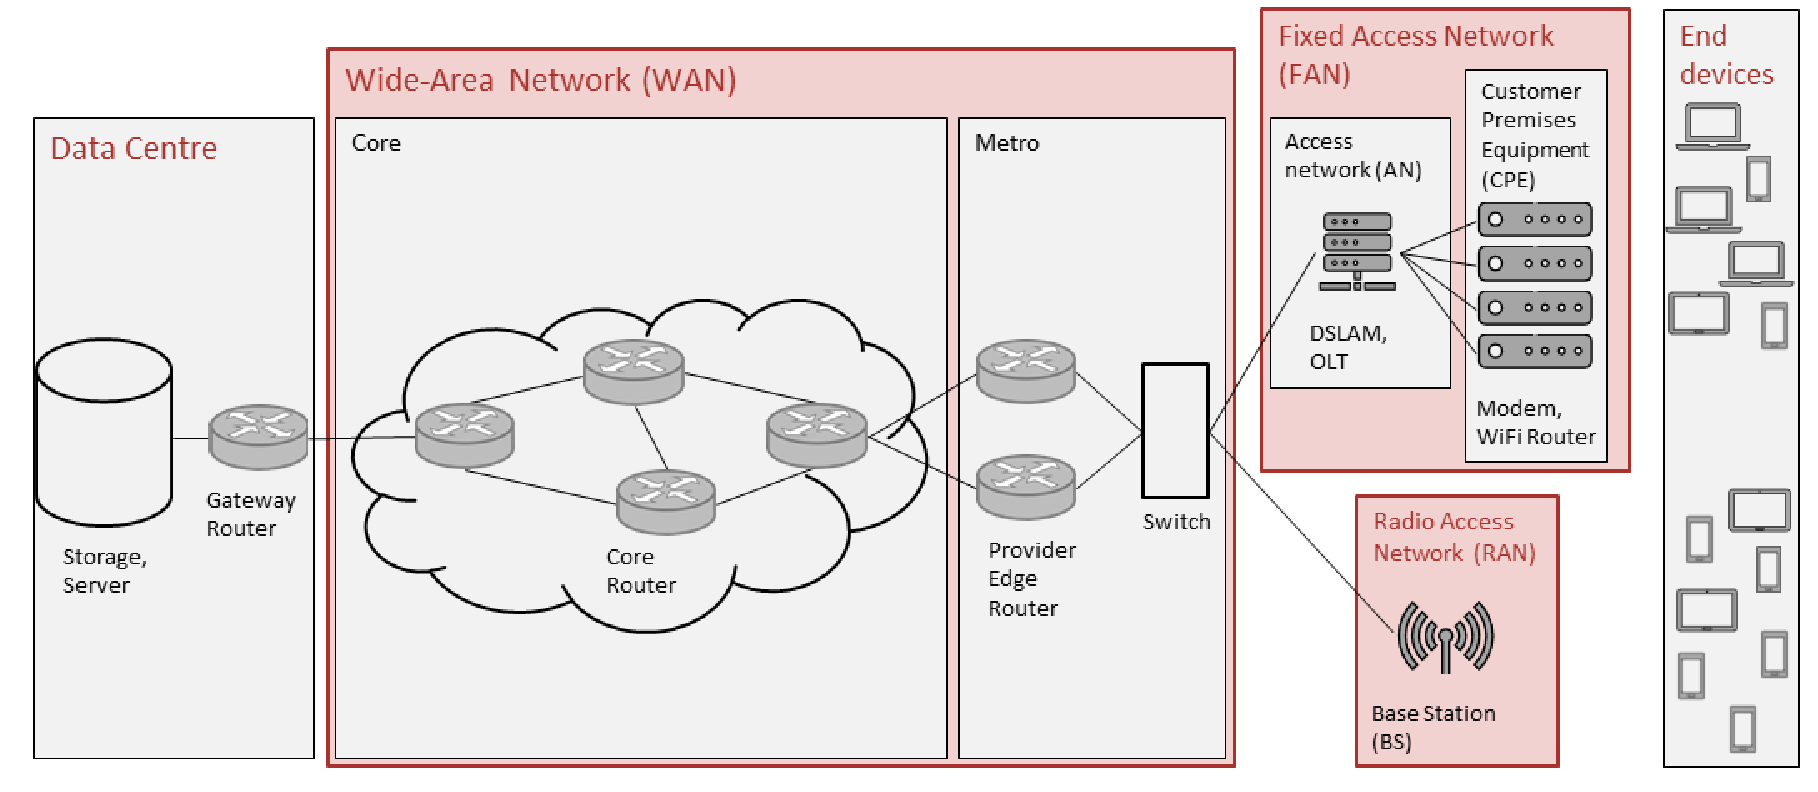
Figure 3 High-level topology of the Internet, distinguishing between data centres (DCs), end devices, and three distinct types of the network: the wide-area network (WAN), fixed access network (FAN), and radio access network (RAN).
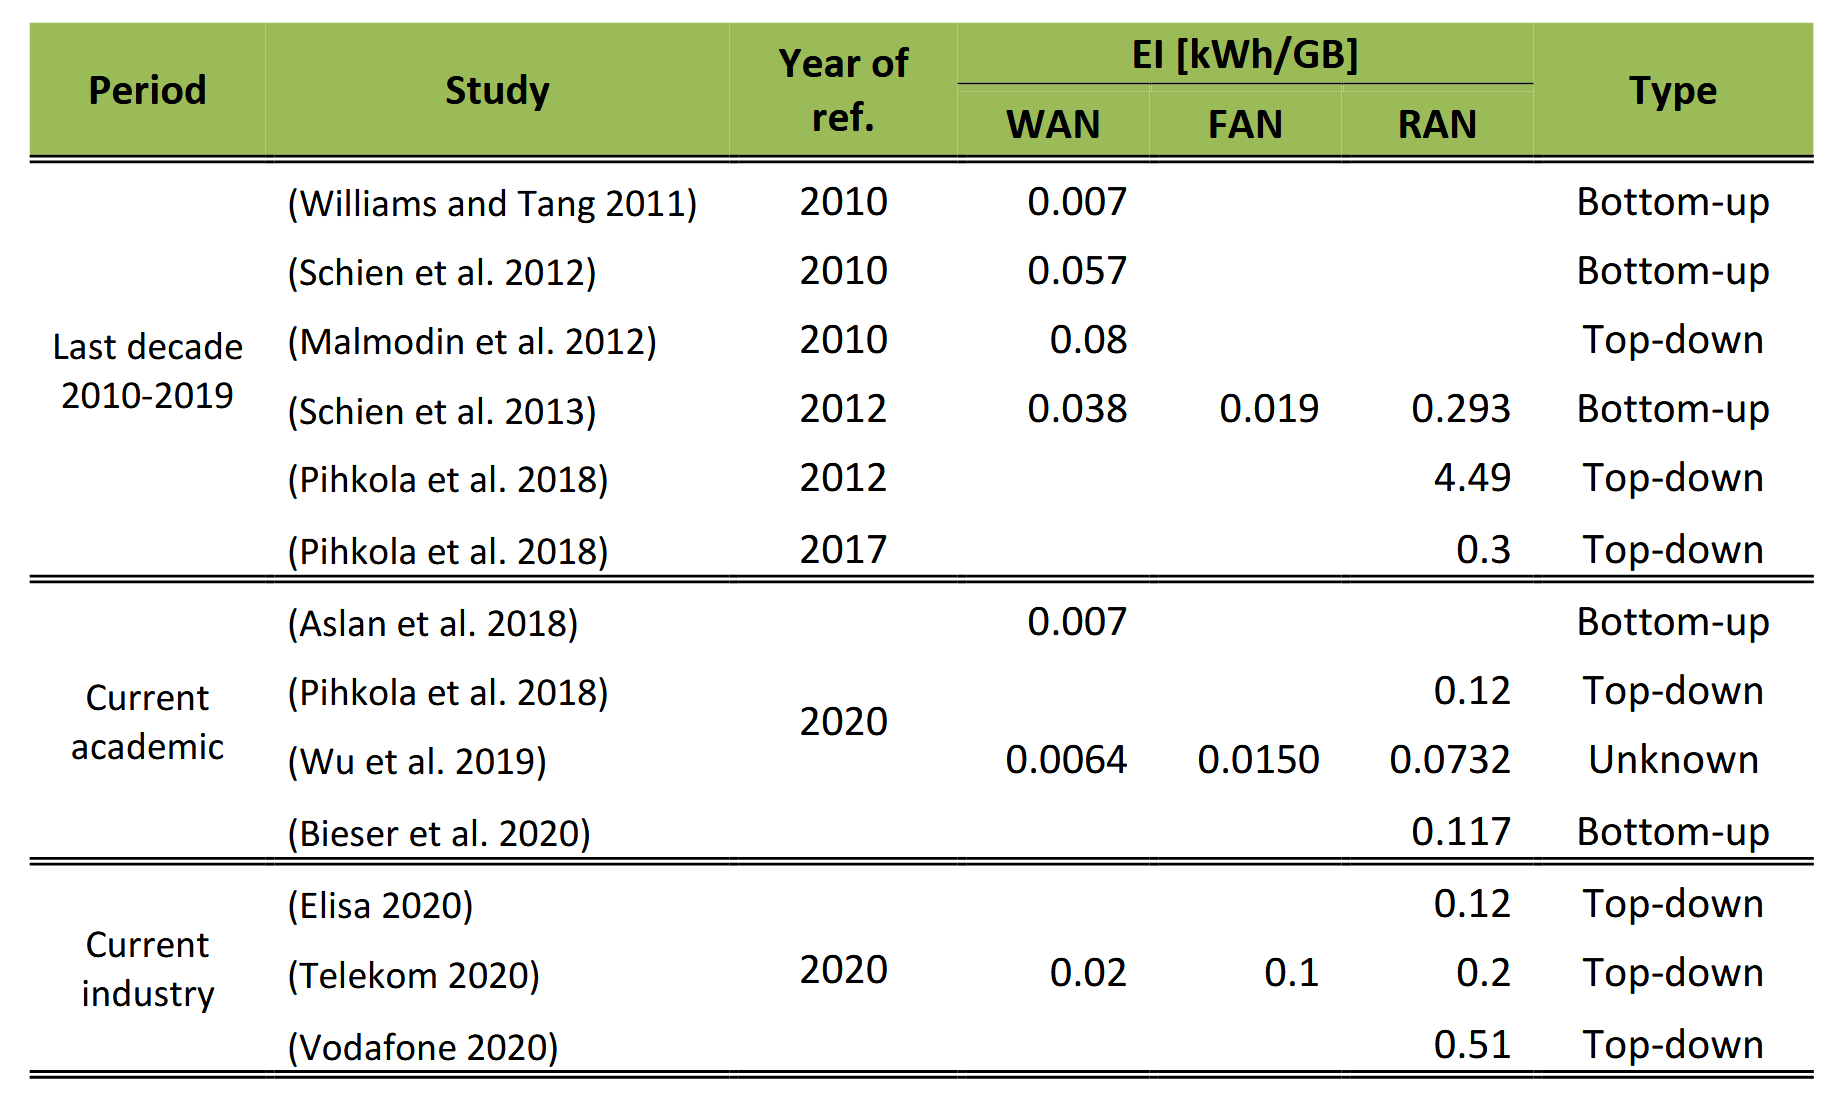
Table 1 Summary of existing estimates for EI (WAN), EI (FAN), and EI (RAN) for the last decade (2010 – 2019) and for today (2021).
Extrapolated numbers
Energy Intensity Factor:
| WAN | FAN | RAN | ||
|---|---|---|---|---|
| Reduction Factor | 0.8 | 0.85 | 0.8 | |
| 2020 | 0.02 | 0.07 | 0.2 | kWh/GB |
| 2021 | 0.016 | 0.0595 | 0.16 | kWh/GB |
| 2022 | 0.0128 | 0.050575 | 0.128 | kWh/GB |
| 2023 | 0.01024 | 0.04298875 | 0.1024 | kWh/GB |
| 2024 | 0.008192 | 0.036540438 | 0.08192 | kWh/GB |
| 2025 | 0.0065536 | 0.031059372 | 0.065536 | kWh/GB |
| 2026 | 0.0052429 | 0.026400466 | 0.0524288 | kWh/GB |
| 2027 | 0.0041943 | 0.022440396 | 0.041943 | kWh/GB |
| 2028 | 0.0033554 | 0.019074337 | 0.0335544 | kWh/GB |
| 2029 | 0.0026844 | 0.016213186 | 0.0268435 | kWh/GB |
Network mix (example):
| WAN | FAN | RAN | Total | ||
|---|---|---|---|---|---|
| Network Mix | 100% | 90% | 10% | ||
| 2025 | 0.0065536 | 0.027953435 | 0.0065536 | 0.041060635 | kWh/GB |
| 2026 | 0.0052429 | 0.023760419 | 0.0052429 | 0.034246179 | kWh/GB |
| 2027 | 0.0041943 | 0.020196357 | 0.0041943 | 0.028584965 | kWh/GB |
| 2028 | 0.0033554 | 0.017166903 | 0.0033554 | 0.023877789 | kWh/GB |
| 2029 | 0.0026844 | 0.014591868 | 0.0026844 | 0.019960577 | kWh/GB |
Aslan et al. (2018)
Scope: Transmission network
Aslan et al. estimate that data transmission costs decrease by 50% every two years.
Quote:
Numbers based on Aslan's rule
Formulas:
| Year | kWh/GB |
|---|---|
| 2015 | 0.06 |
| 2016 | 0.042426407 |
| 2017 | 0.03 |
| 2018 | 0.021213203 |
| 2019 | 0.015 |
| 2020 | 0.010606602 |
| 2021 | 0.0075 |
| 2022 | 0.005303301 |
| 2023 | 0.00375 |
| 2024 | 0.00265165 |
| 2025 | 0.001875 |
| 2026 | 0.001325825 |
| 2027 | 0.0009375 |
| 2028 | 0.000662913 |
| 2029 | 0.00046875 |
Andrae (2020)
Wireless access network: 0.18 kWh/GB
Fixed access wired networks: 0.07 kWh/GB
Energy consumption of mobile cellular communications
@Golard.etal.2023.EvaluationProjection4G5GRANEnergyFootprints
Projection for Belgium for 2020–2025 of radio access networks (RAN):
- Energy intensity of 4G only in 2025: ~0.15 kWh/GB
- Energy intensity of 5G only in 2025: ~0.01 - ~0.06 kWh/GB
- Carbon intensity in 2025 with 4G & 5G: 0.05 kgCO2e/GB
@Pihkola.etal.2018.EvaluatingEnergyConsumption
Mobile network in Finnland:
- 2016: 0.5 kWh/GB
- 2020: ~0.1 kWh/GB
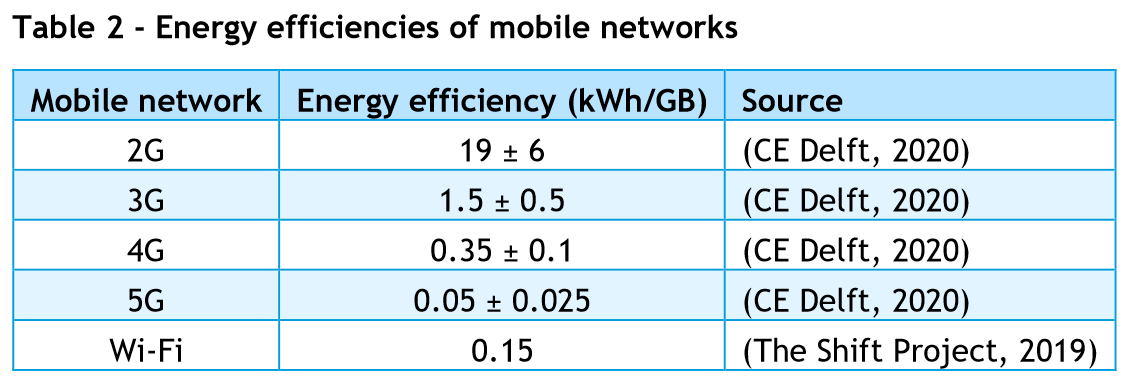
Energy efficiencies of different networks
Energy consumption of data transfer between data centers
Cloud Carbon Footprint
Data exchange between data centers of the same hyper-scale cloud provider:
0.001 kWh/Gb
Embodied carbon on network infrastructure
Embodied Carbon of Network Infrastructure
Footprint of unwanted data transfer
Energy consumption of advertisements
Carbon footprint of unwanted data-use by smartphones (Uijttewaal et al.)
Data used by website carbon calculators
The calculation model of SustainableWebDesign.org that is used by the CO2.js library and multiple website carbon calculators not only includes the energy used by the IP network, but also the energy used by consumer devices, data centers and the production of the hardware components.
See SustainableWebDesign.org#Emissions Calculation Formulas for more information.
Videostreaming
Climate emissions of videostreaming
What to do?
Romain Jacob: