Energy consumption per transferred data is a bad metric
This note is about why the network energy intensity model is a bad metric to quantify the real emissions of internet data traffic. However, it still has some value. See the blog article written by Arne and me How to Measure and Act on Network Carbon Emissions in Green Software.
Mytton et al. (2024)
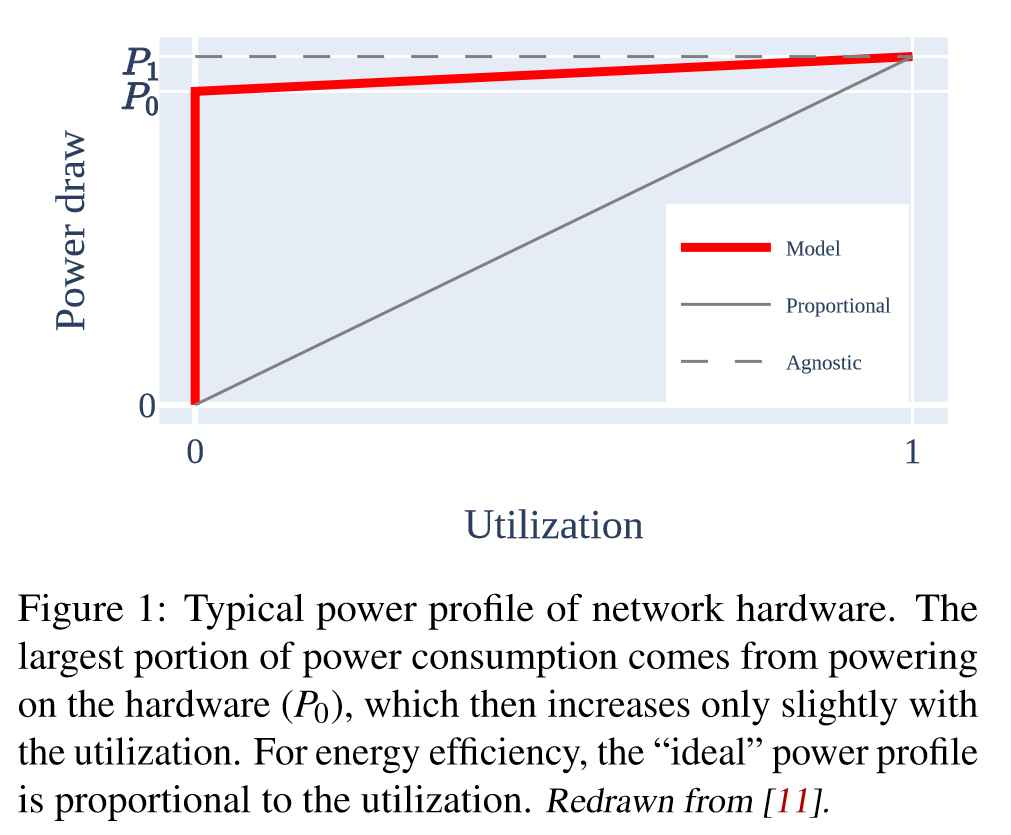
It is commonly assumed that data volume and network energy consumption are directly proportional, a notion perpetuated by numerous studies and media coverage. This paper challenges this assumption, offering a comprehensive examination of network operations to explain why the relationship between energy consumption and data volume is nonlinear. The power model approach is explored as an alternative methodology for calculating network energy consumption providing a more reliable representation of network energy use. The power model demonstrates that simple energy intensity calculations, expressed as kilowatt hours per gigabyte of data, are insufficient for accurately estimating real-world network energy consumption.
Mytton, D., Lundén, D., & Malmodin, J. (2024). Network energy use not directly proportional to data volume: The power model approach for more reliable network energy consumption calculations. Journal of Industrial Ecology. https://doi.org/10.1111/jiec.13512
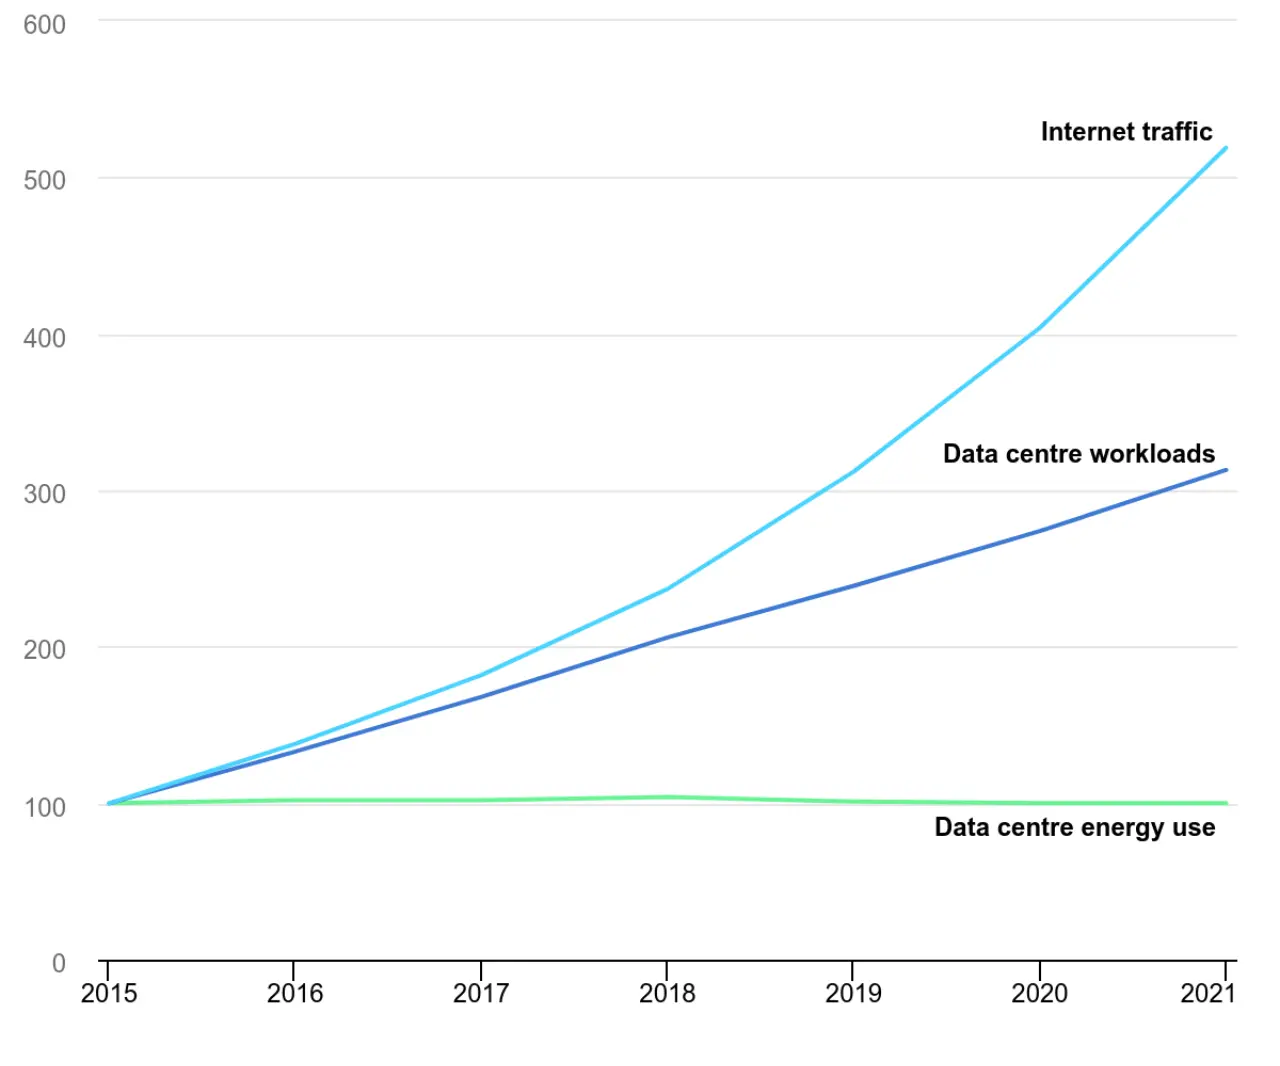
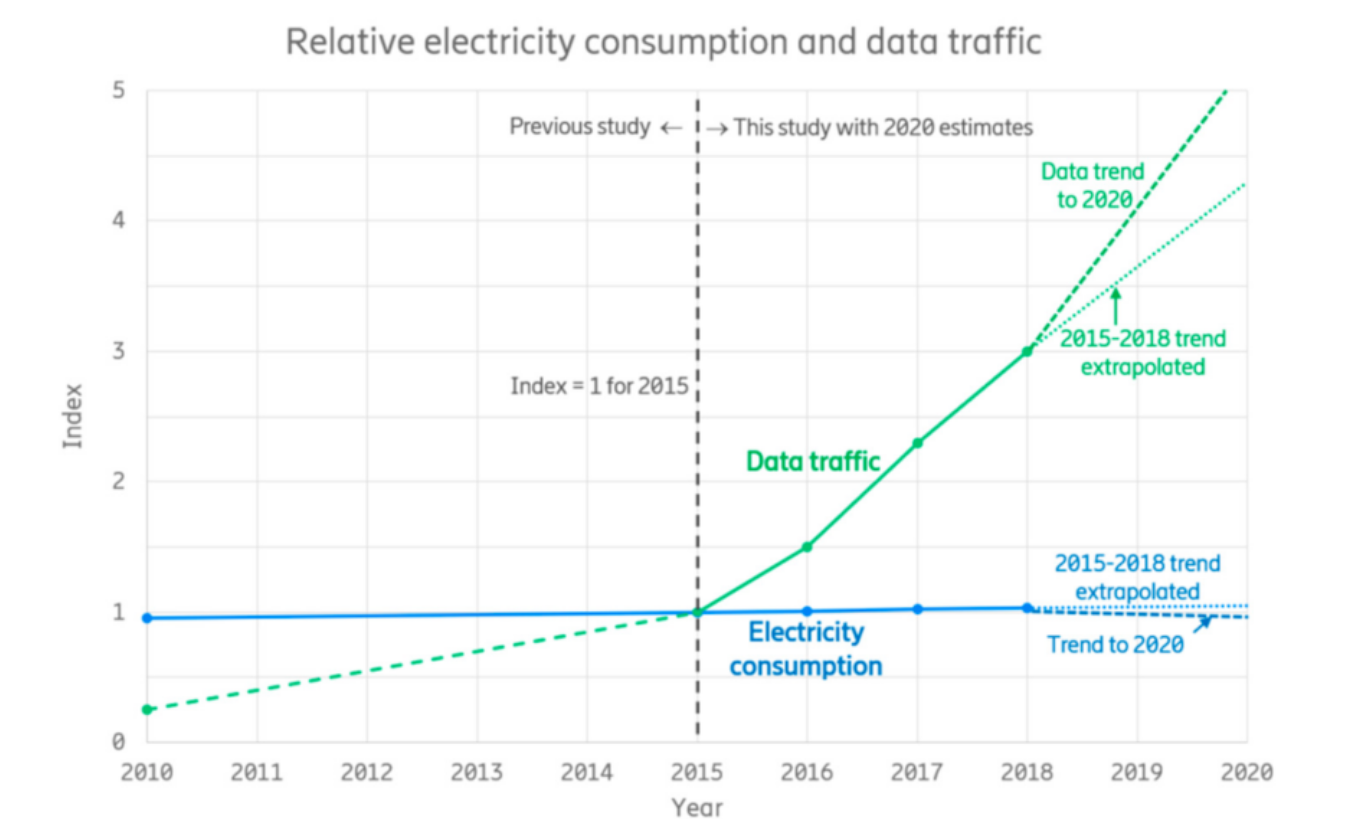
There is no correlation
IEA 2019
@Lunden.etal.2022.ElectricityConsumptionOperational
Rudolf van der Berg
Rudolf van der Berg – Misconceptions about the Internet hurt the planet
Energy consumption of the Internet (PDF)
Some examples of good studies:
- Sources of data center energy estimates: A comprehensive review, Mytton D., Ashtine M. (2022) Joule, 6 (9) , pp. 2032-2056.
- Lundén, Dag, Jens Malmodin, Pernilla Bergmark, and Nina Lövehagen. 2022. "Electricity Consumption and Operational Carbon Emissions of European Telecom Network Operators" Sustainability 14, no. 5: 2637. https://doi.org/10.3390/su14052637 → @Lunden.etal.2022.ElectricityConsumptionOperational
- The carbon footprint of streaming video: fact-checking the headlines, Kamiya, IEA, 2020 https://www.iea.org/commentaries/the-carbon-footprint-of-streaming-video-fact-checking-the-headlines
- Koot, Martijn & Wijnhoven, Fons, 2021. "Usage impact on data center electricity needs: A system dynamic forecasting model," Applied Energy, Elsevier, vol. 291(C).
Energy proportionality of networking devices
Attributional vs. Consequential Assessment
It can be useful to use a constant energy value per data transfer in an attributional context, allowing the organization to allocate responsibility of emissions to different parties. However, in a consequential context it should not be used! In other words, it should not be used as a multiplier to determine that a system's carbon footprint has been reduced simply by a reduction in its page size.
Source: https://www.techcarbonstandard.org/technology-categories/networks (Technology Carbon Standard)


