Energy Proportionality of Servers and Dynamic Range

Server Utilization

Server Utilization is often times quite low that leads to inefficient operation of IT workloads. Servers are most efficient at high utilization rates.

See also Optimize Server Utilization for Energy Efficiency and Embodied Carbon.

Intro

Principle 5: Energy proportionality - Training | Microsoft Learn

Literature / Studies

Barroso et al. (2007, 2009, 2013, 2019)

barroso.holzle.2007.caseenergyproportionalcomputing (pg. 3)

Energy proportional machines would ideally consume no power when idle (easy with inactive power modes), nearly no power when very little work is performed (harder), and gradually more power as the activity level increases (also harder).

barroso.etal.2019.datacentercomputer (pg. 127)

Although CPUs historically have a bad reputation regarding energy usage, they are not necessarily the only culprit for poor energy proportionality. Over the last few years, CPU designers have paid more attention to energy efficiency than their counterparts for other subsystems. The switch to multicore architectures instead of continuing to push for higher clock frequencies and larger levels of speculative execution is one of the reasons for this more power-efficient trend.

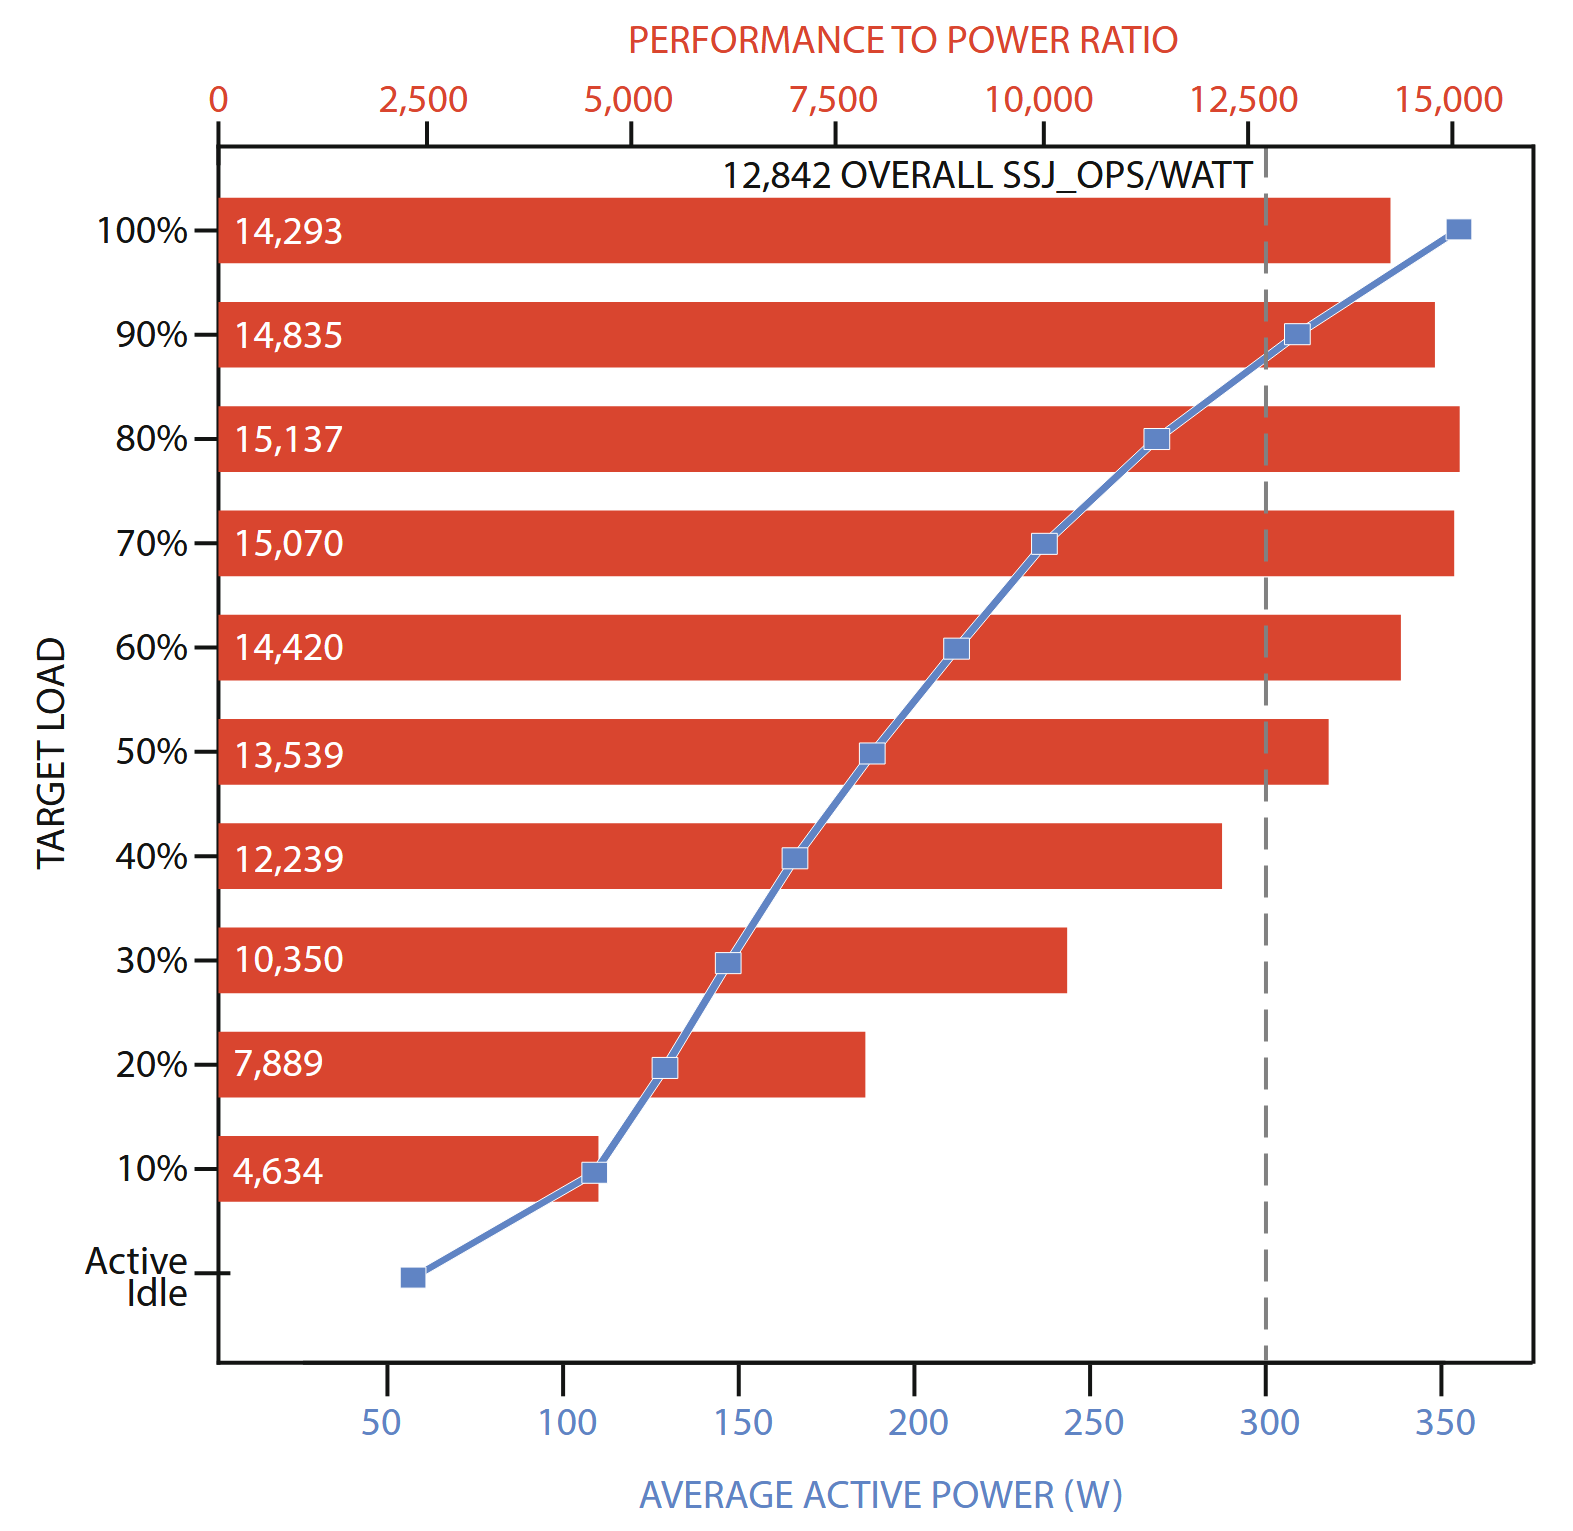
barroso.etal.2019.datacentercomputer (image) (pg. 123)

Example benchmark result for SPECpower_ssj2008; bars indicate energy efficiency and the line indicates power consumption. Both are plotted for a range of utilization levels, with the average energy efficiency metric corresponding to the vertical dark line. The system has two 2.1 GHz 28core Intel Xeon processors, 192 GB of DRAM, and one M.2 SATA SSD.

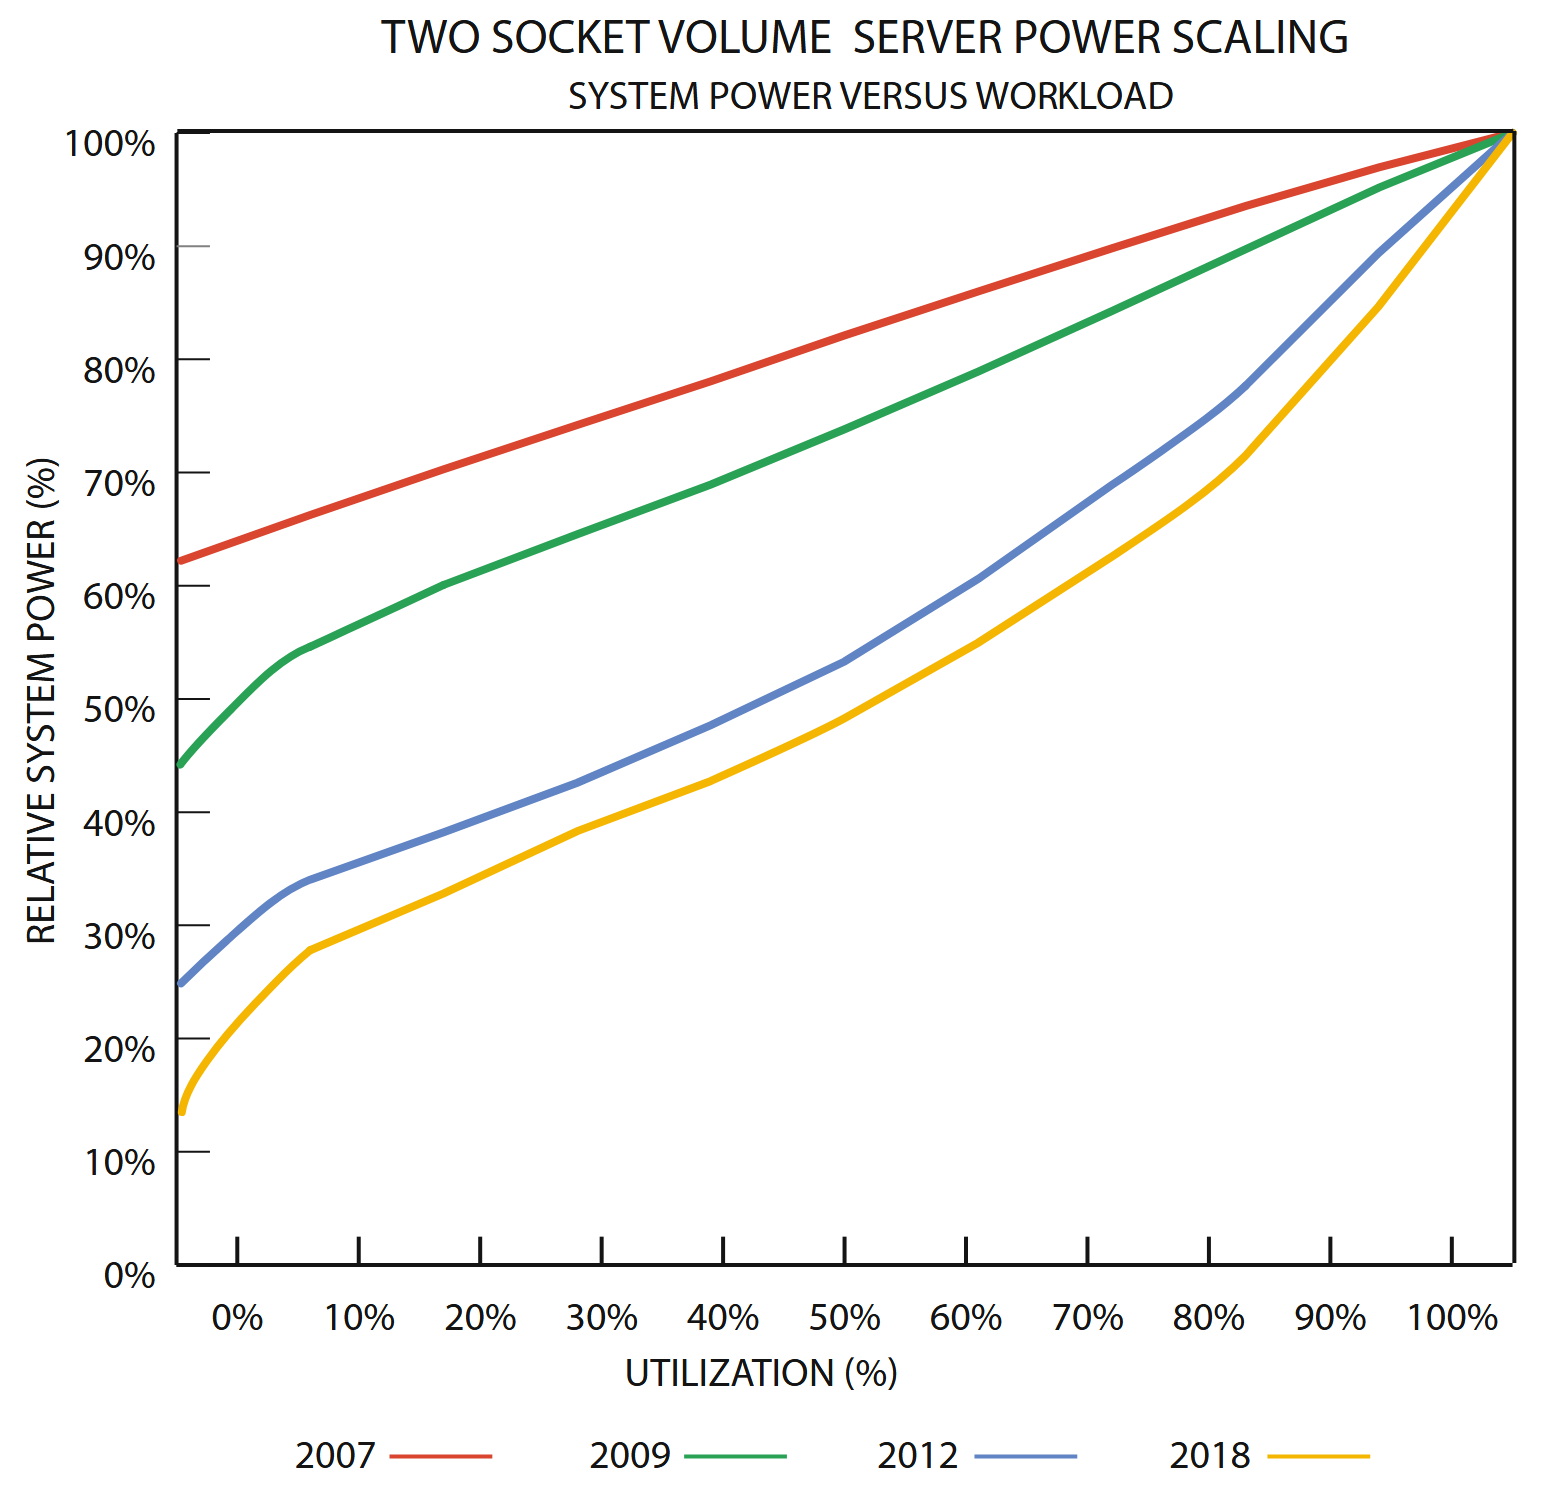
barroso.etal.2019.datacentercomputer (image) (pg. 129)

Figure 5.8: Normalized system power vs. utilization in Intel servers from 2007–2018 (courtesy of David Lo, Google). The chart indicates that Intel servers have become more energy proportional in the 12-year period.

Shehabi et al. (2016)

shehabi.etal.2016.unitedstatesdata (pg. 21)

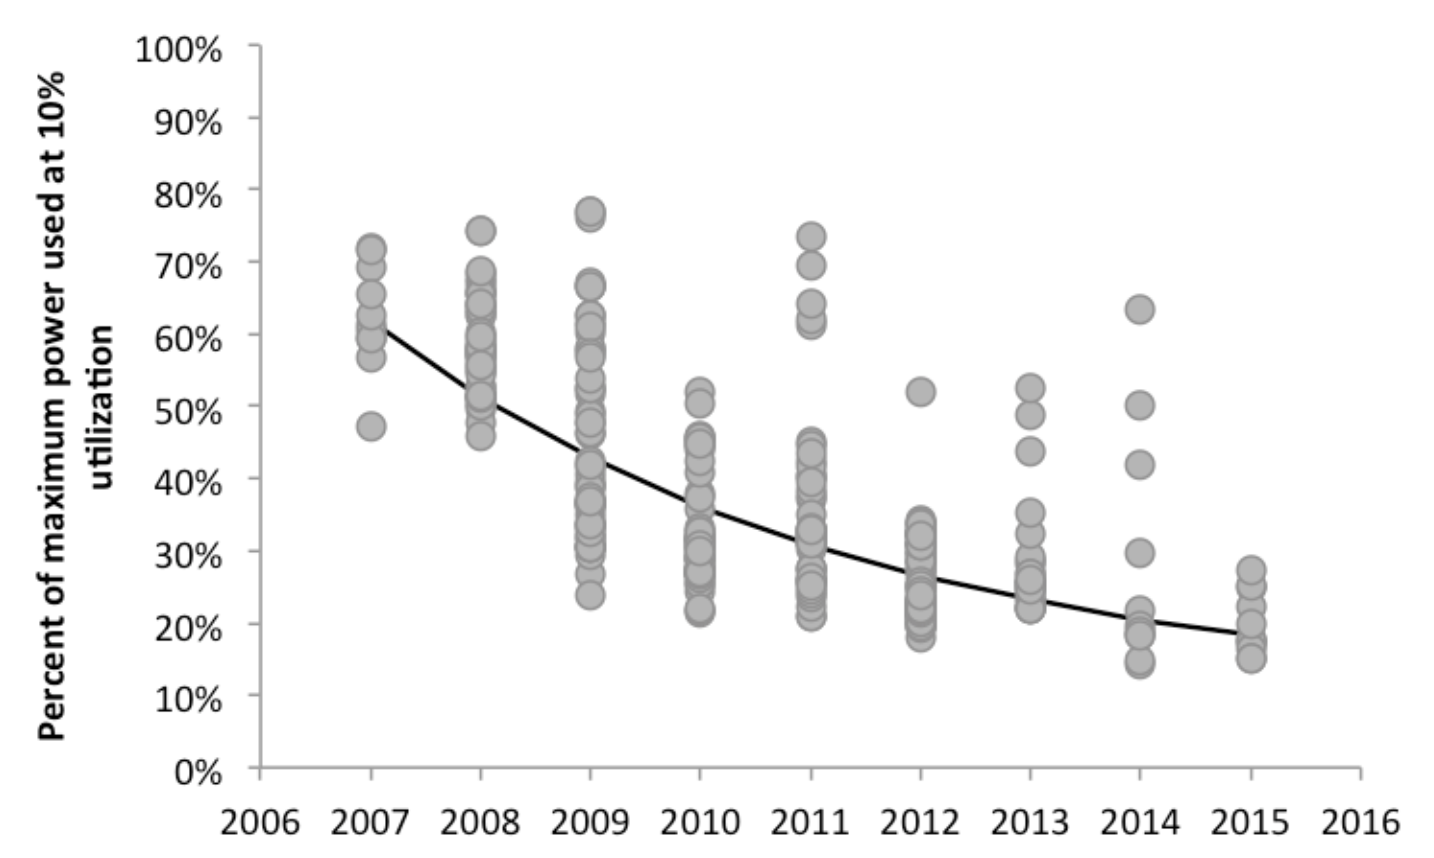
The amount of power consumed at average utilization is dependent on how closely servers come to achieving power-proportionality, where power consumption scales directly with utilization. In other words, perfect power-proportionality would mean that a server would only use 10% of maximum power when run at 10% utilization.

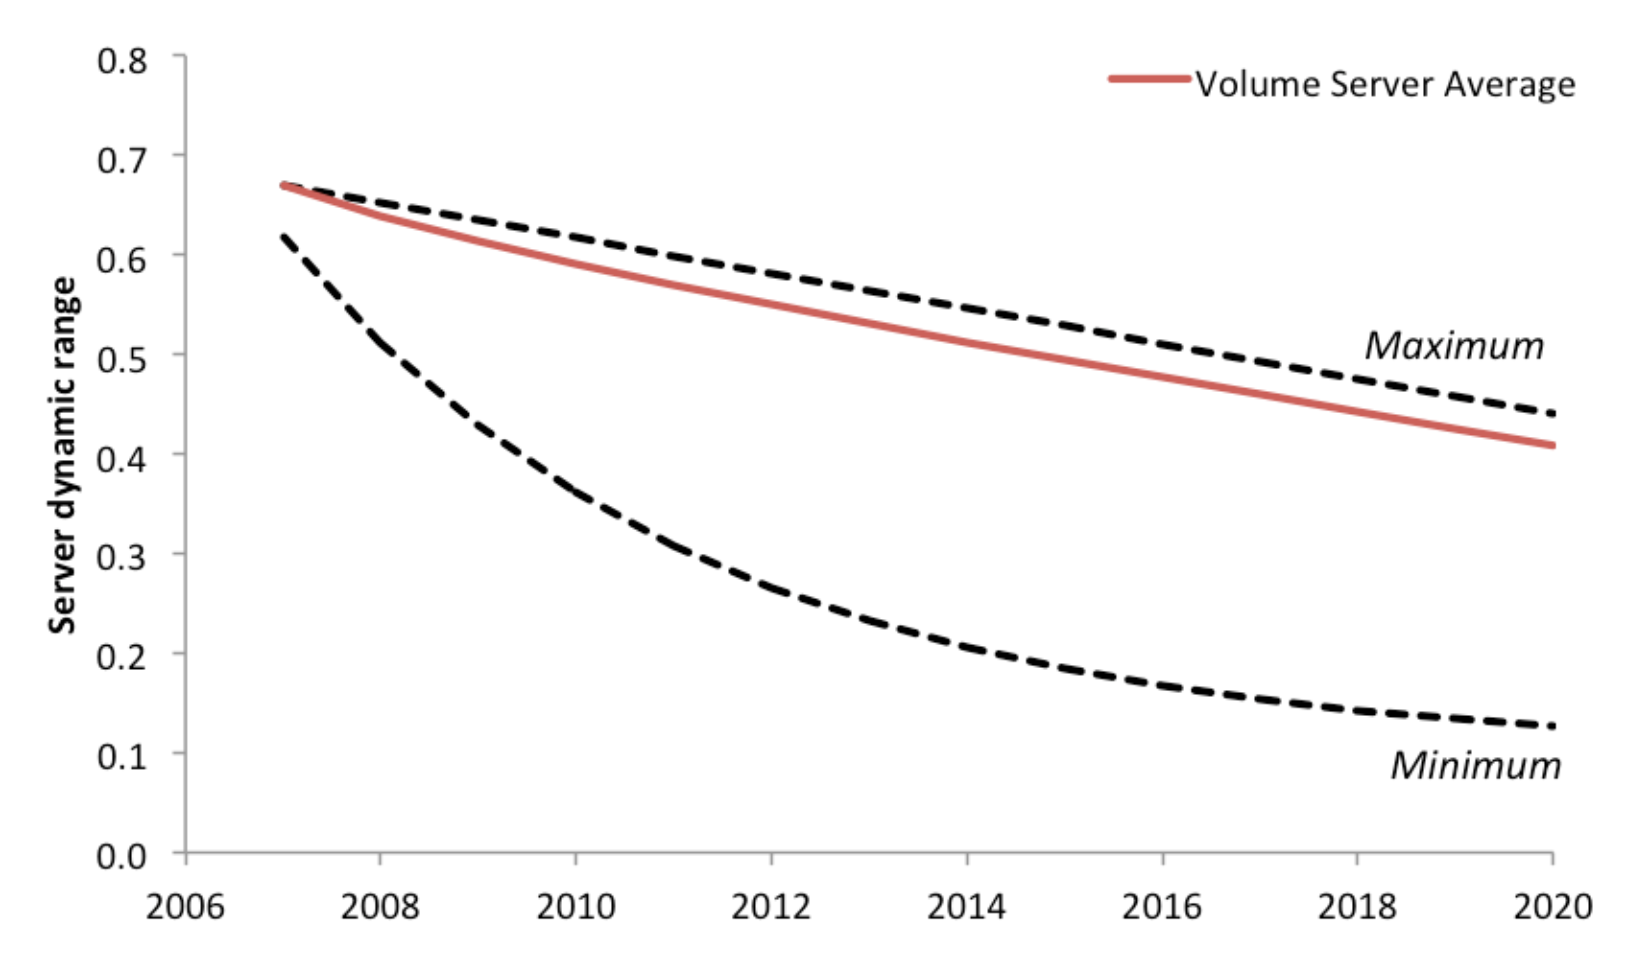
shehabi.etal.2016.unitedstatesdata (pg. 21)

One metric used to quantify this behavior is the dynamic range (DR), which is the ratio between the lowest power level (idle power) and the maximum power.

Dynamic Energy Optimal

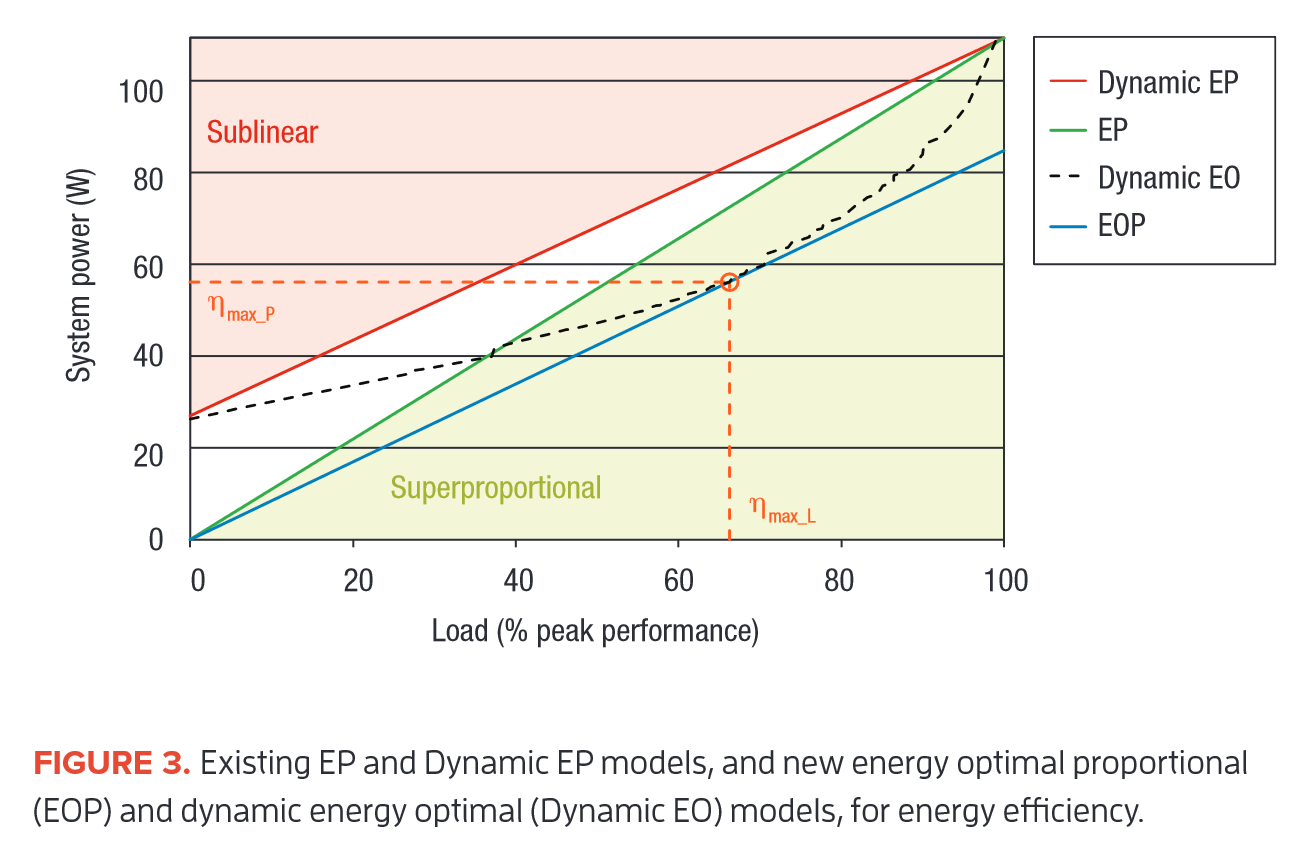
Modern CPUs have reconfigurable resources at runtime. 'Therefore, the original energy proportionality model by Barroso and Hölzle is not the perfect goal anymore.

sen.wood.2017.energyproportionalcomputingnew (pg. 1)

Barroso and Hölzle’s observation has been instrumental in driving the recent design of systems with lower idle power and a wide dynamic power range. However, their model describes systems with fixed resources, while these more efficient modern processors have reconfigurable resources—core frequencies, voltages, number of active cores, threads per core, and so on—that can be varied at runtime.

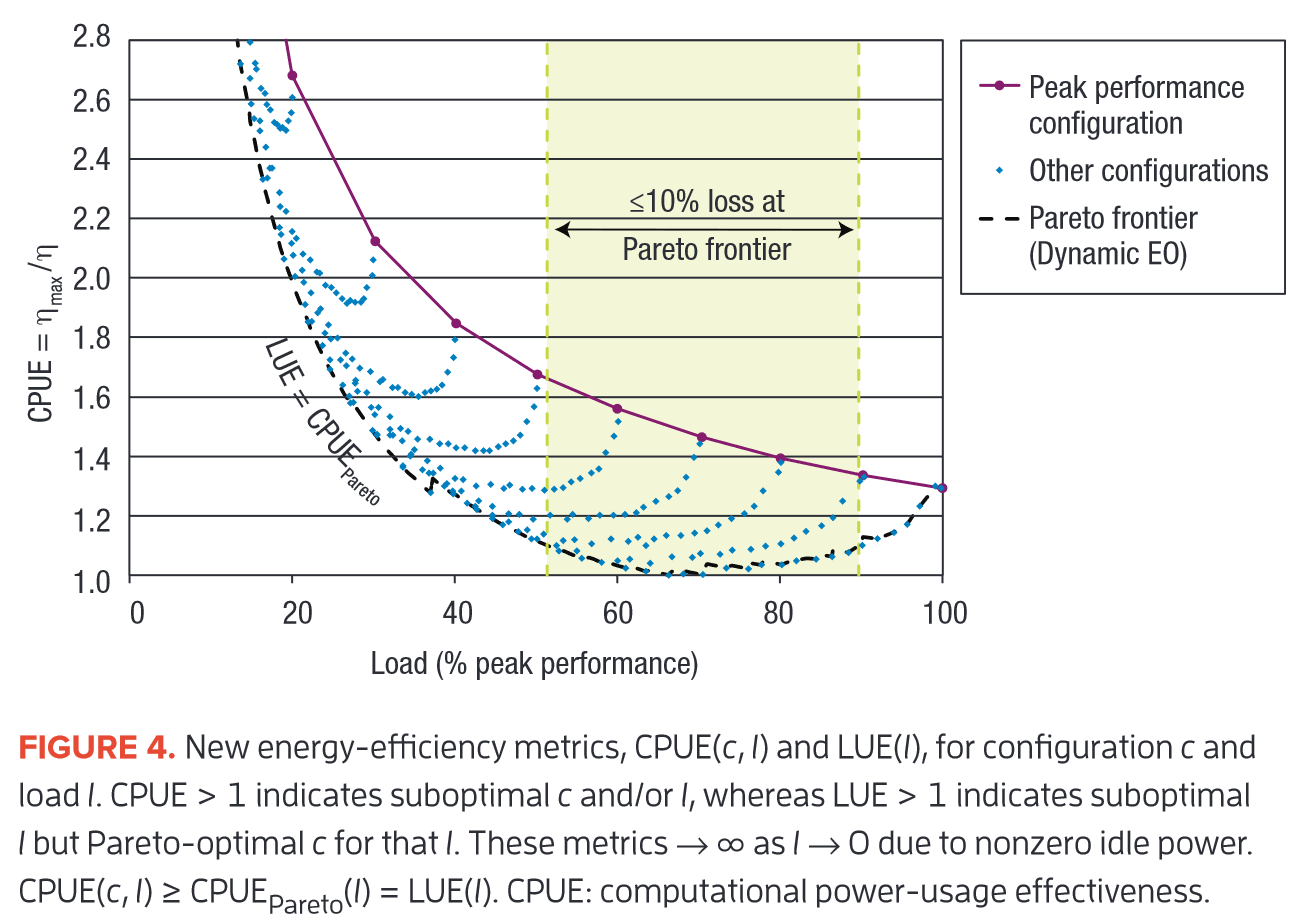
Sen & Wood propose a new model called dynamic energy optimal and a new metric called computational power-usage effectiveness (CPUE):

sen.wood.2017.energyproportionalcomputingnew (pg. 3)

We call this model dynamic energy optimal (Dynamic EO). Like Dynamic EP, it is an operational ideal that seeks to characterize the best energy efficiency a given system can achieve. But it differs from Dynamic EP in two aspects: it characterizes optimality that can already be realized by some among the multitude of configurations in the current system, and it does not assume linearity of the powerperformance profile. Figure 3 illustrates the different models.

sen.wood.2017.energyproportionalcomputingnew (pg. 5)

Figure 4 shows that CPUE for the peak-performance configuration is always >1 (wastes energy) and increases as load decreases. The best CPUE for this configuration is 1.29, occurs at peak load, and implies 29 percent excess energy used relative to Emin. LUE (that is, CPUE for Dynamic EO), on the other hand, first decreases to 1 and then increases, revealing a sweet spot of ≤10 percent excess energy used at around 51–90 percent of peak performance.

→ With an optimal configuration modern processors achieve the best energy efficiency with a load of around 51-90 percent.