Digital-related greenhouse gas (GHG) emissions are 1.8 billion tonnes of CO2 eq. Thus, on the indicator concerning the potential for global warming, global digital technology is equivalent to about 3 times the emissions of South Korea, more than 2 times those of Canada or Saudi Arabia, or about 5.5 times those of France.
In 2023, global digital technology accounts for 3.4% of global GHG emissions. Between 2019 and 2023, global GHG emissions across all sectors increased by more than 1.9%.
The most prominent publications on this topic are Andrae and Edler [2], which is known to be outdated and superseded by Andrae [1], Malmodin and Lundén [32], and Belkhir and Elmeligi [4]. While they are based on the same breakdown of ICT equipment into data centers, telecommunication networks, and end-user devices, these studies have different perimeters. By unifying the scopes considered in Refs. [2,32,4], Freitag et al. [15] argue that GHG emissions from the ICT sector ranged from 2.1% to 3.9% of global emissions in 2020 (1.2–2.2 GtCO2e).
roussilhe.etal.2023.longroadahead (pg. 5)
While ICT is at the core of most critical infrastructures and human activities, the role it can play to mitigate GHG emissions remains unclear. More research is needed to identify under which multifaceted conditions (taking into account territorial specificities) a digital solution can have positive effects, and under which it has negative effects, meaning it is better not to deploy it or even to ‘un-digitize’ it depending on the situation. Last but not least, one should acknowledge that our times require urgent action and that answers to many questions raised in this paper may not get scientifically sound answers quickly enough. One crucial question that remains is then: what do we need to know to make decisions?
ICT sector used about 4% of the global electricity in the use stage and represented about 1.4% of the global GHG emissions in 2020 [43]- [44]. This shows that the ICT sector has developed in line with the rest of the world as the percentage of the total carbon footprint are at about the same level as in 2015, while the use stage electricity increased somewhat.
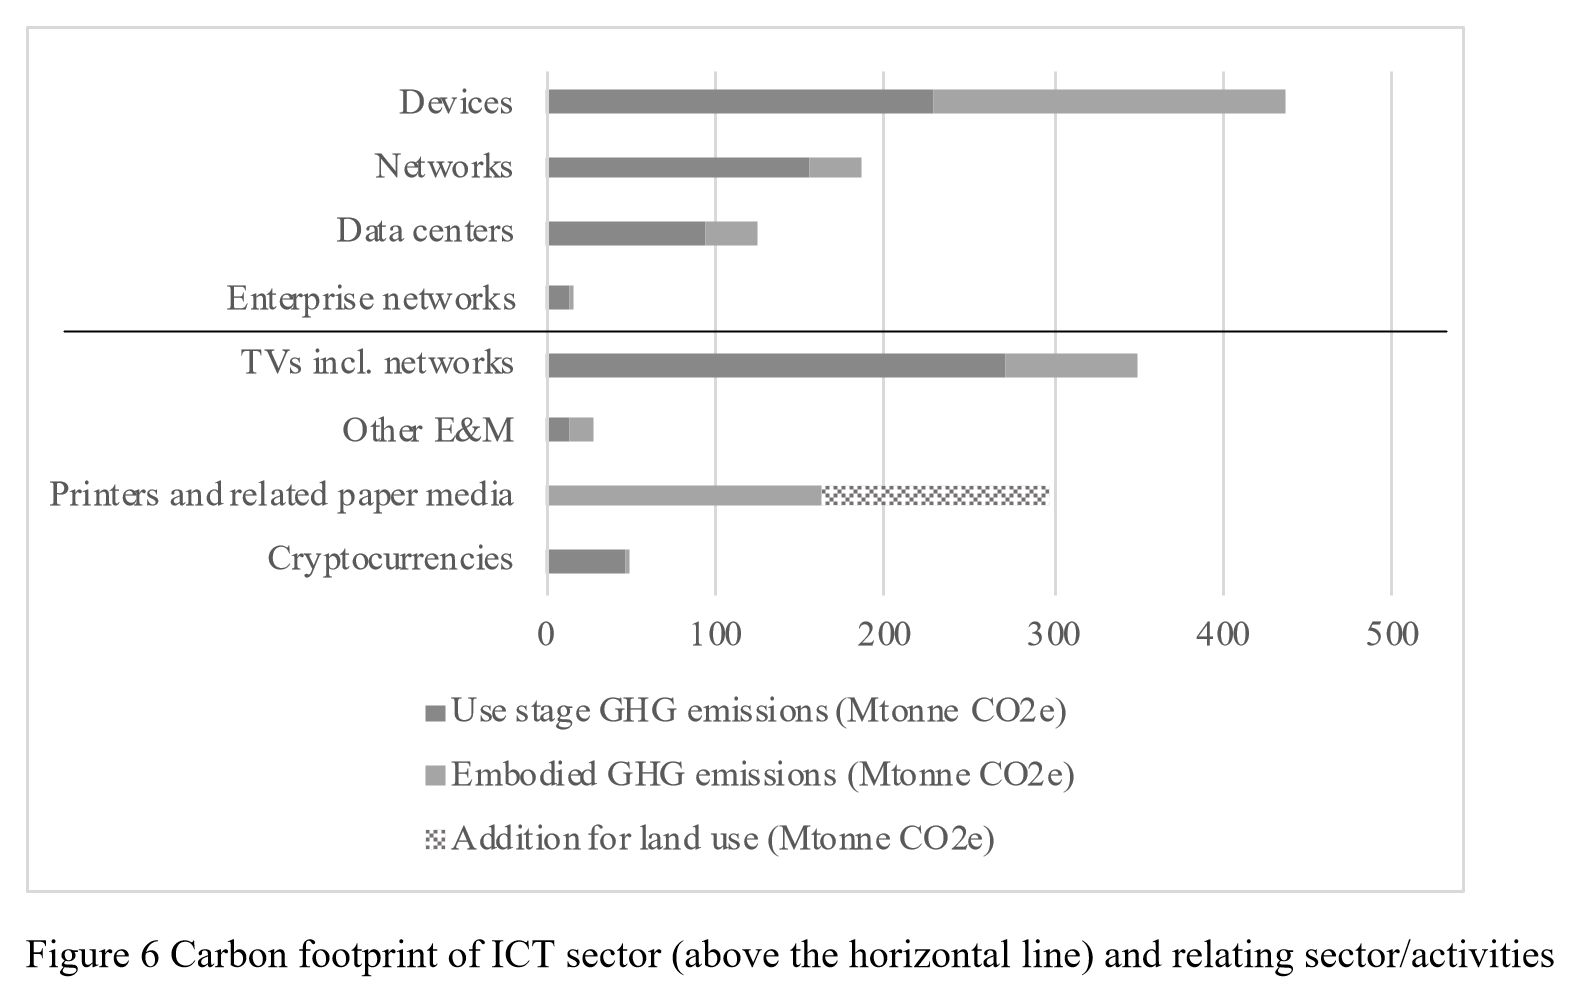
The production of end-user devices causes the most GHG emissions and may increase in future, in particular due to the GHG-intensive production and the growing number of devices.
The carbon footprint for ICT, including TVs and other consumer electronics, rises to 1.2–2.2 GtCO2e (2.1%–3.9% of global GHG emissions) in 2020 with ca. 30% coming from embodied emissions and 70% from use phase emissions.
In 2018, we estimated that global data center energy use rose to 205 TWh, or around 1% of global electricity consumption. This represents a 6% increase compared with 2010, whereas global data center compute instances increased by 550% over the same time period.
Belkhir, L., & Elmeligi, A. (2018)
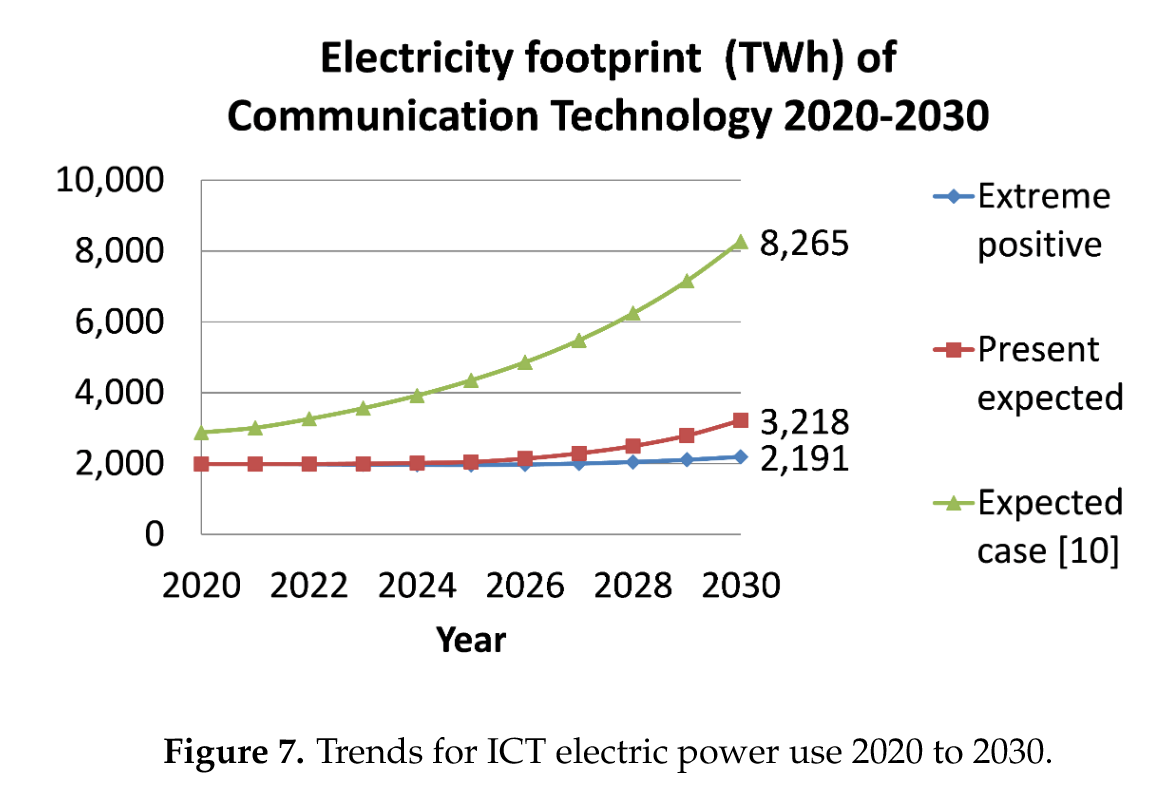
ICT could contribute to 14 % of the worldwide GHG emissions by 2040
Belkhir, L., & Elmeligi, A. (2018). Assessing ICT global emissions footprint: Trends to 2040 & recommendations. Journal of Cleaner Production, 177, 448–463. https://doi.org/10.1016/j.jclepro.2017.12.239