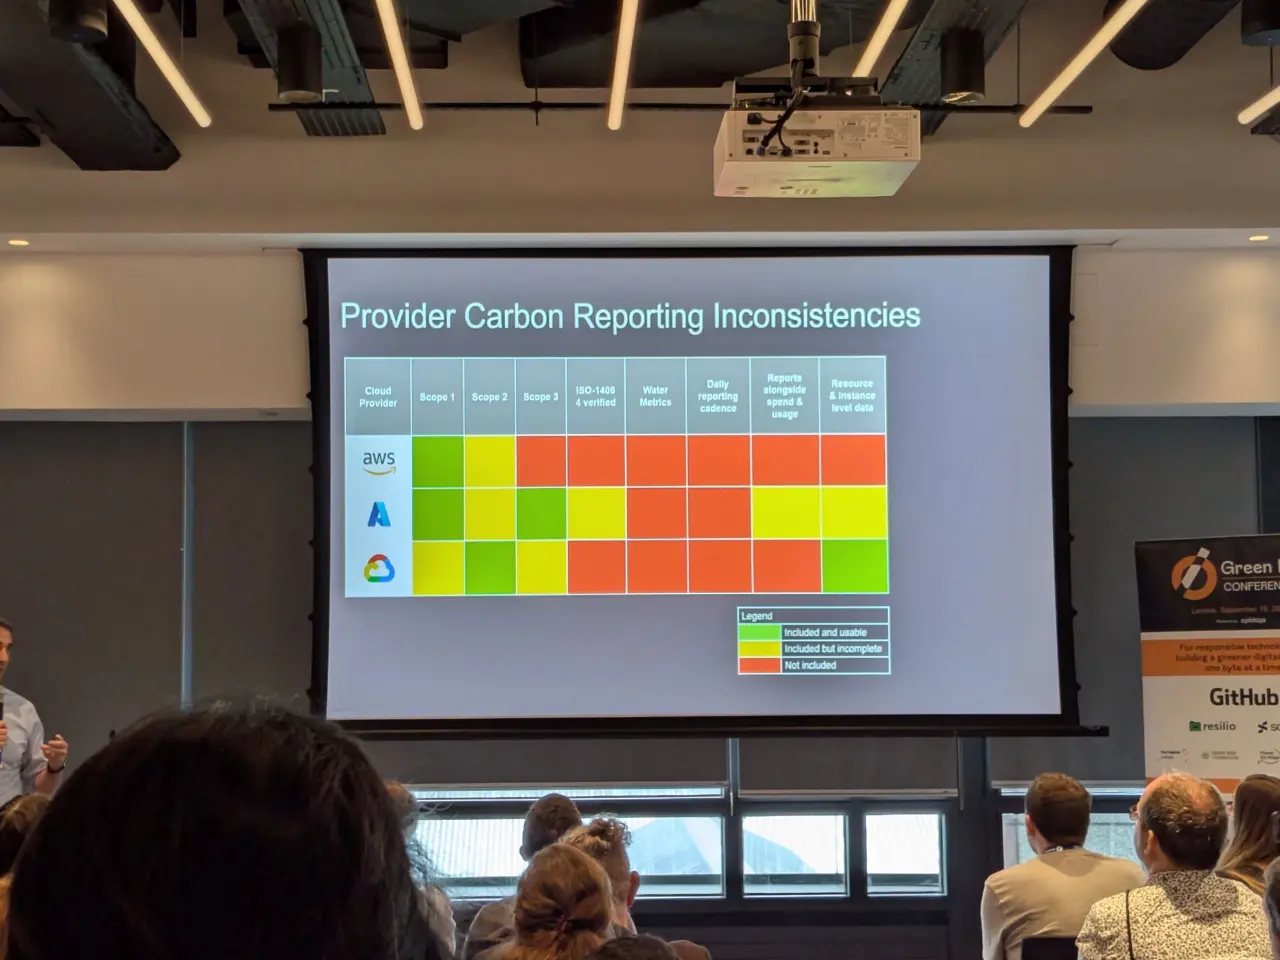
Cloud Carbon Dashboards & APIs
To have a more sustainable cloud, more transparency is required. The big cloud providers all provide carbon dashboards so the customers are able to see their own carbon emissions.
But how good are they actually? What methodology is used? What to use in a multi-cloud environment?
Related to: Estimate carbon emissions of cloud applications
Measuring for reporting is different than measuring for action!
Currently, the cloud providers only provide data for reporting!
Overview
| Provider | GHG Scopes Covered | Interface | Latency | Granularity | Location vs market based accounting |
|---|---|---|---|---|---|
| AWS | 1,2 | Dashboard | Monthly (with 3 month delay) |
Coarse - EC2 and S3 are listed individually, all other services grouped as one figure. Location breakdown by continent, not per region Rounds down figures to the nearest 0.1 tCO2e |
Market-based |
| Azure | 1,2,3 | Power BI | Monthly | Fine grained | Market-based |
| GCP | 1,2,3 | Dashboard | Monthly | Fine grained | Location-based |
Source: https://www.techcarbonstandard.org/information/cloud#quantifying-the-emissions-of-cloud-services
Source: LinkedIn, Green IO Conference London 2024, Presentation by Mark Butcher
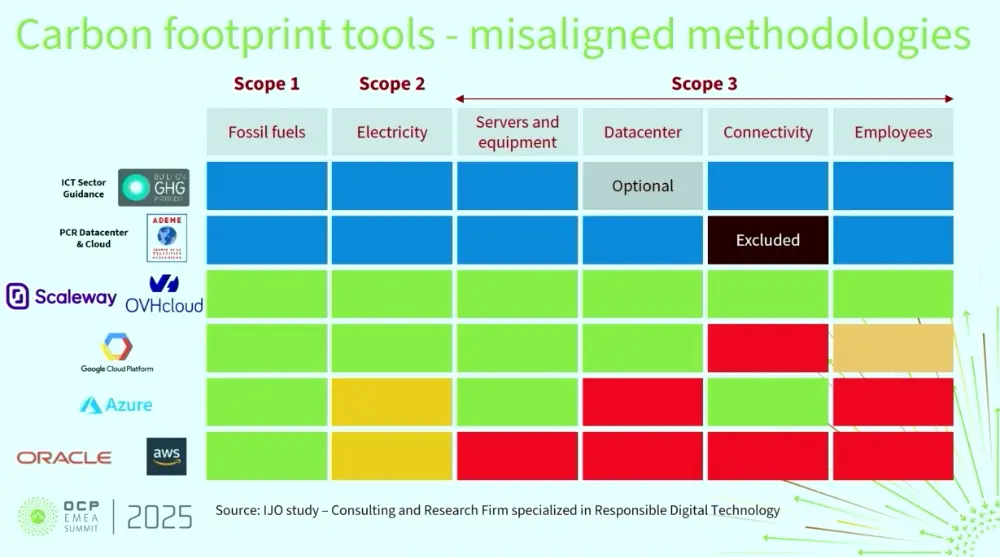
Source: 2025 OCP EMEA Keynote - Cloud Services Environmental Impact Assessment Tools (OVH) - YouTube
Other overview articles:
- Understanding the results of cloud providers' carbon calculators | Boavizta
- Cloudy with a chance of hidden emissions | Carbon4
AWS: Customer Carbon Footprint Tool
Purpose: Dashboard for the carbon emissions of your AWS usage
Website: https://aws.amazon.com/aws-cost-management/aws-customer-carbon-footprint-tool/
Costs? free of charge
Update cycle? 3 months ("New data is available monthly, with a delay of three months")
Open source? ✖
Methodology (v2): https://sustainability.aboutamazon.com/aws-customer-carbon-footprint-tool-methodology.pdf
GHG scopes: only 1 & 2
What data is included?
- Scope 1:
- Fossil fuels combusted onsite? ⚠ methodology unknown
- Fugitive emissions from cooling systems? ⚠ methodology unknown
- Scope 2:
- Real energy usage data of machines? ❌
- load (MWh) is estimated at cluster-month level
- Location-based carbon emissions of used electricity? ❌
- market-based method is used: renewable renewable energy purchases are factored in
- location-based emission factors may only be used as fallback within the market-based method
- Real energy usage data of machines? ❌
- Scope 3: ❌
- Energy use and emissions from data flows over the internet? ❌
- Embedded emissions of data center equipment? ❌
- Transportation of IT equipment to data center? ❌
- Embedded emissions of data center facilities? ❌
- Data center employee commuting and business travel? ❌
- End-of-life disposal of IT equipment? ❌
Allocation:
- Top-down approach (total carbon emissions of AWS are broken down)
- usage-based allocation is prioritized and equivalent revenue allocation is used as a fallback (e.g. with non-foundational services → AWS services with no dedicated racks)
Updates:
Azure: Emissions Impact Dashboard for Azure
Purpose: Dashboard for the carbon emissions of your Azure and Microsoft 365 usage
Website: https://www.microsoft.com/en-us/sustainability/emissions-impact-dashboard
Costs? ~10 € per user
Update cycle? 14 days after the end of a month
Open source? ✖
GHG scopes: 1, 2 & 3
What data is included?
- Scope 1:
- Fossil fuels combusted onsite? ✔
- Fugitive emissions from cooling systems? ✔
- Scope 2:
- Real energy usage data of machines? ⚠ expected power consumption for equipment at different utilization rates is calculated based on equipment specifications
- Location-based carbon emissions of used electricity? ⚠ purchased renewable electricity is used (> 95 %); a location-based reporting method like Google does is would be better
- Scope 3:
- Energy use and emissions from data flows over the internet? ✔estimated by using the kWh/gigabyte (GB) from @Aslan.etal.2018.ElectricityIntensityInternet
- Embedded emissions of data center equipment? ✔ 6-year timeframe, negligible impact of cooling and air conditioning equipment is excluded
- Transportation of IT equipment to data center? ✔
- Embedded emissions of data center facilities? ❌ not yet
- Data center employee commuting and business travel? ❌
- End-of-life disposal of IT equipment? ✔ recycling rate of 20 % is assumed
Sources:
- Microsoft Cloud for Sustainability API calculation methodology
- The carbon benefits of cloud computing: A study on the Microsoft Cloud in partnership with WSP (2020, PDF)
- A new approach for Scope 3 emissions transparency (PDF, 2021)
How to use?
→Connect to the Emissions Impact Dashboard for Azure
Azure: Cloud for Sustainability API
Purpose: Provides APIs to access emissions data related to your Azure and Microsoft 365 usage
Website: https://learn.microsoft.com/en-us/industry/sustainability/api-overview
Costs? currently (as of 2024-01-26) in preview
Update cycle? 14 days after the end of a month
Open source? ✖
GHG scopes: 1, 2 & 3
What data is included?
See above, same cloud emissions tracking is used as for the Emissions Impact Dashboard for Azure.
How to use it?
Google: Carbon Footprint
Purpose: Dashboard for the carbon emissions of your Google Cloud usage
Website: https://cloud.google.com/carbon-footprint
Costs? free of charge
Update cycle? ~3 weeks
Open source? ✖
GHG scopes: 1, 2 & 3
What data is included?
- Scope 1:
- Fossil fuels combusted onsite? ✔
- Fugitive emissions from cooling systems? ❌
- Scope 2:
- Real energy usage data of machines? ✔ on a hourly-basis
- Location-based carbon emissions of used electricity? ✔ location-based reporting method is used, using data from Electricity Maps (renewable power purchase agreements are not taken into account, that's good!)
- Scope 3:
- Energy use and emissions from data flows over the internet? ❌
- Embedded emissions of data center equipment? ✔ 4-year timeframe
- Transportation of IT equipment to data center? ✔
- Embedded emissions of data center facilities? ✔ 20-year timeframe
- Data center employee commuting and business travel? ✔
- End-of-life disposal of IT equipment? ❌
Google Carbon Footprint uses real energy usage data, location-based carbon emissions from electricity, and allocates them across customers and products, augmenting with proportional allocations of emissions from non-electricity sources. The machine energy usage is allocated to internal services by evaluating dynamic power (energy used during workload) and idle power separately. The hourly dynamic power is assigned to internal services based on relative CPU usage, while idle power is allocated based on resource allocation. Overhead energy consumption, such as power systems, cooling and lighting, is also included. Energy usage for shared infrastructure services is reallocated based on relative usage or internal cost of service where data is insufficient.
Source: @Google.2024.CarbonFootprintReporting
Cloud Carbon Footprint
Purpose: Provide the estimated carbon footprint of your cloud usage, supporting AWS, Azure, GCP
Website: https://www.cloudcarbonfootprint.org/
Costs? free of charge
Update cycle? ❔
Open source? ✔
GHG scopes: 1, 2 & 3 (partly)
What data is included? (→methodology)
- Scope 1 & 2 emissions are estimated mainly by using data provided from the cloud providers billing APIs
- Energy usage is estimated using Etsy's "Cloud Jewels" methodology: determining energy coefficients for compute and storage usage
- Embodied emissions (scope 3) are estimated based on the SCI Specification for compute usage types
- …
OVHcloud Environmental Impact Assessment
2025 OCP EMEA Keynote - Cloud Services Environmental Impact Assessment Tools (OVH) - YouTube
Methodology: https://corporate.ovhcloud.com/sites/default/files/2024-01/methodo_carboncalc_0.pdf
Scaleway Environmental Calculator
Environmental Footprint Documentation | Scaleway Documentation