Carbon Footprint of ICT Devices
Theoretical aspects, data sources and references: LCA of Electronic Devices
The embodied carbon of a device is an important aspect of the whole carbon footprint. The ratio between emissions from use and production varies greatly depending on the type of device.
The smaller the device, the larger the relative amount of embodied carbon (for a smartphone, it's about 85%).
Global share of embodied carbon
Freitag et al. (2021): 30 %
Andrae (2020): 20 %
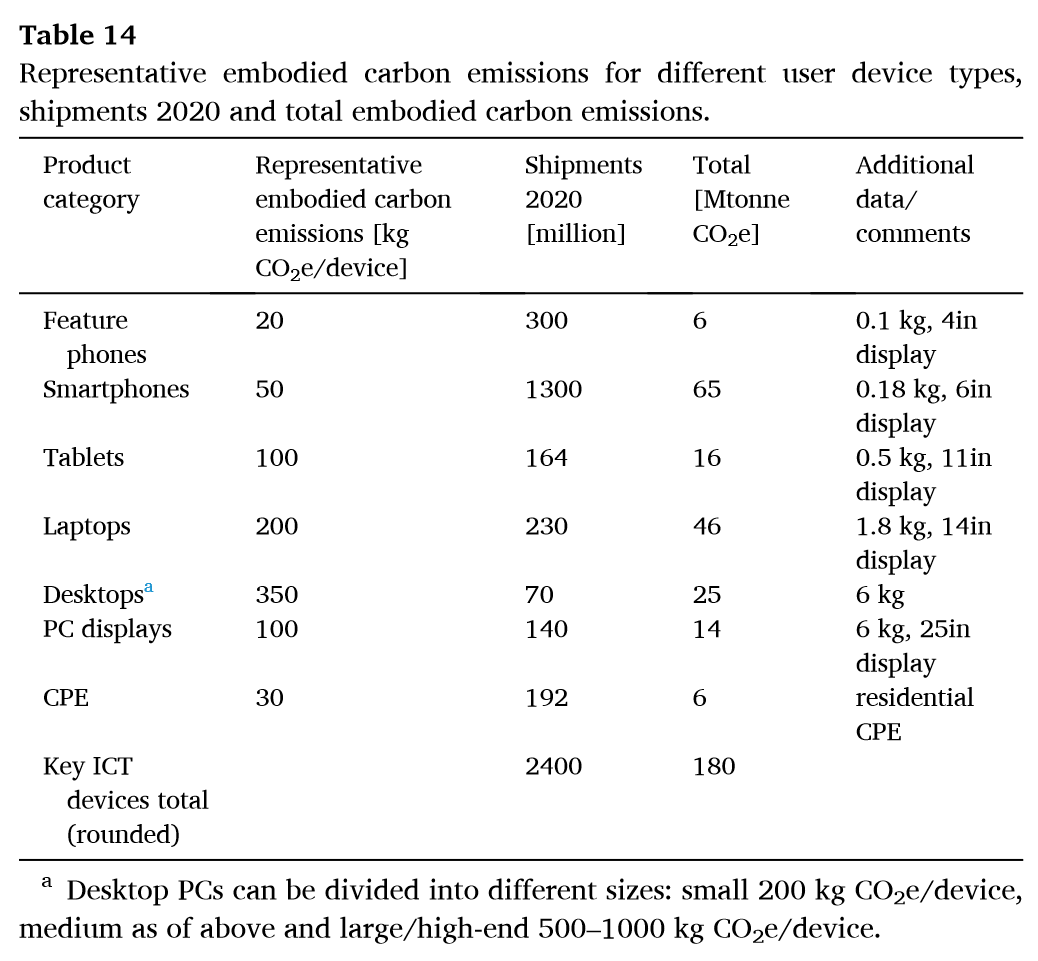
@Lovehagen.etal.2023.AssessingEmbodiedCarbon: 180 Mt CO2e
Usage vs. Embodied Carbon Emissions
Technology Carbon Standard
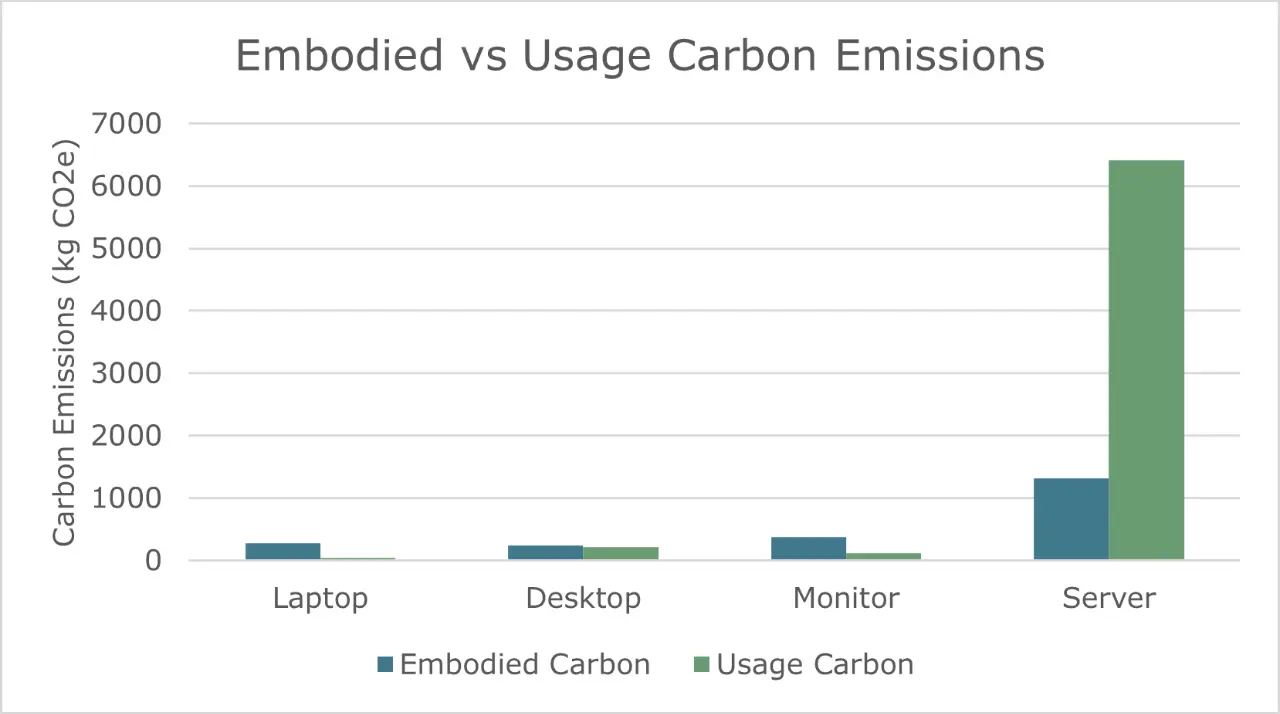
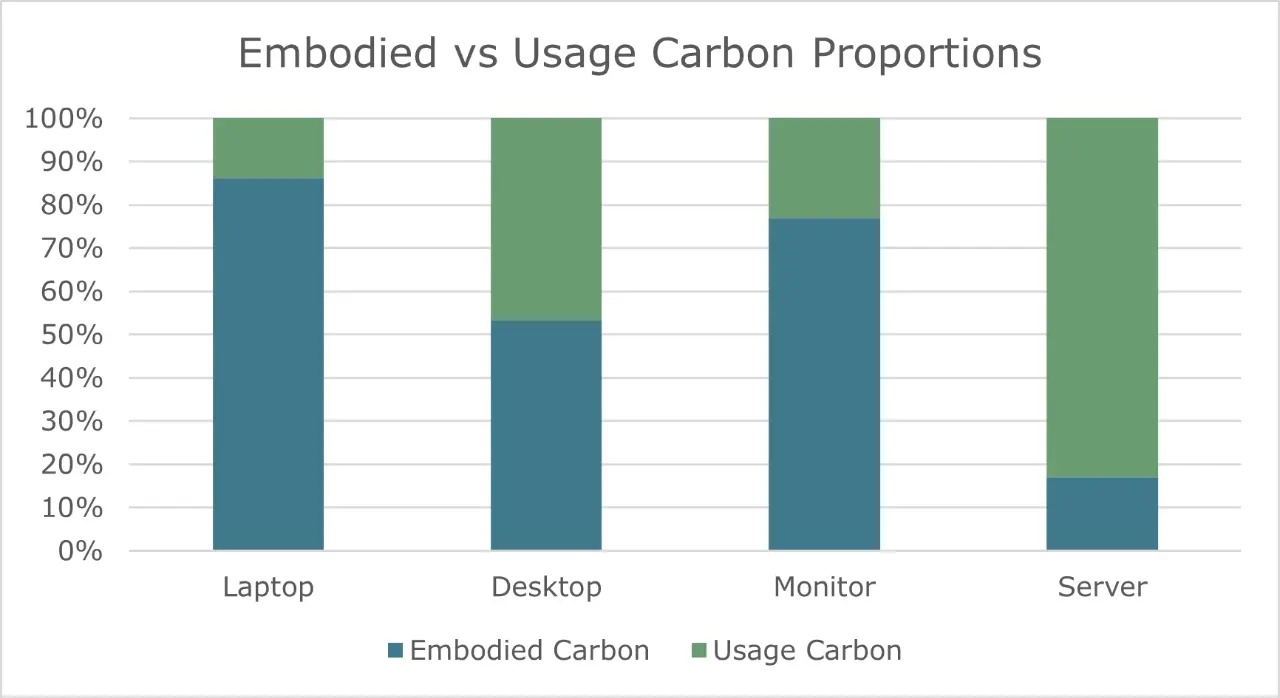
For devices such as laptops, embodied carbon typically accounts for around 80% of the total life cycle emissions, while usage emissions make up only 20%. In contrast, for servers, the breakdown can be reversed, with embodied carbon constituting around 20% and usage emissions around 80% of the total. These proportions can fluctuate depending on the specific device model. Desktops tend to have a higher proportion of usage emissions compared to other user devices like laptops or smartphones.
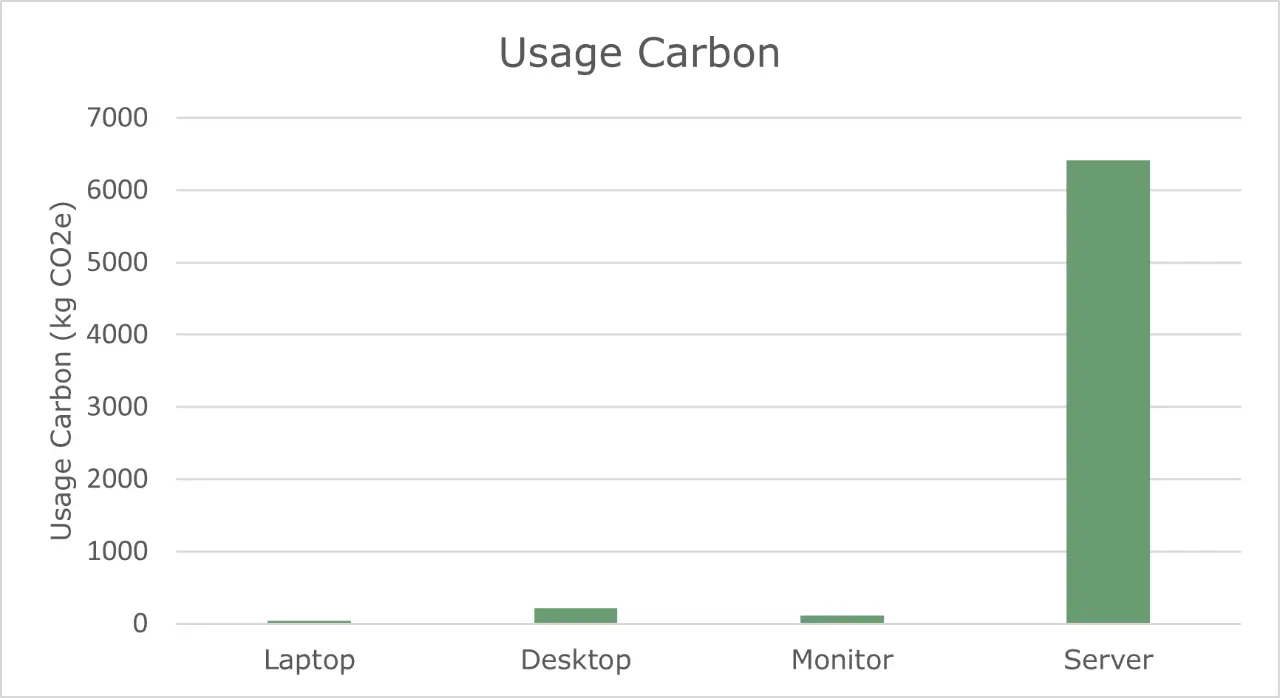
Servers can be associated with high usage emissions compared to devices like laptops or smartphones. This is largely due to higher power consumption associated with more powerful processors, large amounts of RAM, and multiple hard drives to store and process data, as well as more continuous usage patterns. Typically, server usage carbon emissions contribute the larger portion of their overall carbon footprint.
Sources: Dell Product Carbon Footprint (PCF) documents of example models
@Gupta.etal.2022.ChasingCarbon
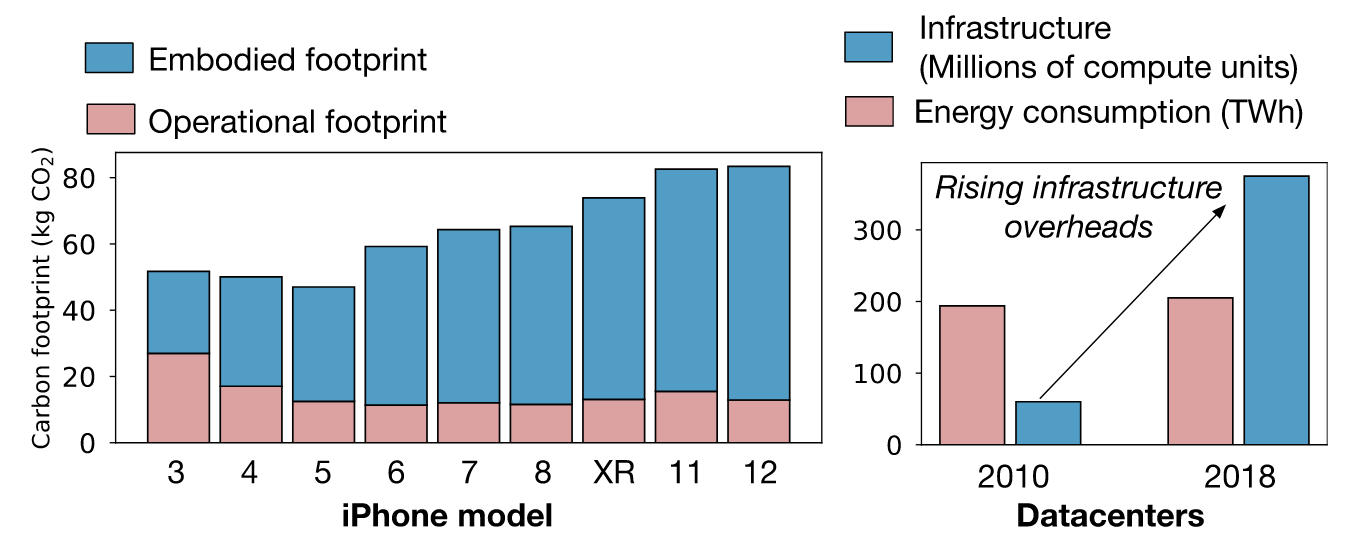
FIGURE 1. Majority of computing’s carbon footprint comes from embodied emissions not operational energy use. From iPhone 3 to iPhone 12, the operational footprint reduced by 2.09 given efficiency optimizations while the embodied emissions rose by 2.85 due to higher manufacturing overheads. Between 2010 and 2018, the operational energy consumption of data centers increased by only 6% collectively while the number of compute instances, i.e., infrastructure overheads, increased by 6.
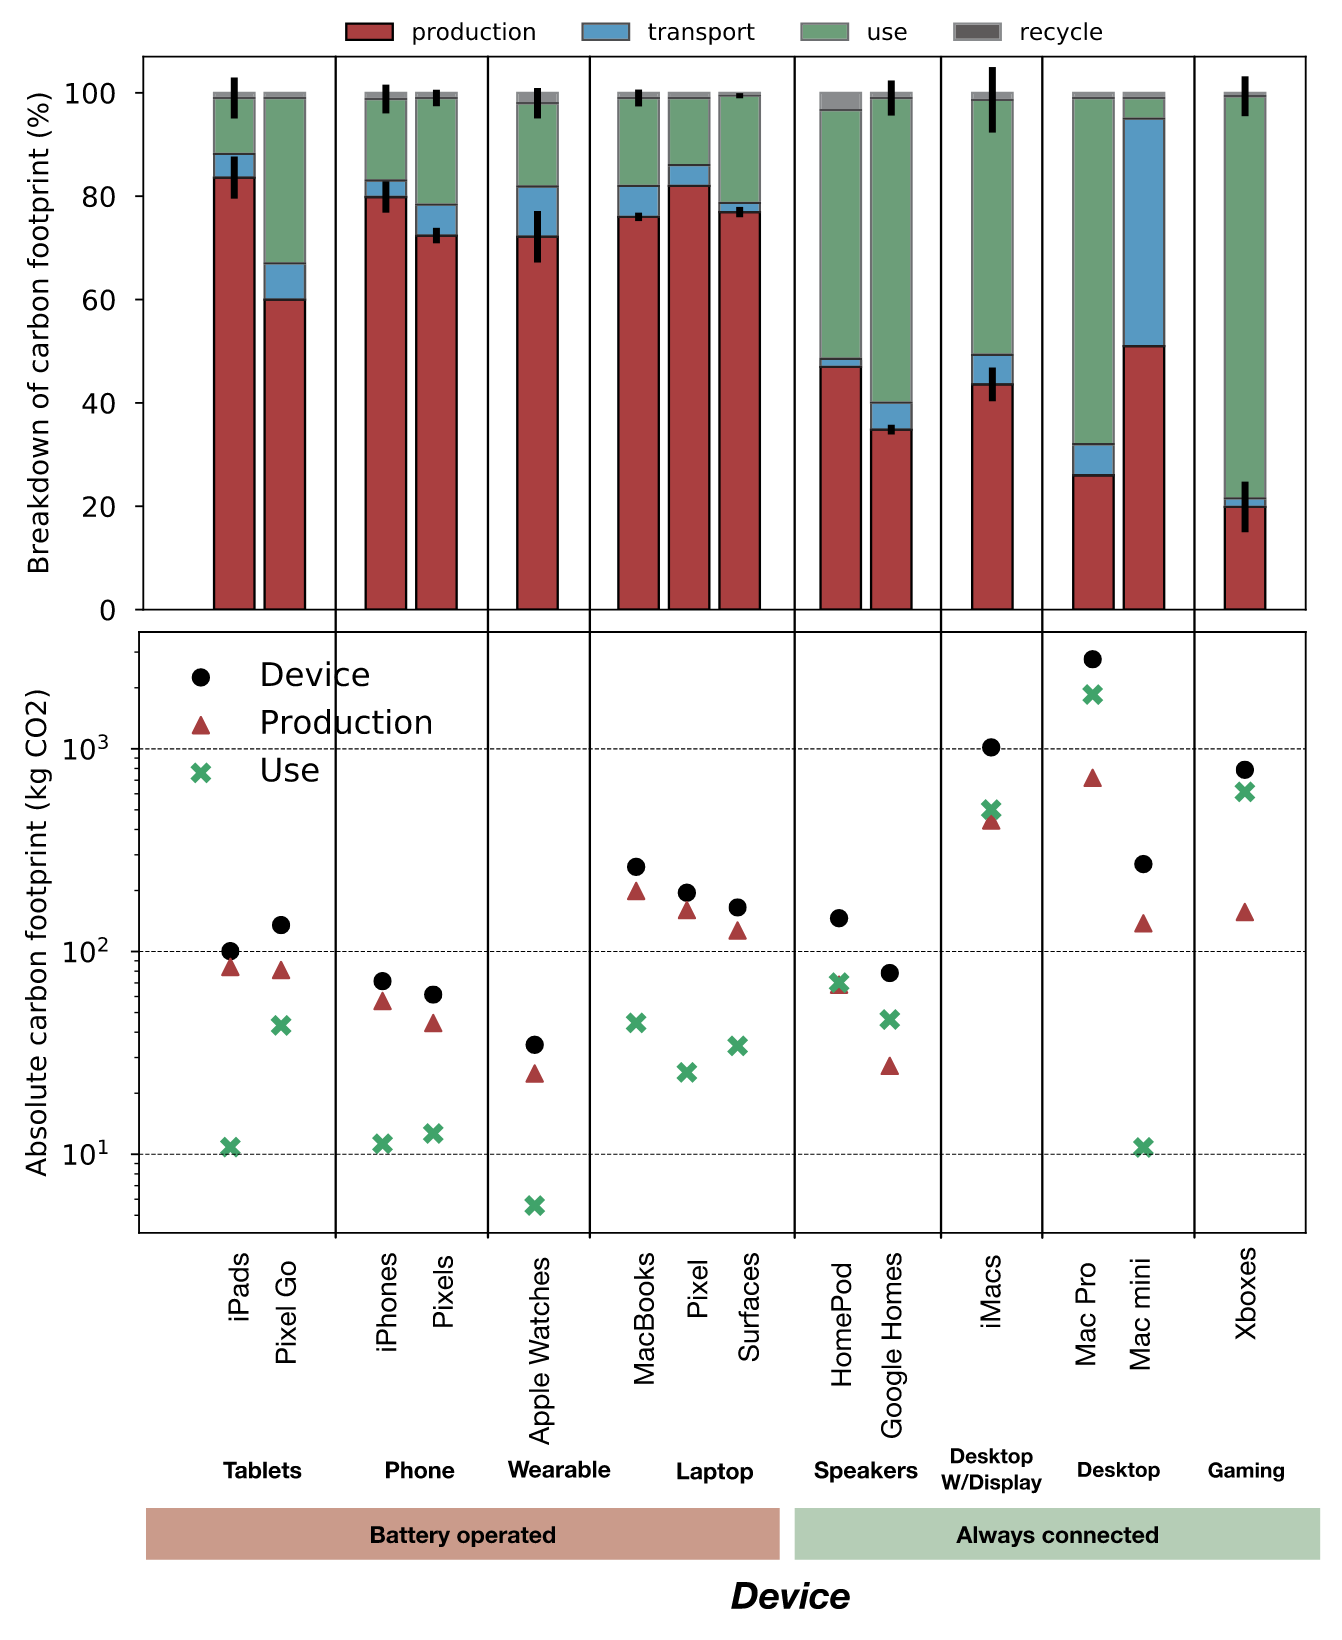
FIGURE 3. Breakdown of carbon emissions for various Apple, Google, and Microsoft personal-computing platforms. As the top chart shows, hardware manufacturing dominates the carbon output for battery-powered devices (e.g., phones, wearables, and tables); most emissions for always connected devices (e.g., laptops, desktops, and game consoles) come from product use. The bottom chart shows the absolute carbon output of battery powered and always connected devices. Overall, carbon footprint (total, manufacturing, and use) is variable and scales with the platform.
@CarbonTrust.Globale-SustainabilityInitiative.2017.ICTSectorGuidance
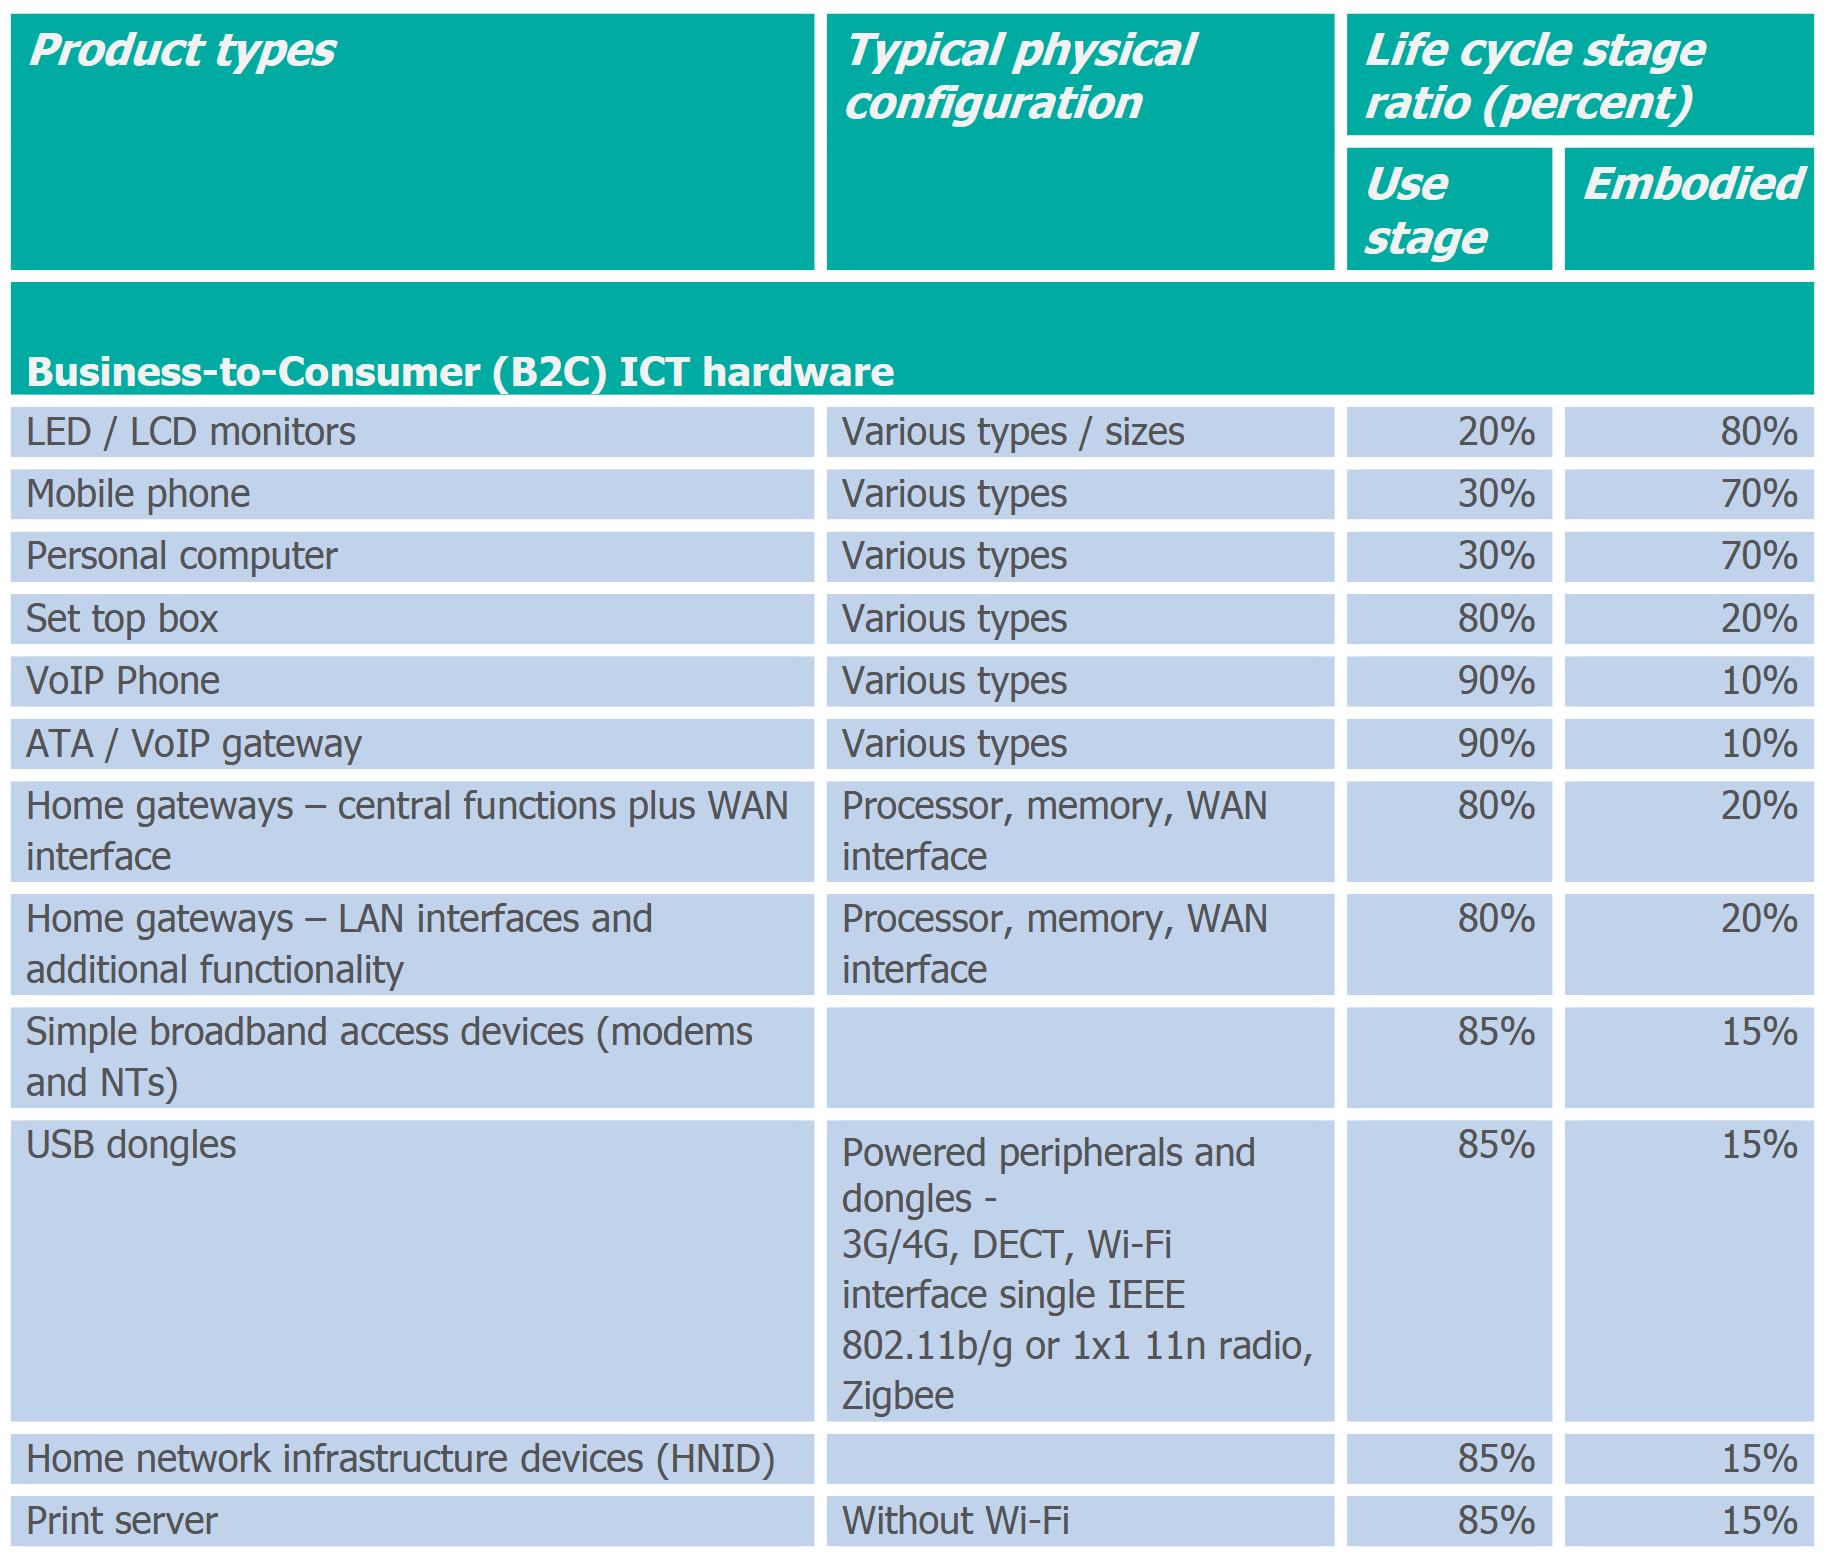
Examples of business-to-consumer ICT hardware life cycle stage ratio profiles
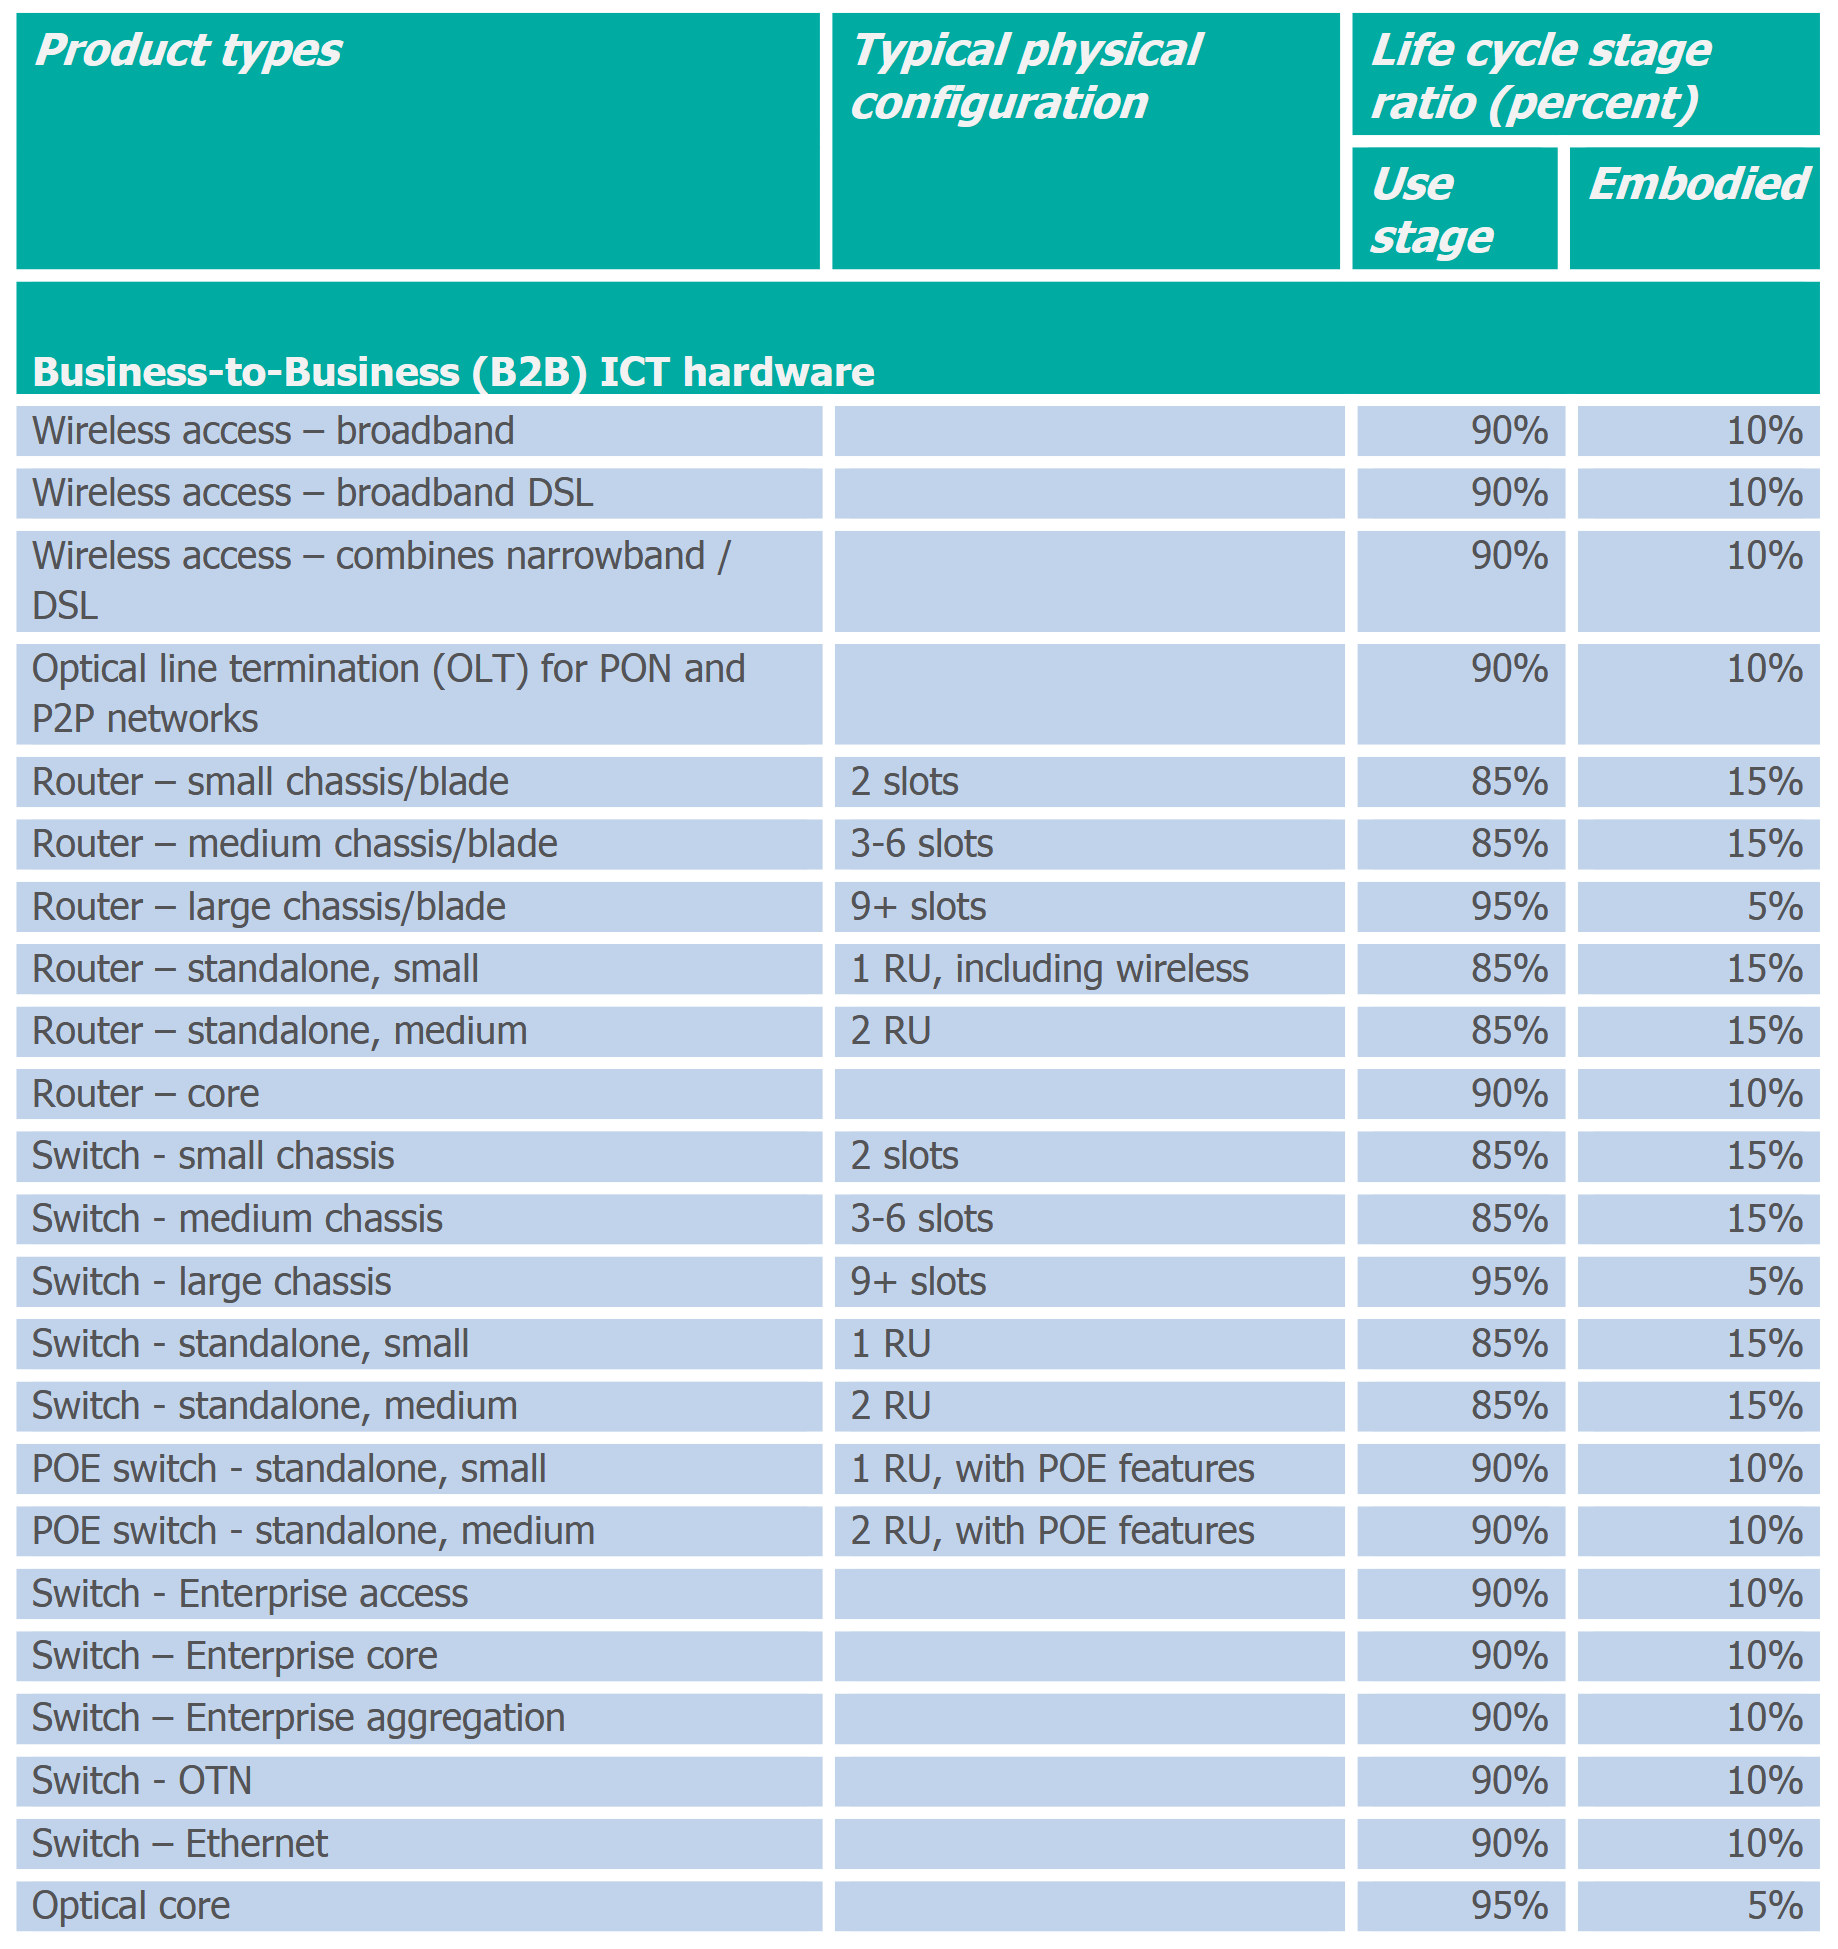
Examples of business-to-business ICT hardware life cycle stage ratio profiles
Individual Devices
Services / Databases
Overview
@Lovehagen.etal.2023.AssessingEmbodiedCarbon
Smartphones
Carbon footprint of smartphones
Notebooks
While extending the lifespan of notebook computers is necessary for reducing the climate impact of the IT sector, not all of them are designed for a long life.
[…]
When a notebook is replaced every six years instead of every four, you end up with a total of 53.1 kg of carbon dioxide equivalents per year, instead of 74.7 kg. This is a reduction of around 21.6 kg per year, or 28.9 percent.
— Circularity in practice: How to manage notebook computers responsibly - TCO Certified
Microsoft Surface Emissions Estimator
Servers
Emissions per Component
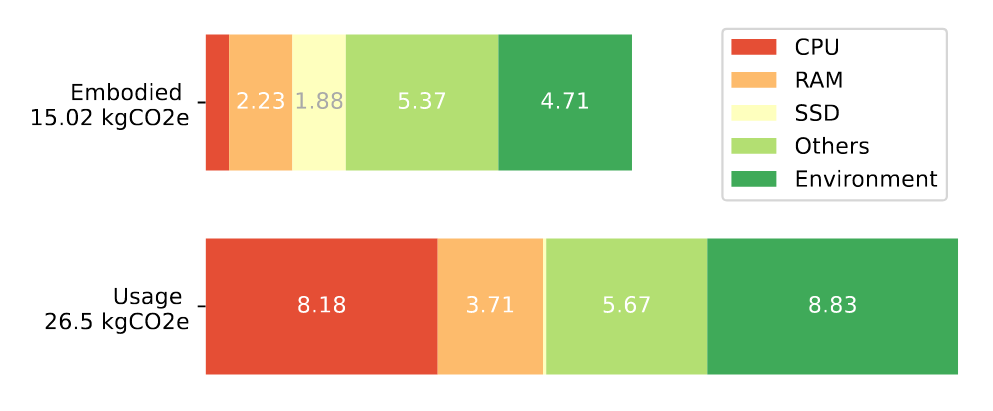
Figure 3: GWP impact of a cloud instance hosted in France with 4 vCPUs, 8 GB of vRAM and 80 GB of SSD storage used for a year, calculated using Equation 10
Dell Servers
2019 R640 Dell Server: 1280 embodied kg CO2e
For example, a 2019 R640 Dell Server has an amortized embedded carbon cost of 320 kg CO2eq/year. It's also expected to consume 1760.3 kWh/year of electricity. The average carbon intensity in the EU was 0.276 kg CO2eq/kWh for 2019.
Therefore, the total carbon cost will be 320 + (0.276 * 1760.3) = 805 kg of carbon/year, of which 320 kilograms or about 40% is from the embodied carbon. Embodied carbon is a significant contributor to the total emitted carbon of servers.
— Principle 4: Embodied carbon - Training | Microsoft Learn
2019 R740 Dell Server: 1313 embodied kg CO2e
In the example of the Dell R740, the PCF sheet gives us a global impact of 8640 kgCO2eq, so we obtain: 8640 x 15.2% = 1313 kgCO2eq for manufacturing
— Digital & environment : How to evaluate server manufacturing footprint, beyond greenhouse gas emissions? | Boavizta
Servers Impacts Calculator (Boavizta#Datavizta)
Lifespan
SSDs & HDDs
Carbon Footprint of Storage – HDD vs. SSD